OATAO is an open access repository that collects the work of Toulouse
researchers and makes it freely available over the web where possible
Any correspondence concerning this service should be sent
to the repository administrator:
[email protected]
This is a
n autheur’s version published in: http://oatao.univ-toulouse.fr/25
593
To cite this version:
Ye, Jianglin and Wu, Yih-Chyng and Xu, Kui and Ni, Kun and Shu, Na and
Taberna, Pierre-Louis and Zhu, Yanwu and Simon, Patrice Charge Storage
Mechanisms of Single-Layer Graphene in Ionic Liquid. (2019) Journal of the
American Chemical Society, 141 (42). 16559-16563. ISSN 0002-7863
Charge Storage Mechanisms of Single-Layer Graphene in Ionic
Liquid
Jianglin Ye,
†,‡,⊥Yih-Chyng Wu,
‡,§,⊥Kui Xu,
‡,§Kun Ni,
†Na Shu,
†Pierre-Louis Taberna,
‡,§Yanwu Zhu,
*
,†and Patrice Simon
*
,‡,§†Hefei National Research Center for Physical Sciences at the Microscale, CAS Key Laboratory of Materials for Energy Conversion,
and Department of Materials Science and Engineering, University of Science and Technology of China, Hefei, Anhui 230026, P. R. China
‡CIRIMAT UMR CNRS 5085, Université Paul Sabatier, 118 route de Narbonne, 31062 Toulouse, France §Réseau sur le Stockage Electrochimique de l’Energie (RS2E), CNRS FR3459, 80039 Amiens, France
ABSTRACT: Graphene-based carbon materials are promising candidates for electrical double-layer (EDL) capacitors, and there is considerable interest in under-standing the structure and properties of the graphene/ electrolyte interface. Here, electrochemical impedance spectroscopy (EIS) and electrochemical quartz crystal microbalance (EQCM) are used to characterize the ion fluxes and adsorption on single-layer graphene in neat ionic liquid (EMI-TFSI) electrolyte. It is found that a positively charged ion-species desorption and ion reorganization dominate the double-layer charging during positive and negative polarizations, respectively, leading to the increase in EDL capacitance with applied potential.
E
lectrochemical double-layer capacitors (EDLCs), also known as supercapacitors, store energy by reversible electrostatic attraction of electrolyte ions onto high surface area carbon electrodes. Since the limitation of battery-like charge transfer kinetics is not involved, supercapacitors can operate at very high charge and discharge rates within a few seconds, and can have excellent cyclability of over a million cycles, which makes them useful in a broad range of energy applications.1,2As an excellent building block for three-dimensional (3-D) carbons electrode, graphene with its high theoretical specific surface area of 2630 m2g−1and theoretical capacity of up to 550 F g−1(21μF cm−2) has already attracted great attention for supercapacitor applications.3,4 Indeed, graphene and its derivatives have been reported to achieve electrode double-layer (EDL) capacitances beyond 200 F g−1.5−7 Multilayer stacked graphene film electrodes, on the other hand, show great potential in small-scale supply for powering the next generation of microelectronic devices.8,9
Despite the efforts mentioned above, current performances achieved by graphene-based materials are still far from expectations.10 The quantum capacitance (CQ) of graphene, which is related to the density of carriers at and near the Dirac point,11−14 as well as the electrostatic interactions at the carbon/electrolyte interface,15has been demonstrated to play a key role in the establishment of EDL capacitance. Indeed, for
high-surface-area materials such as graphene and highly porous carbons, it is critical to understand the charging mechanisms of the EDL at the electrolyte/carbon interface from the liquid side, in addition to the space charge distribution or quantum capacitance related to the electronic properties of graphene. Unfortunately, the dynamic of the charge separation at graphene-electrolyte interface still remains an unresolved puzzle, although a molecular-scale insight has been obtained by X-ray reflectivity (XR) and molecular dynamics (MD) simulation,16,17hampering the development of high-perform-ance 2- and 3-D electrodes based on graphene. In this sense, single-layer graphene (SLG) with low defect content may provide a model platform for fundamental understanding of ionic adsorption-interaction in the vicinity of graphene under polarization, which prevents from any ion confinement effect. Besides, SLG allows experimental mimicking of the behaviors of ions from an electrolyte in contact with an ultrahigh-surface-area carbon surface, while it is less influenced by the complex porosity or defects in most carbon materials reported.
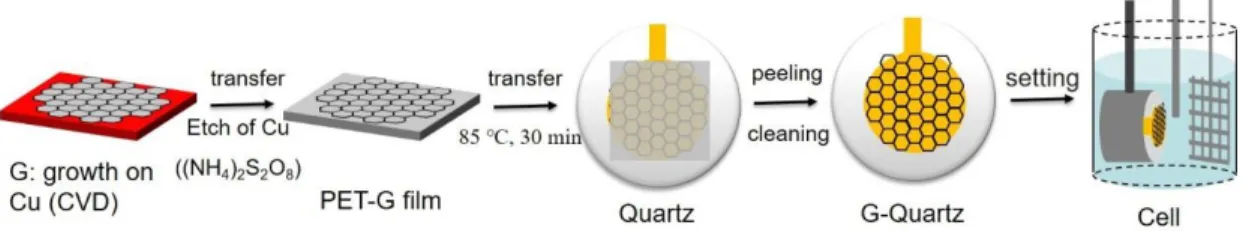
In this work, we report for the first time about in situ probing of ion fluxes at SLG electrode surface using electrochemical quartz crystal microbalance (EQCM). EQCM is an efficient gravimetric probe for studying the compositional changes in electrode materials deposited on piezoelectric quartz resonator.18−20 Figure S1 (Supporting Information (SI)) shows the transfer process of SLG, in which a homogeneous graphenefilm rigidly attaches to the Au-coated quartz crystal (Au is the current collector).21 Raman spectroscopy (Figure 1a) reveals a typical signal of SLG with distinct G- and 2D-bands.22 The G-band shifts to a higher wavenumber (∼1597 cm−1) compared to that of charge-neutral graphene (1581 cm−1), and the intensity ratio of 2D-and G-b2D-and is around 1 with a negligible defect (D) peak, indicating the p-doping in graphene used in this study.22 In addition, the optical microscopy image (Figure 1c) reveals that over 90% of the Au coated quartz surface was covered with SLG. These cracks are unavoidable due to the intrinsic mechanical stress on SLG and the laminated transfer method used here.23The thickness obtained from AFM image (Figure
1d) is around 0.8 nm for SLG; the observed ripples can be ascribed to the wrinkles of graphene made by chemical vapor deposition (CVD).
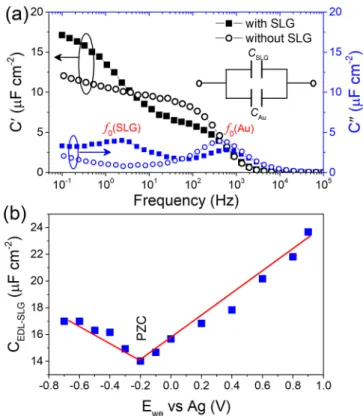
To examine the electrochemical properties of SLG, electro-chemical impedance spectroscopy (EIS) measurements in 1-ethyl-3-methylimidazolium bis(trifluoromethanesulfonyl)imide (EMI-TFSI), which is a widely used room-temperature ionic liquid (RTIL) electrolyte in supercapacitors, were carried out at different constant potentials. The real C′(ω) and imaginary C″(ω) parts of the capacitance were extracted from Nyquist plots (Figures S2 and S3), in which C′(ω) corresponds to the EDL capacitance (CEDL), while C″(ω) accounts for dissipative processes.24 Figure 2a shows the typical tendency of C′(ω) with the frequency at a bias potential of +0.2 V/ref for SLG. As expected, C′(ω) increases when the frequency decreases, and then becomes less frequency dependent below the knee frequency at around 200 and 1 Hz, respectively. However, capacitance saturation was not observed even at 0.1 Hz, especially for high-potential polarization (Figure S4) partially because of the leakage current (∼0.05 μA,Figure S5) from side reactions. C″(ω) goes through two maxima at characteristic frequencies f0 of 610 and 2.5 Hz, corresponding to a time constant (τ0 = 1/f0) of 1.6 and 395 ms, respectively.25 Comparably, the quartz substrate without SLG coating only shows one peak in C″(ω) at 413 Hz. As a result, the SLG and exposed Au current collector are in parallel to contribute to the total capacitance in this system. The relaxation response at low frequency (2.5 Hz) is assumed to correspond to the double-layer charging process on SLG alone, which is comparable to that of reported graphene nanosheet, highly curved gra-phene.5,26Furthermore, f0shifts to a lower value (correspond-ing to aτ0of 870 ms) at more negative polarization (Figure
S4a), suggesting that the detailed charging mechanism and dynamical response of SLG may depend on applied potential. For each time constant (τ), the capacitance response C(ω) can be described using a Debye model through the following equation:
ω = + ωτ
C( ) C/(1 j )
At the peak of C″(f0), ωτ is 1, and the total CEDL can be calculated as CEDL = 2C′.25 The change of area-normalized EDL capacitance versus potential is plotted in Figure 2b for SLG after removing the contribution of Au in neat EMI-TFSI. The CEDL‑SLGEwecurve shows a dependence on the electrode potential with a distinct‘V’ shape with respect to the potential of zero charge (PZC), measured at −0.2 V/ref. The capacitance increases near-linearly with potential with a slope of∼7 μF cm−2V−1for negative polarization, and∼9 μF cm−2 V−1 for positive polarization, respectively, which are slightly lower than that of SLG supported on SiO2.11In contrast, the quartz without SLG coating shows a stable CEDL with the potential (Figure S6). Furthermore, the correlations obtained from Mott−Schottky plots of SLG are consistent with the charge conservation principle appearing in p-type semi-conductors (Figure S7).27 In previous work, V-shaped CE curves of graphene were explained by using a model including a potential-regulated CQ added in series to a constant Helmholtz capacitance (CH, 1/CEDL = 1/CQ + 1/CH).3,11 However, CQ values, calculated from standard band theory, cannot explain the high EDL capacitance of single- or few-layer graphene observed.28This may be explained by the fact that the calculation of CQdid not take into account the ion-carbon interaction. In fact, CQ has a strong dependence on the intrinsic properties of carbon (typically, defects) and also the carbon/electrolyte correlations (e.g., ionic concentration).29 Furthermore, Ji et al.12used the theoretical CQto extract the contribution of CH from experimental CEDLVEDL data in KOH electrolyte. They found that CHincreases dramatically with potential for a SLG electrode, which can be attributed to the strong correlations between electrons in graphene and ions
Figure 1.Characterizations of graphene transferred onto Au coated quartz substrate. (a) Raman spectra of SLGfilm. (b, c) Optical images of transferred distinct uncovered Au surface. (d) Atomic force microscopy (AFM) image of the edge and surface of graphenefilm.
Figure 2. (a) Real part C′(ω) and imaginary part C″(ω) of the capacitance on electrodes with or without SLG coated in neat EMI-TFSI electrolyte recorded at +0.2 V versus ref. Inset shows the equivalent circuit model. (b) CEDL‑SLG−Ewecurve of SLG supported
in electrolyte. Further investigations are needed to enable a better understanding of the detailed capacitance response at graphene/ionic liquid interface.
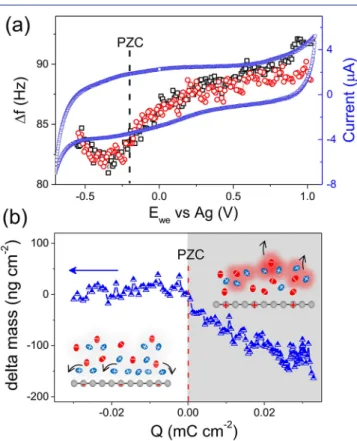
To that aim, EQCM technique was used to track ionfluxes and adsorption (interaction) on (with) SLG during polar-ization, which can help to distinguish the EDL response from the intrinsic electronic properties of graphene. The cyclic voltammogram (CV) of SLG in neat EMI-TFSI (Figure 3a)
shows a typical capacitive behavior. The associated electrode frequency changes (Δf vs Ewe) shown in black (oxidation) and red (reduction) circles inFigure 3a overlap, without hysteretic behavior and noticeable motional resistance change (Figure S8).Figure 3b shows the experimental change of the electrode weight (Δm) versus the charge (ΔQ) passed through the electrode, where Δm was calculated from Δf (see SI). The Δm−ΔQ plot shows two different behaviors. For Q ≥ 0, the electrode weight decreases linearly as the charge increases: ions are expelled from SLG. By using Faraday’s law,30the calculated average molecular weight is M/z = 338 g mol−1. Considering the molar weight of EMI+ (111 g mol−1) and TFSI− (280 g mol−1),31it can be proposed that charged species, which can be statistically expressed as [EMI1.58,TFSI0.58]+ with a net charge of +1 (see SI), are leaving the SLG surface to counterbalance the charge. Differently, from PZC to more negative charge, the electrode mass has no significant change. However, a capacitive charge storage behavior is still observed in potential range below −0.2 V, as shown in CV and EIS. These results highlight the key difference of ion dynamics and
adsorption onto a SLG surface under polarization, which are distinct from that of pure quartz substrate (Figure S9).
For graphene/RTIL planar interface, it has been demon-strated that an ions-densified compact layer is developed principally via the strongπ−π interaction between cations and graphene sheet when no charge is applied.16,32,33The excessive ions at interface may be a reason for the observed continuous expulsion of positively charged ion-species in the vicinity of graphene surface due to the positively image charges-ions repulsion (inset of Figure 3b). In this case, one net charge stored on/released from the electrode does not correspond to just one single ion desorption/adsorption since the strong TFSI-EMI interaction leads to an ion-cluster-like charge carries effect. Such ion−ion electrostatic correlations are strong (typically, a value of 78.8 kcal/mol has been reported),34,35 and bound ion pairs are ubiquitous in RTIL that have been demonstrated by thermodynamics simulation and surface force apparatus.36In addition, such a co-ion desorption-like behavior should increase entropy associated with charging, minimizing the enthalpic penalty, and thus shall improve the performance of graphene electrode.37,38During negative polarization, on the other hand, the absence of significant mass change indicates that the applied potential cannot bring more species onto SLG surface, thus very likely implying an ion reorganization in compact layer for negative charge storage. To gain further insight, simulations were performed on SLG/EMI-TFSI interface with charge density varying from 0.00 to 0.04 e−/C atom (see SI). The strong electron−ion correlation forces parallel alignment between the alkyl chain of EMI+ and SLG surface (Figures S10 and S11) and brings them in closer contact. This preferred orientation of cations is in good agreement with previous studies about charged graphene electrode in RTIL.17,39It should be noted that the observed ion fluxes during cycling may be required in the entire screening layer (defined by the decay length of EQCM).40The present EQCM result shows a potential dependent EDL structure at SLG/RTIL interface, which evolves by at least two processes, resulting in the relaxation differences observed in EIS. In this regard, ion reorientation within dense compact layer seems to own a slower kinetics due to the ion packing effect.37Our results suggest a surface-bound ions dominated charging process on SLG in neat IL, which is completely different from that of porous carbons.18,37,41It also highlights the important role of electrostatic correlations on ion fluxes and ion separation at a nonporous carbon interface, introduced by long-range Coulombic force.
In conclusion, we delivered a qualitative demonstration of the combination of EQCM and SLG in neat EMI-TFSI. Scanning from PZC toward positive charge, positively charged ion-species were expelled. Yet, from PZC to negative charge, the orientation of ions changed, resulting in more compact packing. We anticipate that this study could provide nanoscale insight of the EDL at graphene or ultrahigh surface area carbon/RTIL interface. Also, we expect with the extension of this work, from single-layer to multilayered graphene, the fundamental ion dynamics of graphene-based materials can be deeply investigated in the future.
■
ASSOCIATED CONTENT*
S Supporting InformationThe Supporting Information is available free of charge on the
ACS Publications websiteat DOI:10.1021/jacs.9b07134.
Figure 3.(a) CV and EQCM frequency response and (b) electrode mass change versus charge during the polarization of SLG on gold substrate in neat EMI-TFSI recorded at 50 mV s−1. Inset: scheme showing the ionfluxes on SLG surface during polarization. The free EMI+cations are in blue, the free TFSI−anions are in red, and the
Experimental details, characterization conditions, mod-eling method, data processing, supportingfigures (PDF)
■
AUTHOR INFORMATION Corresponding Authors *[email protected] *[email protected] ORCID Kui Xu:0000-0002-1091-1401 Pierre-Louis Taberna:0000-0002-5310-0481 Yanwu Zhu: 0000-0002-7505-1502 Patrice Simon:0000-0002-0461-8268 Author Contributions ⊥J.Y. and Y.-C.W. contributed equally.
Notes
The authors declare no competingfinancial interest.
■
ACKNOWLEDGMENTSJ.Y. thanks the support from China Scholarship Council (CSC). This work was supported by Natural Science Foundation of China (Grant Nos. 51772282, 51972299). P.S. acknowledges the Agence Nationale de la Recherche (labex Store-ex).
■
REFERENCES(1) Simon, P.; Gogotsi, Y. Materials for electrochemical capacitors. Nat. Mater. 2008, 7, 845−854.
(2) Lin, Z. F.; Goikolea, E.; Balducci, A.; Naoi, K.; Taberna, P.-L.; Salanne, M.; Yushin, G.; Simon, P. Materials for supercapacitors: When Li-ion battery power is not enough. Mater. Today 2018, 21, 419−436.
(3) Liu, D. B.; Ni, K.; Ye, J. L.; Xie, J.; Zhu, Y. W.; Song, L. Tailoring the Structure of Carbon Nanomaterials toward High-End Energy Applications. Adv. Mater. 2018, 30, 1802104.
(4) El-Kady, M. F.; Shao, Y. L.; Kaner, R. B. Graphene for batteries, supercapacitors and beyond. Nat. Rev. Mater. 2016, 1, 16033.
(5) Zhu, Y. W.; Murali, S.; Stoller, M. D.; Ganesh, K.; Cai, W. W.; Ferreira, P. J.; Pirkle, A.; Wallace, R. M.; Cychosz, K. A.; Thommes, M.; Su, D.; Stach, E. A.; Ruoff, R. S. Carbon-based supercapacitors produced by activation of graphene. Science 2011, 332, 1537−1541.
(6) Chen, X.; Paul, R.; Dai, L. M. Carbon-based supercapacitors for efficient energy storage. Natl. Sci. Rev. 2017, 4, 453−489.
(7) Xu, Y.; Lin, Z.; Zhong, X.; Huang, X.; Weiss, N. O.; Huang, Y.; Duan, X. Holey graphene frameworks for highly efficient capacitive energy storage. Nat. Commun. 2014, 5, 4554.
(8) Wu, Z.-S.; Tan, Y.-Z.; Zheng, S.; Wang, S.; Parvez, K.; Qin, J.; Shi, X.; Sun, C.; Bao, X.; Feng, X.; Müllen, K. Bottom-up fabrication of sulfur-doped graphene films derived from sulfur-annulated nanographene for ultrahigh volumetric capacitance micro-super-capacitors. J. Am. Chem. Soc. 2017, 139, 4506−4512.
(9) Ye, J. L.; Tan, H. B.; Wu, S. L.; Ni, K.; Pan, F.; Liu, J.; Tao, Z. C.; Qu, Y.; Ji, H. X.; Simon, P.; Zhu, Y. W. Direct Laser Writing of Graphene Made from Chemical Vapor Deposition for Flexible, Integratable Micro-Supercapacitors with Ultrahigh Power Output. Adv. Mater. 2018, 30, 1801384.
(10) Raccichini, R.; Varzi, A.; Passerini, S.; Scrosati, B. The role of graphene for electrochemical energy storage. Nat. Mater. 2015, 14, 271−279.
(11) Xia, J.; Chen, F.; Li, J.; Tao, N. Measurement of the quantum capacitance of graphene. Nat. Nanotechnol. 2009, 4, 505−509.
(12) Ji, H. X.; Zhao, X.; Qiao, Z. H.; Jung, J.; Zhu, Y. W.; Lu, Y.; Zhang, L. L.; MacDonald, A. H.; Ruoff, R. S. Capacitance of carbon-based electrical double-layer capacitors. Nat. Commun. 2014, 5, 3317.
(13) Stoller, M. D.; Magnuson, C. W.; Zhu, Y.; Murali, S.; Suk, J. W.; Piner, R.; Ruoff, R. S. Interfacial capacitance of single layer graphene. Energy Environ. Sci. 2011, 4, 4685−4689.
(14) Chen, J. F.; Han, Y.; Kong, X. H.; Deng, X.; Park, H. J.; Guo, Y. L.; Jin, S.; Qi, Z. K.; Lee, Z.; Qiao, Z. H.; Ruoff, R. S.; Ji, H. X. The Origin of Improved Electrical Double-Layer Capacitance by Inclusion of Topological Defects and Dopants in Graphene for Supercapacitors. Angew. Chem., Int. Ed. 2016, 55, 13822−13827.
(15) Fedorov, M. V.; Kornyshev, A. A. Towards understanding the structure and capacitance of electrical double layer in ionic liquids. Electrochim. Acta 2008, 53, 6835−6840.
(16) Zhou, H.; Rouha, M.; Feng, G.; Lee, S. S.; Docherty, H.; Fenter, P.; Cummings, P. T.; Fulvio, P. F.; Dai, S.; McDonough, J.; et al. Nanoscale perturbations of room temperature ionic liquid structure at charged and uncharged interfaces. ACS Nano 2012, 6, 9818−9827.
(17) Uysal, A.; Zhou, H.; Feng, G.; Lee, S. S.; Li, S.; Fenter, P.; Cummings, P. T.; Fulvio, P. F.; Dai, S.; McDonough, J. K.; Gogotsi, Y. Structural origins of potential dependent hysteresis at the electrified graphene/ionic liquid interface. J. Phys. Chem. C 2014, 118, 569−574. (18) Tsai, W.-Y.; Taberna, P.-L.; Simon, P. Electrochemical quartz crystal microbalance (EQCM) study of ion dynamics in nanoporous carbons. J. Am. Chem. Soc. 2014, 136, 8722−8728.
(19) Wu, Y.-C.; Taberna, P.-L.; Simon, P. Tracking ionic fluxes in porous carbon electrodes from aqueous electrolyte mixture at various pH. Electrochem. Commun. 2018, 93, 119−122.
(20) Robin, J.; Dolleman, M. H.; Sten, V.; John, E. S.; Herre, S. J.; Zant, V. D.; Steeneken, P. G.; Ghatkesar, M. K. Mass measurement of graphene using quartz crystal microbalances. Eprint arXiv 2019, 1902, 11098.
(21) Zhang, Q.; Levi, M. D.; Chai, Y. G.; Zhang, X.; Xiao, D. W.; Dou, Q. Y.; Ma, P. J.; Ji, H. X.; Yan, X. B. Vacuum Filtration-and-Transfer Technique Helps Electrochemical Quartz Crystal Micro-balance to Reveal Accurate Charge Storage in Supercapacitors. Small Methods 2019, 1900246.
(22) Wu, Y.; Jiang, W.; Ren, Y.; Cai, W.; Lee, W. H.; Li, H.; Piner, R. D.; Pope, C. W.; Hao, Y.; Ji, H.; Kang, J.; Ruoff, R. S. Tuning the doping type and level of graphene with different gold configurations. Small 2012, 8, 3129−3136.
(23) Li, X.; Zhu, Y.; Cai, W.; Borysiak, M.; Han, B.; Chen, D.; Piner, R. D.; Colombo, L.; Ruoff, R. S. Transfer of large-area graphene films for high-performance transparent conductive electrodes. Nano Lett. 2009, 9, 4359−4363.
(24) Soon, J. M.; Loh, K. P. Electrochemical double-layer capacitance of MoS2 nanowall films. Electrochem. Solid-State Lett. 2007, 10, A250−A254.
(25) Taberna, P.-L.; Simon, P.; Fauvarque, J.-F. Electrochemical characteristics and impedance spectroscopy studies of carbon-carbon supercapacitors. J. Electrochem. Soc. 2003, 150, A292−A300.
(26) Miller, J. R.; Outlaw, R. A.; Holloway, B. C. Graphene double-layer capacitor with ac line-filtering performance. Science 2010, 329, 1637−1639.
(27) Bott, A. W. Electrochemistry of semiconductors. Curr. Sep. 1998, 17, 87−92.
(28) Yoo, J. J.; Balakrishnan, K.; Huang, J.; Meunier, V.; Sumpter, B. G.; Srivastava, A.; Conway, M.; Mohana Reddy, A. L.; Yu, J.; Vajtai, R.; Ajayan, P. M. Ultrathin planar graphene supercapacitors. Nano Lett. 2011, 11, 1423−1427.
(29) Li, J.; Pham, P. H. Q.; Zhou, W.; Pham, T. D.; Burke, P. J. Carbon-Nanotube−Electrolyte Interface: Quantum and Electric Double Layer Capacitance. ACS Nano 2018, 12, 9763−9774.
(30) Telegdi, J.; Shaban, A.; Kálmán, E. EQCM study of copper and iron corrosion inhibition in presence of organic inhibitors and biocides. Electrochim. Acta 2000, 45, 3639−3647.
(31) Susan, M. A. B. H.; Kaneko, T.; Noda, A.; Watanabe, M. Ion gels prepared by in situ radical polymerization of vinyl monomers in an ionic liquid and their characterization as polymer electrolytes. J. Am. Chem. Soc. 2005, 127, 4976−4983.
(32) Bazant, M. Z.; Storey, B. D.; Kornyshev, A. A. Double layer in ionic liquids: Overscreening versus crowding. Phys. Rev. Lett. 2011, 106, No. 046102.
(33) Shi, G.; Chen, L.; Yang, Y.; Li, D.; Qian, Z.; Liang, S.; Yan, L.; Li, L. H.; Wu, M.; Fang, H. Two-dimensional Na−Cl crystals of unconventional stoichiometries on graphene surface from dilute solution at ambient conditions. Nat. Chem. 2018, 10, 776−779.
(34) Lee, A. A.; Vella, D.; Perkin, S.; Goriely, A. Are room-temperature ionic liquids dilute electrolytes? J. Phys. Chem. Lett. 2015, 6, 159−163.
(35) Tsuzuki, S.; Tokuda, H.; Hayamizu, K.; Watanabe, M. Magnitude and directionality of interaction in ion pairs of ionic liquids: Relationship with ionic conductivity. J. Phys. Chem. B 2005, 109, 16474−16481.
(36) Gebbie, M. A.; Valtiner, M.; Banquy, X.; Foxd, E. T.; Foxd; Hendersond, W. A.; Israelachvilia, J. N.; et al. Ionic liquids behave as dilute electrolyte solutions. Proc. Natl. Acad. Sci. U. S. A. 2013, 110, 9674−9679.
(37) Forse, A. C.; Merlet, C.; Griffin, J. M.; Grey, C. P. New perspectives on the charging mechanisms of supercapacitors. J. Am. Chem. Soc. 2016, 138, 5731−5744.
(38) Kondrat, S.; Kornyshev, A. A. Pressing a spring: what does it take to maximize the energy storage in nanoporous supercapacitors? Nanoscale Horiz. 2016, 1, 45−52.
(39) Paek, E.; Pak, A. J.; Hwang, G. S. A computational study of the interfacial structure and capacitance of graphene in [BMIM][PF6] ionic liquid. J. Electrochem. Soc. 2013, 160, A1−A10.
(40) Levi, M. D.; Daikhin, L.; Aurbach, D.; Presser, V. Quartz crystal microbalance with dissipation monitoring (EQCM-D) for in-situ studies of electrodes for supercapacitors and batteries: A mini-review. Electrochem. Commun. 2016, 67, 16−21.
(41) Prehal, C.; Koczwara, C.; Amenitsch, H.; Presser, V.; Paris, O. Salt concentration and charging velocity determine ion charge storage mechanism in nanoporous supercapacitors. Nat. Commun. 2018, 9, 4145.
S1
■
I. Experimental procedures and simulation method S2
II. Data processing S3-S4
III. Additional Figures S5-S10
IV. References S10
S2
Ⅰ. Experimental procedures and characterization conditions
1. Transfer of graphene onto Au-coated quartz crystal
BioLogic 1-in.-diameter Au-coated quartz crystals (oscillating frequency, f0, 5 MHz) were coated by single layer graphene (SLG). The transfer process of SLG is shown in Figure S1. Firstly, the graphene (G) films were obtained by chemical vapor deposition (CVD) on copper (Cu) substrate. After etching by 0.1 M of ammonium persulfate ((NH4)2S2O8), the transfer of CVD graphene from Cu to pressure sensitive adhesive (PSA) films coated polyethylene terephthalate (PET) substrate was carried out, as previously reported with modification.1,2 The obtained large area PET-graphene films (PET-G) were used to further assist the transfer of graphene to quartz at around 85 ℃ for 30 min. The SLG-coated quartz was dried in an oven at 60 ℃ for overnight after the PET films were peeled.
Figure S1. Transfer process of single layer graphene on Au-coated quartz substrate.
2. Electrochemical quartz crystal microbalance setup (EQCM) and EIS measurement
The SLG coated quartz crystal working electrode was placed on a PTFE holder, in which the coated side was orientated toward the reference and counter electrode in a 3-electrode electrochemical cell (Figure S1). The counter electrode was a platinum-coated titanium mesh. The silver wire was used as quasi-reference electrode placed between working and counter electrodes. Three electrodes were set in a glassware and immersed in neat EMI-TFSI electrolyte. All the EQCM electrochemical measurements were carried out with a Maxtek RQCM system combined with Autolab PGSTAT101 for simultaneous EQCM and electrochemical measurements. Electrochemical impedance spectroscopy (EIS) measurements were carried out with a VMP3 electrochemical working station (Biologic, S.A.). The frequency range studied was 100 kHz to 50 mHz, and the measurements were made at different potentials in the range of 0.7 to 0.9 V versus an Ag reference electrode. The DV signal amplitude applied was 10 mV.
3. Physical characterizations
Graphene characterizations were performed by atomic force microscopy (AFM, Veeco Nanoscope Icon, US), Raman (Labram HR800, 532 nm laser, France) and optical microscopy (JEOL JSM6400, Japan) for surface and structure analysis.
Ⅱ. Simulation method
Classical molecular dynamics (MD) simulation was performed by using Forcite program based on the Materials Studio. The MD thermal relaxation contains four steps. Step I is geometry optimization of pre-built structure containing random EMI-TFSI configuration
S3
generated by Amorphous Cell program in Materials studio. Step II is a 3 ns MD thermal relaxation under NVT ensemble. Step III is a 1ns MD annealing process from 300 K to 1 K to gradually freeze the structure. Step IV is also a geometry optimization to get the final structure. The length of OA and OB lattice vector is 29.3124 and 29.6114 angstrom and fits the lattice of graphene. The length of OC lattice vector is 100 Angstrom, which is large enough to build the layer in the vacuum. There are 41 EMI+ and 41 TFSI- ions in our simulation model (corresponding to the concentration) and the SLG electrode contains 336 carbon atoms. The carbon atoms in SLG electrode were fixed in all relaxation processes. The ultra-fine quality preset was adopted for geometry optimization and energy calculation. The electrostatic and van der Waals summation was calculated by Ewald method. It should be noted that this model is not suitable to predict the cluster formation during charging process because of the difference between the vacuum environment of ions in modelling and the liquid electrolyte in real measurement.
Ⅲ. Data processing
For the EQCM, the electrode mass change was calculated using Sauerbrey equation: Δm= -Cf ·Δf, where Δm is the change of mass of the coating and Cf is the sensitivity factor of the crystal. The sensitivity factor of the coated quartz was obtained by performing a copper deposition experiment conducted in 0.1 M CuSO4 mixed with 1 M H2SO4 by applying a constant current of 5 mA for 120 seconds. In this experiment, the Cf was calculated to be 27.7 ng·Hz-1 (or 21.8 ng·Hz-1·cm-2 taking into account the Au crystal electrode surface of 1.27 cm2). For consistent results, few cycles were run before starting EQCM measurements, to start from stable, reproducible electrochemical signatures.
For impedance results, real part Cʹ(ω) and imaginary part Cʺ(ω) of the capacitance (C(ω)) were calculated based on the geometric area of the electrode using the following equation:
Cʹ(ω) = -Z ''(ω) 2πf |Z(ω)|2
,
Cʺ(ω) = Z '(ω) 2πf |Z(ω)|2and
C(ω)=
Cʹ(ω) - jCʺ(ω)where Zʹ(ω) and Zʺ(ω) are the real part and imaginary part of the electrochemical impedance (Z(ω)), respectively, defined as |Z(ω)|2 = Zʹ(ω)2 + Zʺ(ω)2, and f is the frequency. We obtained the varied CEDL of single layer graphene by performing impedance experiments at different potentials, and the potential corresponding to the minimum value of capacitance was determined to be the PZC point, as shown in the reference.3
Furthermore, the molecular weight of charged ion species (𝑀𝑤 ) involved in positive charging was calculated by using Faraday’s law, assuming a 100% faradic efficiency:
𝑀
𝑤𝑛𝐹
=
𝑚
𝑄
S4
where Q is the charge passed in the electrode, m is the corresponding weight change of the electrode during charging process (Δm-ΔQ curve), n is the valence number of the ion species, and F is the Faraday constant (96485 C/mol). Taking the minimum valence number of +1, the average unit of ion species can be statistically expressed by [EMIx,TFSIx-1]+:
𝑥𝑀
𝐸𝑀𝐼+ (𝑥 − 1)𝑀
𝑇𝐹𝑆𝐼= 𝑀
𝑤where 𝑥 is the average molar number, MEMI and MTFSI are the molar mass of EMI+ and TFSI-, respectively.
S5
IV. Additional Figures
Figure S2. Comparison of CV response of bare gold electrode and single layer graphene coated
electrode in EMI-TFSI at 20 mV s-1. The different CV shapes from two samples confirms the presence of SLG before EQCM measurements. W
hen the potential was higher than 1.0 V
(vs Ag) or lower than -0.5 V (vs Ag), sharp increased current can be found, which can
be ascribed to side reactions from possible trace of water and oxygen (electrolysis).
4,50.0 4.0x10⁴ 8.0x10⁴ 0.0 4.0x10⁴ 8.0x10⁴ 0 1000 2000 3000 4000 5000 0 1000 2000 3000 4000 5000 -0.7 V +0.2 V +0.9 V
-Z
(ohm)
Z (ohm)
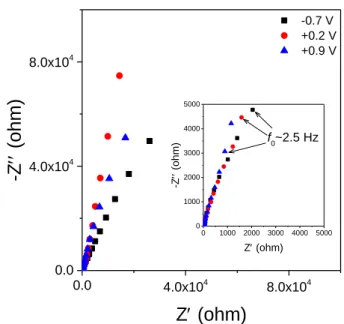
-Z ( o h m) Z (ohm) f0~2.5 HzFigure S3. Typical Nyquist plots of single layer graphene measured at different potentials
versus Ag reference electrode in neat EMI-TFSI. The potentials were limited in the range of 0.7 to +0.9 V in neat EMI-TFSI for EIS measurement.
-1.0 -0.5 0.0 0.5 1.0 1.5 -3.0x10⁻⁷ -2.0x10⁻⁷ -1.0x10⁻⁷ 0.0 1.0x10⁻⁷ 2.0x10⁻⁷ EWE vs Ag (V) Normali ze d curr ent (A) Bare Au Au + SLG EMITFSI
S6
Figure S4. Real parts Cʹ(ω) and imaginary parts Cʺ(ω) of SLG coated quartz electrode in neat
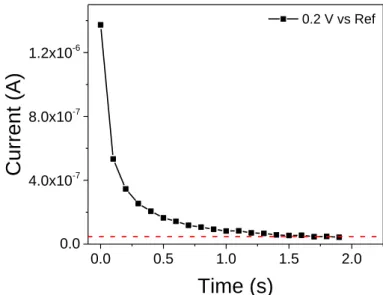
EMI-TFSI electrolyte recorded at several typical potentials of (a): -0.5 V, (b): -0.2 V (PZC) and (c): +0.8 V vs Ref, respectively. 0.0 0.5 1.0 1.5 2.0 0.0 4.0x10⁻⁷ 8.0x10⁻⁷ 1.2x10⁻⁶ 0.2 V vs Ref
Current (A)
Time (s)
Figure S5. I-t response at a constant potential of +0.2 V vs Ref. A constant leakage current of
0.05 μA was measured, as indicated by the dotted line parallel to the X-axis.6 This result shows that the graphene in RTIL electrolyte cannot be considered as an ideal capacitor but has to be represented by a capacitance (C) in combination with a leakage resistance (Rl) in parallel. The residual, constant leakage current is not associated with the double layer charging, but with redox process from the presence of impurities or/and defects. As a result, the capacitance calculated from EIS in the low frequency range includes a contribution from these minor parasitic redox reactions, leading to a small increase of C at low frequency. Thus the determination of C from the time constant is more accurate.
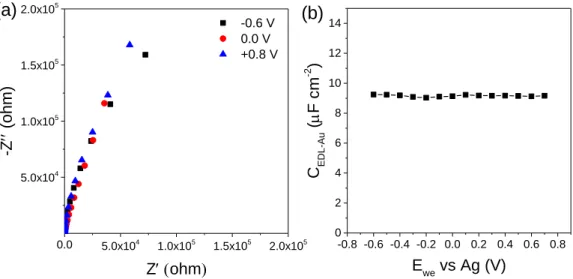
S7 0.0 5.0x10⁴ 1.0x10⁵ 1.5x10⁵ 2.0x10⁵ 5.0x10⁴ 1.0x10⁵ 1.5x10⁵ 2.0x10⁵ -0.8 -0.6 -0.4 -0.2 0.0 0.2 0.4 0.6 0.8 0 2 4 6 8 10 12 14 -0.6 V 0.0 V +0.8 V -Z (ohm ) Z(ohm)
(b)
C E DL -A u ( F c m -2 ) Ewe vs Ag (V)(a)
Figure S6. (a) Typical Nyquist plots of pure Au-coated quartz substrate at various potentials
versus Ag reference electrode in neat EMI-TFSI. (b) CEDL-Au-Ewe curve of Au-coated quartz substrate in neat EMI-TFSI. The measured double-layer capacitance was 9.1 uF cm-2 and varied by 2% within the gate voltage window.
Figure S7. 1/CEDL-SLG2 versus |Ewe| plot derived from the data of the right and left branches of
the measured CEDL-SLG-Ewe curve in Figure 2b. The curves were found to show roughly negative linear correlation. 0.0 0.2 0.4 0.6 0.8 1.0 1.2 1.4 1.6 0.000 0.001 0.002 0.003 0.004 0.005 V V
1/C
EDL 2(*10
12cm
4F
-2)
|E
we| vs Ag (V)
S8
Figure S8. Change of the motional resistance response of single layer graphene on gold
substrate in EMI-TFSI at 50 mV s-1. The change of motional resistance was only around ± 2 Ω, which had no influence to the observed mass change during polarization.
Figure S9. EQCM frequency response (Δf) of quartz substrate vs potential (a) and charge (b)
during the polarization in neat EMI-TFSI, recorded at 50 mV s-1, respectively. The Δf signal does not change significantly during polarization.
-0.5 0.0 0.5 1.0 1610 1620 1630 1640 1650 1660
Resistan
ce
(ohm)
E
WEvs Ag (V)
S9
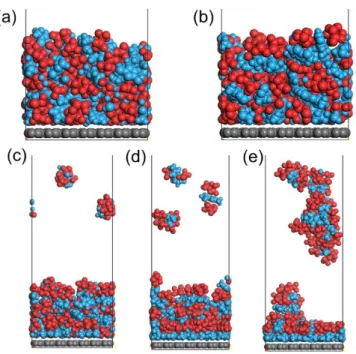
Figure S10. Geometry structures of EMI-TFSI arrangements on graphene electrode with
charge of (a) 0.00 e-/C atom, (b) 0.01 e-/C atom, (c) 0.02 e-/C atom, (d) 0.03 e-/C atom, (e) 0.04 e-/C atom after MD thermal relaxation.
Obviously, we can see that the arrangement of cations and anions on SLG surface varies with charge density ranging from 0.00 to 0.04 e-/C atom. More specifically, when the charging starts for 0.01 e-/C atom, the ions show the similar adsorption structures as that under neutral condition. When the charge density is increased to 0.03 e-/C atom (corresponding to ~0.02 mC/cm2), more EMI+ ions are found in the first ion layer contacting SLG; cations and anions are organized in a multi-layered oscillation in the compact adsorption, consistent with previous results.7,8 More importantly, parallel alignment between the EMI+ in the first contact layer and graphene surface are also found (Figure S11).In addition, the configuration shown below would narrow the averaged thickness of the double layer and increase the double layer capacitance, as supported by EIS results. From the MD simulations, we can estimate the relative mass of adsorbed ions on the electrode by calculating the mass in 1 nm thickness on SLG (corresponding to ~2-3 layers of ions). The mass obtained is 10465, 10450, 10460, 10350 or 9993 relative atomic mass for 0, 0.01, 0.02, 0.03, 0.04 e-/C atom, respectively, supporting the observation that the electrode mass has no significant change during negative charging in the current work.
S10
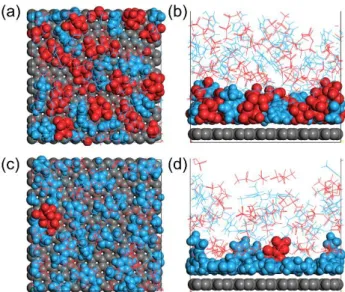
Figure S11. Geometry of first layer of EMI-TFSI ions on SLG electrode in (a) top view and (b)
side view for 0.00 e-/C atom, and (c) top view and (d) side view of 0.03 e-/C atom, respectively. Principally, the cations are attracted by the graphene surface via π-π interactions even when no potential is applied, suggestinga mixed cation/anion layering with interfacial ion-densified structure, which may be a reason for the fact that applied negative potential does not bring more ions into the compact layer, as discussed above. However, local ion-rearrangement, such as the preferred orientation of cations and the formation of multi-layered oscillation in the compact layer, were also observed, highlighting the critical role of charge-induced nanoscale correlations at SLG/RTIL interface.
S11
References
1. Kim, S.; Choi, T.; Lee, B.; Lee, S.;, Choi, K.; Park J.; Yoo, J.; Choi, Y.; Ryu, J.; Kim, P.; Hone, J.; and Hong, B. Ultraclean patterned transfer of single-layer graphene by recyclable pressure sensitive adhesive films. Nano lett. 2015, 15, 3236-3240.
2. Ye, J. L.; Tan, H. B.; Wu, S. L.; Ni, K.; Pan, F.; Liu, J.; Tao, Z. C.; Qu, Y.; Ji, H. X.; Simon, P., and Zhu, Y. W. Direct Laser Writing of Graphene Made from Chemical Vapor Deposition for Flexible, Integratable Micro‐Supercapacitors with Ultrahigh Power Output. Adv. Mater.
2018, 30, 1801384.
3. Janek, R. P.; Fawcett, W. R.; Ulman, A. Impedance spectroscopy of self-assembled monolayers on Au (111): evidence for complex double-layer structure in aqueous NaClO4 at the potential of zero charge. J. Phys. Chem. B 1997, 101, 8550-8558.
4. Randström, S.; Montanino, M.; Appetecchi, G. B.; Lagergren, C.; Moreno, A.; Passerini, S. Effect of water and oxygen traces on the cathodic stability of N-alkyl-N-methylpyrrolidinium bis (trifluoromethanesulfonyl) imide. Electrochim. Acta 2008, 53, 6397-6401.
5. He, M. L.; Fic, K.; Fra, E.; Novák, P.; Berg, E. J. Ageing phenomena in high-voltage aqueous supercapacitors investigated by in situ gas analysis. Energy Environ. Sci. 2016, 9, 623-633.
6. Prehal, C.; Koczwara, C.; Amenitsch, H.; Presser, V.; Paris, O. Salt concentration and charging velocity determine ion charge storage mechanism in nanoporous supercapacitors. Nat. Commun. 2018, 9, 4145.
7. Uysal, A.; Zhou, H.; Feng, G.; Lee, S. S.; Li, S.; Fenter, P.; Cummings, P. T.; Fulvio, P. F.; Dai, S.; McDonough, J. K.; Gogotsi, Y. Structural origins of potential dependent hysteresis at the electrified graphene/ionic liquid interface. J. Phys. Chem. C 2013, 118, 569-574. 8. Paek, E.; Pak, A. J.; Hwang, G. S. A computational study of the interfacial structure and
capacitance of graphene in [BMIM][PF6] ionic liquid. J. Electrochem. Soc. 2013, 160, A1-A10.