O
pen
A
rchive
T
OULOUSE
A
rchive
O
uverte (
OATAO
)
OATAO is an open access repository that collects the work of Toulouse researchers and
makes it freely available over the web where possible.
This is an author-deposited version published in :
http://oatao.univ-toulouse.fr/
Eprints ID : 17889
To link to this article : DOI:10.1016/j.jnoncrysol.2017.04.022
URL :
http://dx.doi.org/10.1016/j.jnoncrysol.2017.04.022
To cite this version : Dupenne, David and Roggero, Aurélien and
Dantras, Eric and Lonjon, Antoine and Pierré, Thierry and Lacabanne,
Colette Dynamic molecular mobility of polyurethane by a broad range
dielectric and mechanical analysis. (2017) Journal of Non-Crystalline
Solids, vol. 468. pp. 46-51. ISSN 0022-3093
Any correspondence concerning this service should be sent to the repository
administrator:
[email protected]
Dynamic molecular mobility of polyurethane by a broad range dielectric and
mechanical analysis
D. Dupenne
a,b, A. Roggero
b, E. Dantras
b, A. Lonjon
b,⁎, T. Pierré
a, C. Lacabanne
b aIRT A. de Saint Exupéry, 118 route de Narbonne, 31432 Toulouse Cedex 4, FrancebCIRIMAT, Université de Toulouse, CNRS, UPS, 118 route de Narbonne, 31062 Toulouse Cedex 09, France
A B S T R A C T
The dynamic molecular mobility of poly(2-hydroxypropyl methacrylate) (PHPMA) base polyurethane (PU) was studied over a broad range of frequency and temperature by combining dynamic dielectric spectroscopy and dynamic mechanical analysis. Two hydrated levels were considered in this study: dry and room humidity states. In dry state, two secondary relaxationsγ and β are identified. And in room humidity state, a βsw mode is pointed out. These modes are well known in poly(hydroxylalkyl methacrylate)s. The mainα relaxation is influenced by humidity and crosslinks. The Kramers-Kronig transform is used to reveal an ionic conductivityσionic. Relaxation
times extracted from dielectric and mechanical analyses are coherent for PU and PHPMA. This correlation allows us to propose an interpretation of relaxations at a molecular level.
1. Introduction
Poly(hydroxylalkyl methacrylate)s base polyurethane (PU) coatings are widely used in the coating industry [1,2]. The PU is classically obtained by the chemical reaction of polyol and isocyanate. A better understanding of relationships between its macromolecular dynamic and structure is necessary to improve these material properties for surface applications.
In previous works, spectroscopic studies have been devoted to the molecular mobility of poly(alkyl methacrylate)s below Tg [3–19]. Although the mechanical and dielectric behaviors of poly(2-hydro-xyethyl methacrylate) (PHEMA) has been extensively studied[20–32], there is a paucity of academic data on the poly(2-hydroxypropyl methacrylate) (PHPMA). PHEMA has a primary alcohol while PHPMA has a secondary alcohol. The reaction with isocyanate is slowed down with a secondary alcohol located on an ester side chain [33]. This increase of reaction time with PHPMA permits to have an acceptable time to apply the coating.
The aim of this work is to study the molecular dynamics of PHPMA by dielectric and mechanical relaxation spectroscopy. The effects of hydration and crosslinking of PHPMA on the relaxation modes are shown and compared with the abundant literature on the water influence on the poly(hydroxylalkyl methacrylate)s relaxations by differential scanning calorimetry[33–40], dynamic dielectric spectro-scopy[26,29,42–44]and dynamic mechanical analysis[45,46].
2. Experimental section 2.1. Materials
The PU coating is a two components system: PHPMA, MACRYNAL® VSM 6299w/42WA (Allnex, Belgium), in 40 wt% water; and Easaqua™ X D 401 (Vencorex, France) composed of hexamethylene diisocyanate, isocyanurate (45 wt%) and 3-isocyanatomethyl-3,5,5-trimethylcyclo-hexyl isocyanate (30 wt%) in 15 wt% n-butyl acetate. The two parts are mixed at room temperature (ratio 3:1). The mixture is sprayed with a High Volume Low Pressure (HVLP) spray gun. The curing process is 30 min at 80 °C. In the following sections, PU is referred to as cross-linked PHPMA with a degree of crosslinking of 75% determined by infrared transmission and PHPMA as the linear base.
3. Methods
3.1. Differential scanning calorimetry
Differential scanning calorimetry (DSC) experiments were carried out in a DSC 2920 apparatus (TA-Instrument, USA) under nitrogen gas at several heating rates from−60 to 150 °C. The samples weight varied from 5 to 10 mg and they are sealed in aluminum pans. The equivalent frequency feq , DSC [47] depends on the heating rate following the
equation:
http://dx.doi.org/10.1016/j.jnoncrysol.2017.04.022 ⁎Corresponding author.
f v πaδT
= 2
eq DSC, (1)
where v is the heating rate, a is a constant (a ~ 1), δT is the mean temperaturefluctuation.
The associated relaxation time can be determined:
τ πf = 1 2 eq DSC eq DSC , , (2)
3.2. Dynamic mechanical analysis
Dynamic mechanical analysis (DMA) was performed using an ARES G1 strain controlled rheometer (Rheometrics Scientific, USA). Experiments were carried out in rectangular torsion mode, over the temperature range from−145 to 150 °C at constant angular frequen-cies, with an heating rate of 3 °C/min. PU samples were sprayed on silicone mold with 45 mm length and 10 mm width. After the curing process, the sample thickness is approximately 500μm.
3.3. Dynamic dielectric spectroscopy
A dynamic dielectric spectrometer (DDS) BDS 4000 (Novocontrol, Germany) was used in the frequency range from 10− 2 to 10+ 6Hz
between −150 and 150 °C by 5 °C steps. The measurements were carried out in the parallel plates geometry using 35 mm aluminum circular electrodes. PU coatings were sprayed on the lower electrode. For the second run, the dielectric data werefitted with the Havriliak-Negami[48,49]parametric equation, which allowed us to extract the mean dipole relaxation timeτHN:
ε ε ε ε iωτ (ω) = + − [1 + ( ) ] s HN α β T∗ ∞ ∞HN HN (3)
whereε∞is the high-frequency limit of the relative real permittivity,εs
is the low-frequency limit of the relative real permittivity, ω is the angular frequency and αHN and βHN are the Havriliak-Negami fit
parameters, respectively related to the width and symmetry of the distribution.
Dipolar relaxations are often hidden by dissipative losses due to ohmic conduction. The Kramers-Kronig[50]relations offer an analy-tical tool to calculate εKK″ from the real permittivity εT′(ω), thus
virtually eliminating the contributions of purely dissipative phenom-ena.
∫
ε σ ε ω π ε ω ω ω dω ″ (ω) = + 2 ′ − KK 0 ω 0 0 0 ∞ ( ) 2 0 02 (4)Molecular mobility is governed by the temperature dependence of τ (T). Twologτ( )T1 behaviors are classically observed on an Arrhenius plot: a linear and a non-linear one. In the glassy state, the temperature dependence of relaxation times obeys the Arrhenius equation[5]:
⎜ ⎟ ⎛ ⎝ ⎞⎠ τ T τ H RT ( ) = 0a exp Δ (5) whereτ0ais the pre-exponential factor,ΔH is the activation enthalpy, R
is the gas constant.
For molecular mobility governed by the free volume, the tempera-ture dependency deviates from Arrhenius type behavior; it is then described by the Vogel-Fulcher-Tammann (VFT) equation[51]:
⎛ ⎝ ⎜ ⎞ ⎠ ⎟ τ T τ α T T ( ) = exp 1 ( − ) v f 0 ∞ (6)
where τ0v is the pre-exponential factor, αf is the thermal expansion
coefficient of the free volume and T∞ is the ideal glass temperature
below which there is no free volume.
4. Results and discussions 4.1. Physical structure
DSC analysis of PU was carried out with various heating rates (Fig. 1). The glass transition of PU, determined by the inflection point method (ASTM D3418), remains constant at 60 °C. An endothermic peak is pointed out: its intensity decreases and it is shifted toward higher temperatures with increasing heating rate. This endotherm is associated with the rupture of the hydrogen bonds forming a local order, as in segmented polyurethanes[52].
The extracted temperatures are reported inTable 1.
4.2. Mechanical relaxations
The storage modulus G′ and the loss modulus G″ are reported in Fig. 2for PU. In order to suppress the influence of water, the second thermograms are shown. The linear behavior of the mechanical response is checked from 1 to 100 rad/s. For the storage modulus G′, the glassy plateau is between 1 GPa at−145 °C and 0.6 GPa at 20 °C. At high temperature, the rubbery plateau is around 2 MPa. Between 30 °C and 110 °C, the modulus decrease associated with the mechanical manifestation of the glass transition, labelled α, is observed. This viscoelastic relaxation is shifted to higher temperatures with increasing angular frequencies.
At lower temperature, two secondary relaxations γ and β are observed. In order to resolve the lowest temperature mode, the angular frequency is increased toward 100 rad/s. Theγ peak location is shifted toward higher temperatures as the angular frequency increases. Theβ mode amplitude becomes less intense and tends to merge with theα mode for 50 and 100 rad/s. Tαvalues are consistent with DSC results
(Table 1). The relaxation modes temperatures as the function of the angular frequencies are reported inTable 2.
PU are sensitive to hydration, after 48 h at room humidity (RH), the
Fig. 1. DSC thermograms of PU for various heating rates (2nd heating). Lines correspond to the inflection point method.
Table 1
. Thermal parameters extracted from of DSC thermograms.
Heating rate (°C/min) Tg(°C) Tendo(°C)
3 – 58 ± 2
5 – 62 ± 2
10 58 ± 2 76 ± 2
15 60 ± 2 126 ± 3
hydration level is near 1.3 ± 0.3 wt%. Their dynamic mechanical analyses are reported inFig. 3.
At RH state, four mechanical relaxation modes are identified γ, βsw, β and α. Their specific temperatures are reported in theTable 2as a function of angular frequency. To resolve the lowest temperature mode, the angular frequency is increased toward 100 rad/s. The maximum of γ mode is visible above 50 rad/s. The associated temperatures Tγare the
same for the two hydrated states (dry and RH), suggesting that theγ mode is not influenced by the presence of humidity.
In the temperature range of−100 to −75 °C, a new mode, called βsw, is observed. The index “sw” is defined as “swelling”. The molecular origin of this mode is explained later in this article. Theβ mode is hidden by the βsw mode and the low temperature tail of α mode. Compared to the dry state, the viscoelastic relaxation mode is
shifted toward low temperatures; i.e. characteristic of a plasticization phenomenon.
Fig. 4compares the dissipative modulus G″ for PU at 100 rad/s for dry and RH states.γ mode strength decreases strongly in the RH state, contrary toβsw mode. The presence of humidity changes the amplitude ofγ mode, but its temperature is unchanged.
4.3. Dielectric relaxations
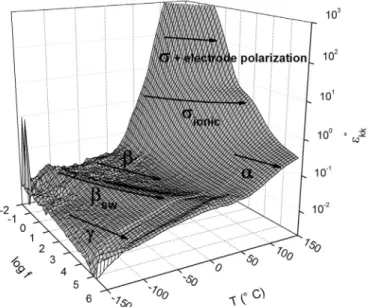
Fig. 5reports the dielectric loss surface of PU at RH state. Dielectric relaxation modes are consistent with mechanical results. In addition an ionic conductivity σionic is observed at high temperatures and low
frequencies. This dielectric contribution appears in the high frequency tail of the conductivityσ. This phenomenon has been associated with ions accumulation at electrode-sample interfaces, leading to a so-called “electrode polarization” effect[53]superimposed to the high-tempera-ture conductivity inFig. 5.
The dynamic conductivity σ′ and permittivity ε′ at 150 °C are reported in Fig. 6. For high frequency range, the conductivity is frequency dependent. It corresponds to ion mobility at short times [54,55]. At lower frequency, a nearly constant (σdc) plateau, associated
with random ions hopping mobility, is observed. With decreasing frequency, the accumulation of ions near the electrodes leads to a
Fig. 2. Storage modulus G′ and loss modulus G″ versus temperature for dry PU. Table 2
Mechanical relaxation modes temperatures for PU at dry and room humidity state.
Mode T1 rad/sAMD(°C) T6.3 rad/sAMD(°C) T50 rad/sAMD(°C) T100 rad/sAMD(°C)
State Dry γ – – −140 ± 2 −135 ± 2 β −30 ± 2 −25 ± 2 – – α 50 ± 2 55 ± 2 60 ± 2 61 ± 2 State RH γ – – −140 ± 2 −135 ± 2 βsw −98 ± 2 −89 ± 2 −78 ± 2 −75 ± 2 β – – – – α 47 ± 2 52 ± 2 50 ± 2 52 ± 2
Fig. 3. Storage modulus G′ and loss modulus G″ versus temperature for PU at RH state.
Fig. 4. Modulus loss G″ at 100 rad/s versus temperature for PU in dry and RH states.
decrease in the mobile ions density within the sample (σ′ decreases). And additional polarization of the sample is induced by the ions stacked near the electrodes, resulting in an increase ofε′[53]. The inset inFig. 6 shows that ionic conductivity is governed by an Arrhenius behavior with an activation energy greater than 100 kJ/mol. It confirms an ionic charge transport.
Fig. 7 shows the relaxation times behaviors on an Arrhenius diagram for PU in the dry and RH states. DDS and DMA relaxation times are reported. The temperature dependence of the γ, βsw, β, α relaxations andσionicare shown. Secondary relaxations andσionicfollow
the Arrhenius behavior law described by Eq. (5). The extracted parameters are indexed inTable 3.
For theγ mode, we observe a discrepancy between dielectric and mechanical relaxation times at low temperature. It has been already reported in the literature[20,22,32,56]. The dielectric response under electricfield is strongly dependent on the dipole moment, whereas the mechanical relaxation is directly linked with molecular mobility and Van der Waals binding forces. Aligning the dipole moment of eOH group in the electricfield is easier than overcoming the Van der Waals interactions.
At RH conditions, theβ mode cannot be fitted due to βsw relaxation. Mechanical and dielectric relaxation times are in agreement for βsw andβ modes, contrary to Gates et al.[22]results. They observe aβsw
peak slightly lower for dielectric measurements. Theγ relaxation and σionicdielectric contributions are not influenced by hydration. α mode is
governed by a VFT behavior. A plasticization phenomenon due to water molecules is observed. VFTfit parameters are reported inTable 4. The ideal glass temperature T∞is located at 56 °C below the calorimetric Tg
in the dry state.
Eq.(2)allows us to calculate the equivalent relaxation timeτeq , DSC,
approximately 30 s, for a heating rate of 20 °C/min and reported in Fig. 7. The calorimetric Tg is consistent with the mechanical and dielectric measurements.
In order to shed some light on the molecular origin of these relaxation dynamics and to study the effect of crosslinking, the dielectric permittivity of PHPMA in the dry and RH states was studied. Due to the weak mechanical properties of PHPMA, DMA analyses could not performed.
InFig. 8, relaxation times temperature dependence of PHPMA are reported on an Arrhenius diagram. In the glassy state, the secondary relaxations are governed by the Arrhenius law and thefitted parameters are reported inTable 5. Theseγ, βsw, β modes of PHPMA are consistent with those observed in PU.
Theγ relaxation process is associated with the rotation of the eOH side groups as in PHEMA[32]. In the PU, all theeOH functions do not react with theeNCO functions to form the PU function. The γ mode remains relatively constant with water molecule presence, as a
con-Fig. 6. Real part of the conductivityσ′ and permittivity ε′ versus frequency for PU at 150 °C. Inset: Arrhenius diagram of logσDC.
Fig. 7. Arrhenius diagram of dielectric and mechanical relaxations times of PU at dry and RH states. Lines correspond to VFTfit.
Table 3
Arrheniusfit parameters for secondary relaxations and σionicin PU at dry and RH states.
State Dry RH
Mode τ0(s) Ea(kJ/mol) τ0(s) Ea(kJ/mol) γ 5.10− 15 34 ± 1 1.10− 14 32 ± 1
βsw – – 5.10− 16 54 ± 1
β 6.10− 26 123 ± 2 – –
σionic 4.10− 21 136 ± 3 4.10− 21 136 ± 2
Table 4
VFTfit parameters of α relaxation in PU at dry and RH states.
Mode State τ0(s) T∞(°C) αf(°C− 1)
α Dry 2.10− 10 2 ± 1 8.10− 4
RH 3.10− 9 1 ± 1 1.10− 3
Fig. 8. Arrhenius diagram of relaxation times of PHPMA at dry and RH states. Lines correspond to VFTfit.
firmation of Janacek [20] interpretation on PHEMA swollen (with different concentrations of water or other polar solvents) by mechanical experiments. Janacek et al. show that itsγ mode gradually disappears with increasing diluent concentration but its temperature location is constant. Gates et al.[22]mention that the activation energy of theγ mode is constant for cross-linked HEMA, DHPMA and their copolymers, and not dependent from hydration. But Lustig et al.[57]observed for PHEMA a slight decrease toward lower temperatures with water content, while Shen et al. [58] for PHEMA and PHPMA noted the opposite. In this work, the activation energy value for theγ relaxation is about 34 kJ/mol. This result is in agreement with the ones previously established for polyacrylic systems with hydroxyl groups as PHEMA [22,32,59,60]or PHEA[61].
In RH state, theβsw mode is also observed. Literature reports that it is shifted toward lower temperatures as water content increases for the PHEMA [62]and for the PHEA[19]. This mode has been associated with water molecules in interaction with hydroxypropyl group on the polymer side chain[20]; i.e. a complexeOH side groups/water. A part ofeOH side groups involve in the γ process is transformed into the βsw process. The activation energy is 52 kJ/mol which is consistent with the values from literature[60,61].
As already observed in DMA, theβ mode is hidden by the βsw relaxation. Only a few points can befitted with the HN function in the RH state. The secondary modeβ corresponds to the rotation of the ester side group[20]. The activation energies in the dry and hydrated state are close. In the literature, the temperature of the β mode slightly decreases with water content [57,58]. The activation energy values obtained for the β mode are similar to those reported for PHEMA [59,24].
At higher temperatures, theσionicobeys an Arrhenius behavior and
is not influenced by hydration. The activation energy of the secondary modes between PHPMA and PU are close. There is no influence on these modes when PHPMA is crosslinked. Only, the ionic conductivityσionicis
modified. The activation energy is higher in the PHPMA.
A VFT behavior is observed for the PHPMAα mode. The VFT fit parameters are reported inTable 6. The ideal glass transition tempera-ture T∞, located in the vicinity of −20 °C, is 45 °C below the
calorimetric Tg in the dry state (Tg(PHPMA) = 25°C). In the same way
as PU, the point (Tg(PHPMA) ,τeq , DSC) has been reported inFig. 8, and is
in good agreement with VFTfit. The α relaxation for the PU is shifted to higher temperatures as compared to the PHPMA by crosslinking limit-ing the degrees of freedom of the main chain segments involved in the glass transition.
5. Conclusions
Mechanical and dielectric relaxations have been applied to thor-ough investigation of the dynamic molecular mobility of PHPMA and PU in dry and RH states. The combination of DMA and DDS has brought to light the correlation between the response of this mobility under mechanical and electricfield.
At low temperature in the dry state, two secondary relaxation modes γ and β were identified in PHPMA and PU. The molecular origin of the γ mode is the rotation of theeOH side group in PHPMA. The β secondary relaxation mode is attributed to the rotation of the ester side group. Their relaxation times are not modified by humidity and crosslinking. For RH conditions, the βsw mode has been observed and associated with water molecules in interaction witheOH. This mode isn't modified by crosslinking. At high temperature in the dry state, theα relaxation of PHPMA is shifted to higher temperatures in PU due to crosslinking.
Once hydrated, a plasticization phenomenon appears for PHPMA and PU. In dielectric analysis, an ionic conductivityσionicis associated
with ions accumulation at electrodes. This phenomenon is not in flu-enced by humidity but by crosslinking. Finally, the good consistency between DMA and DDS results allows us to significantly improve the knowledge of molecular/dynamic structure relationships of PHPMA base PU coating.
Acknowledgments
These results were obtained under the research project “SURFINNOV” at the IRT Saint Exupéry. We thank the industrial and academic members of the IRT who supported this project through their contributions, bothfinancial and in terms of specific knowledge:
– Industrial members: Airbus Defence & Space, Airbus Group Innovation, Airbus Helicopter, Airbus Operation, Akzo, GIT, Liebherr, Mapaero, Mecaprotec, Prodem, Socomore, Stelia Aerospace, Thales Alenia Space
– Academic members: CIRIMAT, Laplace, UPS and CNRS.
We also thank the“Commissariat Général aux Investissements” and the“Agence Nationale de la Recherche” for their financial support in the“Programme d'Investissement d'Avenir” (PIA).
References
[1] P.S. Suchithra, V.K. Abitha, D. Patil, A.V. Rane, Effect of hydroxyl value of acrylic polyol and type of crosslinkers on the properties of polyurethane coatings, Moroccan J. Chem. 3 (2015) 476–483.
[2] D.J. Mills, S.S. Jamali, K. Paprocka, Investigation into the effect of nano-silica on the protective properties of polyurethane coatings, Surf. Coat. Technol. 209 (2012) 137–142.
[3] F. Garwe, A. Schönhals, H. Lockwenz, M. Beiner, K. Schröter, E. Donth, Influence of cooperativeα dynamics on local β relaxation during the development of the dynamic glass transition in poly(n-alkyl methacrylate)s, Macromolecules 29 (1996) 247–253.
[4] M.A. Desando, M.A. Kashem, M.A. Siddiqui, S. Walker, Dielectric studies of theβ1 andβ2 processes of poly(alkyl methacrylate) polymers, J. Chem. Soc., Faraday Trans. 2 80 (1984) 747–762.
[5] N.G. McCrum, B.E. Read, G. Williams, Anelastic and Dielectric Effects in Polymeric Solids, John Wiley, 1967.
[6] J. Janacek, J. Kolarik, Relaxation behavior of poly(methacrylic acid) esters swollen by low molecular weight substances at temperatures below the glass transition point, J. Polym. Sci. C 16 (1967) 279–291.
[7] F. Lednicky, J. Janacek, Relaxation behavior of the ester groups (β dispersion) in some swollen polymethacrylates, J. Macromol. Sci. Part B. 5 (1971) 335–354. [8] T.W. Wilson, D.T. Turner, Vitrification of water in a hydrogel, Macromolecules 21
(1988) 1184–1186.
[9] K. Mpoukouvalas, G. Floudas, G. Williams, Origin of theα, β, (βα), and “Slow” dielectric processes in poly(ethyl methacrylate), Macromolecules 42 (2009) 4690–4700.
[10] H. Sasabe, S. Saito, Dielectric relaxations and electrical conductivities of poly(alkyl methacrylates) under high pressure, J. Polym. Sci. Part A-2 (6) (1968) 1401–1418. [11] K. Schröter, R. Unger, S. Reissig, F. Garwe, S. Kahle, M. Beiner, E. Donth, Dielectric spectroscopy in theαβ splitting region of glass transition in poly(ethyl
methacry-Table 5
Arrheniusfit parameters for the secondary relaxations and σionicin PHPMA at dry and RH states.
State Dry RH
Mode τ0(s) Ea(kJ/mol) τ0(s) Ea(kJ/mol) γ 7.10− 15 34 ± 1 2.10− 15 35 ± 1
βsw – – 1.10− 15 52 ± 1
β 9.10− 27 127 ± 2 1.10− 27 131 ± 2 σionic 1.10− 30 187 ± 2 1.10− 30 188 ± 2
Table 6
VFTfit parameters of the α relaxation in PHPMA at dry and RH states.
Mode State τ0(s) T∞(°C) αf(°C− 1) α Dry 1.10− 10 −20 ± 2 8.5.10− 4 RH 8.10− 10 −22 ± 1 1.10− 3
late) and poly(n-butyl methacrylate): different evaluation methods and experi-mental conditions, Macrolecules. 31 (1998) 8966–8972.
[12] G. Floudas, Structure and dynamics of poly(n-decyl methacrylate) below and above the glass transition, Macromolecules 31 (1998) 6951–6957.
[13] M. Beiner, K. Schröter, E. Hempel, S. Reissig, E. Donth, Multiple glass transition and nanophase separation in poly(n-alkyl methacrylate) homopolymers,
Macromolecules 32 (1999) 6278–6282.
[14] E. Dudognon, A. Berne, C. Lacabanne, Study by thermostimulated currents of dielectric relaxations through the glass transition in an amorphous polymer: poly(n-butyl methacrylate), Macromolecules 34 (2001) 3988–3992.
[15] E. Dudognon, A. Berne, C. Lacabanne, Low-frequency chain dynamics of poly(n-hexyl methacrylate) by dielectric spectroscopies, Macromolecules 35 (2002) 5927–5931.
[16] E. Dudognon, A. Bernès, C. Lacabanne, Nature of molecular mobility through the glass transition in poly(n-alkyl methacrylates): a study by dielectric spectroscopies, J. Macromol. Sci. Part B. 43 (2004) 591–604.
[17] C. Menissez, B. Sixou, L. David, G. Vigier, Dielectric and mechanical relaxation behavior in poly(butyl methacrylate) isomers, J. Non-Cryst. Solids 351 (2005) 595–603.
[18] A. Kyritsis, P. Pissis, J.L. Gomez Ribelles, M. Pradas, Dielectric relaxation spectro-scopy in PHEA hydrogels, J. Non-Cryst. Solids 172–174 (1994) 1041–1046. [19] A. Kyritsis, P. Pissis, J. Ribelles, M. Pradas, Polymer-water interactions in poly
(hydroxyethyl acrylate) hydrogels studied by dielectric, calorimetric and sorption isotherm measurements, Polym. Gels Networks 3 (1995) 445–469.
[20] J. Janacek, Mechanical behavior of hydroxyalkyl methacrylate polymers and copolymers, J. Macromol. Sci. Part C Polym. Rev. 9 (1973) 3–47.
[21] J. Kolarik, Secondary relaxations in glassy polymers: hydrophilic polymethacrylates and polyacrylates, J. Adv. Polym. Sci. 46 (1982) 119–161.
[22] G. Gates, J. Harmon, J. Ors, P. Benz, Intra and intermolecular relaxations 2,3-dihydroxypropyl methacrylate and 2-hydroxyethyl methacrylate hydrogels, Polymer (Guildf). 44 (2003) 207–214.
[23] R. Diaz Calleja, Dielectricγ relaxation in poly (2-hydroxyethyl methacrylate), J. Polym. Sci. Part B Polym. Phys. 17 (1979) 1395–1401.
[24] J.L. Gomez Ribelles, R. Diaz Calleja, Theβ dielectric relaxation in some metha-crylate polymers, J. Polym. Sci. Part B Polym. Phys. 23 (1985) 1297–1307. [25] G.A. Russell, P. Hiltner, D. Gregonis, A. DeVisser, J. Andrade, Thermal and dynamic
mechanical relaxation behavior of stereoregular poly(2-hydroxyethyl methacry-late), J. Polym. Sci. B Polym. Phys. 18 (1980) 1271–1283.
[26] K. Pathmanathan, G.P. Johari, Dielectric and conductivity relaxations in poly (hema) and of water in its hydrogel, J. Polym. Sci. Part B Polym. Phys. 28 (1990) 675–689.
[27] G.P. Johari, Dielectric behaviour of H-bonded liquids and amorphous and crystal-line solids, J. Mol. Struct. 250 (1991) 351–384.
[28] A. Kyritsis, P. Pissis, J.L.G. Ribelles, M.M. Pradas, Depolarization thermocurrent studies in poly(hydroxyethyl acrylate)/water hydrogels, J. Polym. Sci. Part B Polym. Phys. 32 (1994) 1001–1008.
[29] K. Pathmanathan, G.P. Johari, Relaxation and crystallization of water in a hydrogel, J. Chem. Soc. Faraday Trans. 90 (1994) 1143–1148.
[30] N. Araujo, D. Gomes, J.L.G. Ribelles, M.M. Pradas, J.F. Mano, Dynamic-mechanical behavior of hydrophobic–hydrophilic interpenetrating copolymer networks, Polym. Eng. Sci. 46 (2006) 930–937.
[31] M. Salmeron Sanchez, R. Brıigido Diego, S.A.M. Iannazzo, J.L. Gomez Ribelles, M. Pradas, The structure of poly(ethyl acrylate-co-hydroxyethyl methacrylate) copolymer networks by segmental dynamics studies based on structural relaxation experiments, Polymer (Guildf). 45 (2004) 2349–2355.
[32] K. Mohomed, T.G. Gerasimov, F. Moussy, J.P. Harmon, A broad spectrum analysis of the dielectric properties of poly(2-hydroxyethyl methacrylate), Polymer (Guildf). 46 (2005) 3847–3855.
[33] Z.W. Wicks, D.A. Wicks, J.W. Rosthauser, Two package waterborne urethane systems, Prog. Org. Coat. 44 (2002) 161–183.
[34] P.H. Corkhill, A.M. Jolly, C.O. Ng, B.J. Tighe, Synthetic hydrogels: 1. Hydroxyalkyl acrylate and methacrylate copolymers - water binding studies, Polymer (Guildf). 28 (1987) 1758–1766.
[35] K. Hofer, E. Mayer, Glass-liquid transition of water and ethylene glycol solution in poly(2-hydroxyethyl methacrylate) hydrogel, J. Phys. Chem. 94 (1990) 2689–2696. [36] B. Ramaraj, G. Radhakrishnan, Modification of the dynamic swelling behaviour of poly(2-hydroxyethyl methacrylate) hydrogels in water through interpenetrating
polymer networks (IPNs), Polymer (Guildf). 35 (1994) 2167–2173.
[37] M.B. Ahmad, M.B. Huglin, States of water in poly(methyl methacrylate-co-N-vinyl-2-pyrrolidone) hydrogels during swelling, Polymer (Guildf). 35 (1997) 1997–2000. [38] G. Smyth, F.X. Quinn, V.J. McBrierty, Water in hydrogels. 2. A study of water in
poly(hydroxyethyl methacrylate), Macromolecules 21 (1988) 3198–3204. [39] J. Rault, A. Lucas, R. Neffati, M. Monleo, Thermal transitions in hydrogels of poly
(ethyl acrylate)/poly(hydroxyethyl acrylate) interpenetrating networks, Macromolecules 30 (1997) 7866–7873.
[40] F.X. Quinn, E. Kampff, G. Smyth, V.J. Mcbrierty, Water in hydrogels. 1. A study of
water in poly(N-vinyl-2-pyrrolidone/methyl methacrylate) copolymer, Macromolecules 21 (1988) 3191–3198.
[42] J.L. Gomez Ribelles, J.M. Meseguer Duenas, M. Pradas, Dielectric relaxations in poly(hydroxyethyl acrylate): influence of the absorbed water, Polymer (Guildf). 29 (1988) 1124–1127.
[43] M.B.I.N. Ahmad, J.P.O. Mahony, M. Huglin, T.P. Davis, A.C. Rlcclardone, Application of dielectric spectroscopy and DSC to the study of relaxations in some copolymeric hydrogels, J. Appl. Polym. Sci. 56 (1995) 397–404.
[44] H. Xu, J.K. Vij, V.J. McBrierty, Wide-band dielectric spectroscopy of hydrated poly (hydroxyethyl methacrylate), Polymer (Guildf). 35 (1994) 227–234.
[45] L.M. Muratore, K. Steinhoff, T.P. Davis, Self-reinforcing hydrogels comprised of hydrophobic methyl methacrylate macromers copolymerised with either N-vinyl-2-pyrrolidone or 2-hydroxyethyl acrylate, J. Mater. Chem. 9 (1999) 1687–1691. [46] G. Di Marco, M. Lanza, M. Pieruccini, Dynamical mechanical measurements in dry
PHEMA and its hydrogels, Nuovo Cim. 16 (1994) 849–854.
[47] A. Hensel, J. Dobbertin, J.E.K. Schawe, A. Boller, C. Schick, Temperature modulated calorimetry and dielectric spectroscopy in the glass transition region of polymers, J. Therm. Anal. 46 (1996) 935–954.
[48] S. Havriliak, S. Negami, A complex plane analysis ofα-dispersions in some polymer systems, J. Polym. Sci. Part C. 14 (1966) 99–117.
[49] S. Havriliak, S. Negami, A complex plane representation of dielectric and mechanical relaxation processes in some polymers, Polymer (Guildf). 8 (1967) 161–210.
[50] P. Steeman, J. Van Turnhout, A numerical Kramers-Kronig transform for the calculation of dielectric relaxation losses free from Ohmic conduction losses, Colloid Polym. Sci. 275 (1997) 106–115.
[51] F. Kremer, A. Schönhals, Broadband Dielectric Spectroscopy, Sp, Berlin, 2003. [52] T.R. Hesketh, J.W.C.V.A.N. Bogart, S.L. Cooper, Differential scanning calorimetry
analysis of morphological changes in segmented elastomers, Polym. Eng. Sci. 20 (1980) 190–197.
[53] D.L. Sidebottom, B. Roling, K. Funke, Ionic conduction in solids: comparing conductivity and modulus representations with regard to scaling properties, Phys. Rev. B 63 (2000) 024301.
[54] J.C. Dyre, The random free energy barrier model for ac conduction in disordered solids, J. Appl. Phys. 64 (1988) 2456–2468.
[55] A.K. Jonscher, Dielectric relaxation in solids, J. Phys. D. Appl. Phys. 32 (1999) 57–70.
[56] G. Hartwig, Polymer Properties at Room and Cryogenic Temperatures, Springer US, Boston, MA, 1994.
[57] S. Lustig, J. Caruthers, N. Peppas, Dynamic mechanical properties of polymer-fluid systems: characterization of poly hydroxyethyl methacrylate) and poly (2-hydroxyethyl methacrylate-co-methyl), Polymer (Guildf). 32 (1991) 3340–3353. [58] M.C. Shen, J.D. Strong, Low-temperature internal-friction study of diluent effect in
some polymethacrylates, J. Appl. Phys. 38 (1967) 4197–4202.
[59] K. Mohomed, F. Moussy, J.P. Harmon, Dielectric analyses of a series of poly(2-hydroxyethyl methacrylate-co-2,3-dihydroxypropyl methacylate) copolymers, Polymer (Guildf). 47 (2006) 3856–3865.
[60] L.V. Karabanova, G. Boiteux, G. Seytre, I. Stevenson, O. Gain, C. Hakme, E.D. Lutsyk, A. Svyatyna, Semi-interpenetrating polymer networks based on polyurethane and poly(2-hydroxyethyl methacrylate): dielectric study of relaxation behavior, J. Non-Cryst. Solids 355 (2009) 1453–1460.
[61] R. Sabater I Serra, J.L. Escobar Ivirico, J.M. Meseguer Duenas, A. Andrio Balado, J.L. Gomez Ribelles, M. Salmeron Sanchez, Dielectric relaxation spectrum of poly (ε-caprolactone) networks hydrophilized by copolymerization with 2-hydroxyethyl acrylate, Eur. Phys. J. E Soft Matter 22 (2007) 293–302.
[62] J. Kolarik, J. Janacek, Dynamic mechanical behavior of poly(2-hydroxyethyl methacrylate)-glass beads composites, J. Appl. Polym. Sci. 20 (1976) 841–851.