OATAO is an open access repository that collects the work of Toulouse
researchers and makes it freely available over the web where possible
Any correspondence concerning this service should be sent
to the repository administrator:
[email protected]
This is an author’s version published in:
http://oatao.univ-toulouse.fr/27255
To cite this version:
Costa do Nascimento, Débora and Dorighello Carareto, Natália Daniele and
Marinho Barbosa Neto, Antonio and Gerbaud, Vincent
and da Costa,
Mariana Conceição Flash point prediction with UNIFAC type models of ethylic
biodiesel and binary/ternary mixtures of FAEEs. (2020) Fuel, 281. 118717.
ISSN 0016-2361
Flash point prediction with UNIFAC type models of ethylic biodiesel and
binary/ternary mixtures of FAEEs
Débora Costa do Nascimento
a, Natália Daniele Dorighello Carareto
b,
Antonio Marinho Barbosa Neto
c, Vincent Gerbaud
d, Mariana Conceição da Costa
a,⁎a School of Chemical Engineering (FEQ), University of Campinas (UNICAMP), 13083-852, Campinas, Sao Paulo, Brazil
b Laboratoire des Matériaux Céramiques et Procédés Associés (LMCPA), Université de Valenciennes et du Hainaut‐Cambrésis, Valenciennes, France c ThermoPhase, Department of Petroleum Engineering, Santa Catarina State University, 88336-275, Balneário Camboriú, Santa Catarina, Brazil d Laboratoire de Génie Chimique, Université de Toulouse, CNRS – INP – UPS, Toulouse, France
A R T I C L E I N F O Keywords: Flash point Ethyl esters Biodiesel UNIFAC A B S T R A C T
In order to guarantee safe handling of a combustible liquid, such as biodiesel, it is important to be aware of its Flash Point (FP). Thus, the present study focused on FP experimental measurement and thermodynamic cor-relation of binary and ternary mixtures of saturated or unsaturated fatty acid ethyl esters (FAEEs) as surrogates for biodiesel. FP of different types of ethylic biodiesel in terms of feedstock (canola, corn, cotton and soy oils) were also measured and compared with the predicted values. Experiments were carried out in agreement with the standard closed cup procedure ASTM D6450. Liaw’s model was applied to FP prediction, with liquid phase non-ideality description accounted for by UNIFAC group contribution models (Original UNIFAC, UNIFAC-Dortmund and UNIFAC-Bessa with revised parameters for fats). FP prediction accounting for non-ideality proved to be accurate, with some difference between the UNIFAC type models and Root Mean Square Deviations (RMSD) varying from 0.27 K to 3.95 K for binary and ternary mixtures.
1. Introduction
Safe transportation and stocking of a flammable or combustible substance/solution frequently requires the knowledge of its Flash Point (FP). FP of a liquid substance, or a mixture of substances, is defined as the lowest temperature at which such substances release vapor enough to produce a combustible mixture with air[1].
Since FP data is a crucial parameter to storage, handling and transportation of flammable materials, a series of studies on predicting the FP of pure substances and mixtures can be found in the literature [2–11]. FP has a strong importance related to legal requirements and safety; thus, FP is normally specified to meet insurance and fire reg-ulations. In order to be in accordance with American Society of Testing and Materials guidelines, diesel and biodiesel, for example, must have a minimum FP of 311 K[12]and 360 K[13], respectively.
Biodiesel is defined as the product of a transesterification reaction between a fat source, vegetable oils or animal fats for instance, and a short chain alcohol, frequently methanol or ethanol[14]. Usually, the reaction occurs in the presence of a catalyst, as sodium hydroxide, at elevated temperatures[15]. When ethanol is used for the reaction, the resulting ethylic biodiesel is composed by Fatty Acid Ethyl Esters
(FAEE), saturated and/or unsaturated. Today, biodiesel is seen as a real alternative substitute to conventional petroleum diesel because it pre-sents some advantages since it is biodegradable and non-toxic; it also has low carbon content, high lubricity and higher FP compared to diesel [14].
The alkyl ester composition of biodiesel is strictly associated to the feedstock from which it is produced. So the physicochemical properties, including the FP, of biodiesel can have substantial variations depending on the raw material used in its production[16]. Typically, biodiesel produced from coconut oil, which is rich in lauric acid[17], exhibits a FP different from biodiesel produced from palm oil, rich in oleic and palmitic acid[15,16].
Besides FP, there are other properties involved in a complete flammability characterization of biodiesel, such as the vapor pressure, the boiling point, lower and upper flammability limits and the lower heating value[18]. Additionally, not only biodiesel handling itself de-mands fire hazard evaluation, but the whole biodiesel processing cycle presents flammability concerns, as it involves flammable short chain alcohols, as methanol and ethanol, and dangerous catalysts[18]. In fact, the accident rate in biodiesel production has increased in recent years due to lack of operational experience and standardized
https://doi.org/10.1016/j.fuel.2020.118717
⁎Corresponding author.
purification. Unsaturated FAEEs with Technical Grade Purity were also obtained from Sigma-Aldrich. Dodecane (Sigma-Aldrich, purity of 0.99 w/w), which is a FP certified reference material, was used to verify the calibration of the FP tester. Canola, cotton, soy and corn Biodiesel samples were produced by a transesterification reaction using ethanol and sodium ethoxide as a catalyst in the lab. The compositions of these four biodiesel samples were characterized through Gas Chromato-graphy.
Binary and ternary sample mixtures of FAEEs were prepared on an analytical scale (Adam AAA/L) with a ± 0.2 mg accuracy by weighting previously known amounts of each FAEE to cover the entire range of molar fraction obtaining a total sample mass of approximately 4 g. 2.2. Flash point measurements
A Miniflash FLPH Touch® from Grabner Instruments (Austria) was used to perform the FP measurements in accordance with ASTM D6450 standard test method[35]with the set of selected parameters: start of test, 18 K before the expected FP; end of test, 10 K after the expected FP; test interval of 1 K; heating rate of 5.5 K/min; and pressure threshold for the flash detection of 20 kPa. The values are discussed inSection 3.1.
The ASTM D6450 FP detection method consists in measuring the instantaneous pressure increase inside the closed chamber triggered by an energy-controlled electric arc. The ambient pressure was checked every day in order to correct the measured flash point to a pressure of 101.3 kPa. A test specimen of 1 mL was used in each measurement, as recommended by the standard method, and its homogeneity was en-sured by a magnetic stirrer. Moreover, the flash point tester perfor-mance was evaluated every day with dodecane (FP = 352.2 ± 2.1 K). All the analysis were performed in triplicate, always using a fresh test specimen, and the average FP value was calculated.
2.3. Flash point model
A Vapor Pressure based mathematical approach can be used to de-scribe the flash point of miscible mixtures[1,43]. One can find an ex-tensive discussion on this approach on the literature [1,11,16,28,43,44]. The equation that describes FP for multi compo-nent mixtures is equal to
= = 1 x P P i 1 n i i isat i,FP sat (1) where n represents the total of flammable substances in the mixture, xi
is the molar fraction of i in the liquid phase, iis liquid phase activity coefficient of i,Pisatis the vapor pressure of pure component i in Pa at the FP temperature of the mixture and,Pi,FPsat is the vapor pressure of pure component i in Pa at its FP temperature. In this equation, the vapor pressures and activity coefficients of each pure component are a function of the FP temperature of the mixture.
We used three variants of the UNIFAC model to calculate the ac-tivity coefficients of the mixtures needed in Eq.(1): UNIFAC original [40], UNIFAC-Dortmund[35,36,41]and a readjusted UNIFAC for bio-diesel mixtures [34] – here named UNIFAC-Bessa. While Dortmund considers a temperature dependency of interaction parameters, Bessa suggests a specific set of parameters regressed from fats equilibrium data.
In order to evaluate the dependence of Eq.(1)on the vapor pres-sure, saturated FAEE vapor pressures were calculated by two different methods:
•
Method 1: the FAEE vapor pressure is computed by using the group contribution model proposed by Ceriani et al.[45].•
Method 2: the FAEE vapor pressure is computed from Antoine’s equation.operational procedures, being fire the most frequent scenario in acci-dents, incidents and mishaps in the industry [19,20]. Additionally, biodiesel is more sensitive to oxidative degradation than conventional diesel due to high oxygen content and presence of double bonds [21]. Moreover, biodiesel oxidation caused by ageing and poor storage might lead to peroxide formation, which makes it more unstable over time [21–23].
Still, there are few works on the literature concerning biodiesel fire hazard through FP evaluation [5,6,24–29]. Despite the need for in-formation on flammability c haracterization o f b iodiesel a nd i ts pro-duction process, the correlation between biodiesel’s FP, its composition and its solution behavior through Excess Gibbs Energy in terms of ac-tivity coefficient evaluation is rarely studied.
Vapor pressure type models, which combine Le Chatelier’s rule to Vapor Liquid Equilibrium (VLE) thermodynamics are known for being able to correlate composition of a given liquid to its FP. These types of models are highly dependent on how the vapor pressure of each com-ponent is represented and how the non-ideality of the liquid phase is described. In other words, these models depend on the correlation be-tween vapor pressure and temperature, and the activity coefficient model chosen to characterize the liquid phase non-ideal behavior [30]. One may choose one model from a series of available Gibbs Excess Energy models in order to calculate the activity coefficient of each chemical species involved in a mixture. While dealing with ethylic biodiesel, a mixture of FAEEs, predictive models based on group con-tributions may be the convenient choice to describe the solution’s be-havior, but these approaches must be validated first.
Predictive models such as UNIFAC type models have the potential to describe non ideal behavior of liquid solutions for non-electrolytic systems [31,32]. The main advantage of UNIFAC is its wide range of application [33]. Effort has been made to improve the prediction per-formance of the UNIFAC method [34–37]. Even though other methods (Margules equations, van Laar equation, and NRTL method, among others) exist, they require parameter fitting f or e ach s ystem under study. Instead, the UNIFAC method can be used in a fully predictive manner. Regarding FP predictions, UNIFAC has been extensively used to predict non-ideal solution behavior responsible for the occurrence of minimum or maximum FP behavior in miscible mixtures [38] and partially miscible mixtures [3,39].
With this in mind, the aim of this study is to verify whether and to what extent three UNIFAC type models, namely Original UNIFAC [40], UNIFAC-Dortmund [35,36,41] and UNIFAC-Bessa [34], are capable of describing possible liquid phase non idealities of systems containing FAEEs (saturated and unsaturated), including real biodiesel, in an at-tempt to accurately predict FP of these systems through a FP mixing rule. Therefore, we wished to verify whether the use of UNIFAC activity coefficient models contribute to the improvement of FP prediction of these systems in comparison to the ideal model. To do so, we char-acterized the flammability of pure FAEEs, as well as 20 binary and 2 ternary mixtures containing FAEEs (saturated or unsaturated) through the measurement of their FP temperatures in a closed cup apparatus according to ASTM D6450 standard procedure. We also measured the FP of four ethylic biodiesels from different feedstocks (Cotton, Canola, Soy and Corn oils). Then, predicted FP values were compared to ex-perimental data by means of RMSD calculation. Furthermore, as FP prediction through Le Chatelier’s rule depends not only on the activity coefficient bu t al so on th e Va por Pr essure of ea ch co mponent, we checked whether the choice of vapor pressure model between a group contribution model and Antoine’s equation affects FP prediction. 2. Methods and tools
2.1. Material
Saturated FAEEs (Table 1) with a high grade of purity were obtained from Sigma-Aldrich, being used as received, i.e. with no further
Table 1
Flash point of the pure FAEE used in this work.
FAEE (CAS number) Purlty" (w/w) Flash point (1() catolre
modeJb ASTM 06450< ASTM 093c" t.FP
Ethyl Octanoate (106-32-1) 0.997 353.2 354.0 ± 0.1 Ethyl Decanoate (11�38-3) 0.996 378.7 379.5 ± 0.6 Ethyl Laurate (106-33-2) 0.997 400.6 402.3 ± 0.6 Ethyl Myrlstate (124--06-1) 0.991 425.3 423.6 ± 0.6 Ethyl Pentadecanoate (41114--00-5) 0.983 432.0 ± 1.0 Ethyl Palmitate (628-97-7) 0.995 442.5 443.2 ± 0.6 Ethyl Stearate (111-61-5) 0.992 457.2 458.3 ± 0.6 Ethyl Oleate (111-62-6) Technlcal Grade 458.0 453.1 ± 0.6
0.980 457.7 ± 0.6 Ethyl Llnoleate (544-35-4) Technlcal Grade 453.0 455.2 ± 0.6 • According to the supplier.
b Calculated from Catoire's model [42]. < This work ± standard deviation. d From [16].
Ceriani's equation (Eq. (2)) is a group contribution based method for vapor pressure prediction of substances found in fats and oils, such as fatty esters, fatty acids and acylglycerols. It was chosen to be tested along with Antoine's law due to its predictive character. It also has been validated in the literature for fatty esters and acids [28,46,47], and, differently from Antoine's law, its range of applicability is not strictly limited by temperature or vapor pressure data availability.
(2) Ceriani's equation parameters A;, Biand C; are calculated from the expressions:
A;=
L
Nt•(A1t+
Mi•A20+
(So+
Ncs•si)+
a•(fo+
Nc•fi) k B; =L
Nk•(Btt+
M;•�k)+
/3•(fo+
Nc•fi) k C; =L
Nk•(C1t + M;•½t) k (3) (4) (5) where the index k refers to the types of groups found in the molecule,which can be CH3, CH2, COOH, C=, OH, COO, and CH2-CHCH2•
Aik, B1k, Ctt, A2t, B2k, C2t,
a,
{3, s0, Si, f0 and f1 are parameters adjustedfrom an extensive vapor pressure database of fats and oils. M; is the molar mass of component i, Ne is the number of carbons in the mole
cule, and Ncs is the number of carbon atoms in the alcoholic part of the
fatty ester, which is 2 for ethyl esters.
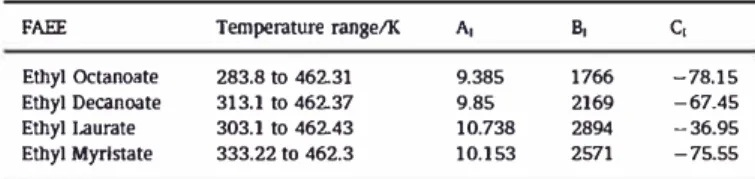
Thus, we will use and compare both methods in this work. Antoine parameters were used to describe the vapor pressure of ethyl octanoate, ethyl decanoate, ethyl laurate and, ethyl myristate [48). Antoine's coefficients Ai, B; and C; of each FAEE are listed in Table 2. However, no Antoine parameters were found in the temperature range of interest for ethyl palmitate and ethyl stearate. Therefore, for these two FAEEs the group contribution model (Method 1) was used.
Table 2
Antoine equation parameters to some FAEE (Pl'" in Pa and Tin K).
FAEE Temperature range/K A, B,
c,
Ethyl Octanoate 283.8 to 46231 9.385 1766 -78.15 Ethyl Decanoate 313.1 to 46237 9.85 2169 -67.45 Ethyl Laurate 303.1 to 46243 10.738 2894 -36.95 Ethyl Myrlstate 333.22 to 462.3 10.153 2571 -75.55 (ASTM 06450 - ASTM 093C) 360.8 -6.8 387.7 -8.2 399.7 2.6 423.7 -0.1
-433.8 9.4 464 -5.7 427 26.2 -429 26.2 1 P.og 10, · sat=
A,· - ---B; T+ C;(ASTM 06450 - (ASTM O93C
-catoire) Catoire) 0.8 7.6 0.8 9.0 1.7 -0.9 -1.7 -1.6 0.7 -8.7 1.1 6.8 -4.9 -31.0 -0.3 2.2 -24.0 (6)
The root mean square deviation (RMSD) between experimental data and predicted values is calculated according to Eq. (7).
RMSD
=
L
FP,k - Fp,k m(<�
rm'"h2)
'k=l m (7)
where r;1,k is the average of measured FP in K at point k,
T;J.1
is the FP temperature predicted by the model in K at point k, and m is the number of experimental points.3. Results and discussion
3.1. Flash point of pure saturate.d FAEEs
Pure FAEEs FP values measured by means of the ASTM D6450
method are listed in Table 1. The standard deviations of experimental
measurements were estimated by performing repeated experimental runs at least three times with each pure FAEE. These deviations stayed in the range of 0.06 to 1 K. The variation coefficients of these mea surements are within the range of 0.1 - 0.6 %. These values are Jower than those observed for FP data already reported in the literature
[11,49,50).
As it can be seen in Fig. 1, the FP of pure even-numbered FAEEs increases almost linearly as a function of the carbon Jength. This be havior is strongly related to the volatility of the fatty substances and
480 460 440 g420
:t 400
380 360 340 8 JO 12 14 16 18 20 22carbon chain length
Fig. 1. Flash point of FAEEs as a function of their carbon chain length. (-) is the linear regression corresponding to the PP of the even-numbered FAEEs.
consequently to their boiling point. In other words, the higher the carbon chain, the lower the volatility. Lower volatility for flammable substances implies a higher FP. We recall that Catoire’s empirical model for predicting the FP of pure compounds and blends correlates FP with the boiling temperature and carbon chain[42,51,52]. Catoire’s model relies on a large FP dataset of organic compounds and has been proven to be quite accurate for FP prediction of pure substances[42]. In this study, FPs of pure FAEEs were calculated from Catoire’s model (Table 1), with normal boiling points and number of carbons described onTable S1 of the supplementary material. AsTable 1shows, FPs ob-tained from ASTM D6450 are way closer to values predicted from Ca-toire’s model than FPs obtained from ASTM D93C are. Differences be-tween calculated and experimental FP are lower than 4.9 K for ASTM D6450, while for ASTM D93C the difference can be of up to 30 K. This observation, among other circumstances, led us to choose ASTM D6450 instead of ASTM D93C.
Another factor we considered for choosing ASTM D6450 over ASTM D93C was linear character of FP as a function of chain size. The outlier point in Fig. 1 refers to ethyl pentadecanoate. This behavior is ex-plained by the odd-numbered carbon chain length of ethyl pentade-canoate. Normally, some properties, such as melting point, density, enthalpy of vaporization and normal boiling point, increase linearly for even-numbered carbon chain substances, as fatty acids, fatty acid alkyl esters and dicarboxylic acids[48,53–56]. Odd-numbered carbon chain
fatty substances also present another linear increase for physicochem-ical properties with a different expression from the even-numbered carbon chain linear dependency[48,53–56]. We expect that such be-havior can be observed to FP too.
Since the FP of even-numbered FAEEs had been measured in a previous study using the ASTM D93C method, we also listed these re-sulting values inTable 1. The difference between the values ranges from 0.1 to 9.4 K. According to ASTM, the reproducibilities (R) of ASTM D6450 and ASTM D93C methods are equal to R = 3.1 K and R = 14.7 K [57,58], respectively. Based on that, we can consider that pure satu-rated FAEEs FPs are in agreement with each other. Besides, the ASTM D6450 FPs displayed in Fig. 1 can be regressed linearly versus the carbon chain length for the even-numbered FAEEs with R2= 0.9934, whereas for the ASTM D93C FP data set inTable 1, the correlation as a function of carbon chain length is equal to R2= 0.9843. This implies that the new set of data measured by the ASTM D6450 is more linearly consistent than the ASTM D93C data set.
Another reason behind choosing ASTM D6540 over ASTM D93 is that ASTM D6450 provides a more controlled environment for FP measurement, as it demands smaller sample volumes and guarantees continuous agitation during the measurements, allowing uniform va-por–liquid phase temperature, which has equilibrium implications, even though both methods are dynamic, and relies on controlled air injection to provide oxygen for combustion.
ethyl octanoate + ethyl laurate ethyl decanoate + ethyl myristate ethyl laurate + ethyl palmitate
xethyl octanoate FP/K SD xethyl decanoate FP/K SD xethyl laurate FP/K SD
0.0000 402.3 0.6 0.0000 423.6 0.6 0.0000 443.2 0.6 0.1077 390.4 0.6 0.0993 412.8 0.1 0.1041 433.9 0.1 0.1978 381.5 0.6 0.2075 403.9 0.1 0.2008 427.9 0.1 0.4015 371.0 0.1 0.4019 395.8 0.1 0.4042 418.5 0.6 0.6011 364.0 0.1 0.5974 388.7 1.0 0.6023 412.9 0.1 0.7967 359.0 0.1 0.8006 384.9 0.1 0.7981 407.9 0.1 1.0000 354.0 0.1 1.0000 379.5 0.6 1.0000 402.3 0.6
ethyl octanoate + ethyl myristate ethyl decanoate + ethyl palmitate ethyl laurate + ethyl stearate
xethyl octanoate FP/K SD xethyl decanoate FP/K SD xethyl laurate FP/K SD
0.0000 423.6 0.6 0.0000 443.2 0.6 0.0000 458.3 0.6 0.1031 399.0 0.1 0.1155 419.5 0.5 0.1268 439.3 0.6 0.2051 386.3 0.6 0.2056 411.7 0.1 0.2148 432.1 0.6 0.4022 372.6 0.6 0.4172 397.7 0.1 0.4006 420.4 0.6 0.6002 365.0 0.1 0.5993 390.7 0.1 0.5970 413.8 0.1 0.7988 359.3 0.6 0.7997 385.8 0.1 0.7924 408.3 0.6 1.0000 354.0 0.1 1.0000 379.5 0.6 1.0000 402.3 0.6
ethyl octanoate + ethyl palmitate ethyl decanoate + ethyl stearate ethyl myristate + ethyl palmitate
xethyl octanoate FP/K SD xethyl decanoate FP/K SD xethyl myristate FP/K SD
0.0000 443.2 0.6 0.0000 458.3 0.6 0.0000 443.2 0.6 0.1224 401.0 1.7 0.0948 430.6 0.6 0.1028 439.9 1.0 0.2272 385.0 0.1 0.1994 414.3 0.6 0.2013 437.9 0.1 0.3995 373.3 0.6 0.4013 397.3 0.6 0.3982 433.2 0.6 0.6004 365.6 0.6 0.5826 391.1 0.2 0.5992 429.9 0.1 0.8096 359.0 0.1 0.7970 385.0 0.1 0.7995 426.5 0.6 1.0000 354.0 0.1 1.0000 379.5 0.6 1.0000 423.6 0.6
ethyl octanoate + ethyl stearate ethyl laurate + ethyl myristate ethyl myristate + ethyl stearate
xethyl octanoate FP/K SD xethyl laurate FP/K SD xethyl myristate FP/K SD
0.0000 458.3 0.6 0.0000 423.6 0.6 0.0000 458.3 0.6 0.1009 407.6 0.6 0.1010 420.8 0.1 0.1836 447.4 0.6 0.2025 390.0 0.1 0.2020 417.8 0.1 0.2629 443.8 0.1 0.4030 374.0 0.1 0.4037 412.8 0.1 0.4020 438.8 0.1 0.5866 366.0 0.1 0.6002 409.1 0.6 0.6424 430.9 0.1 0.7997 360.0 0.1 0.7981 405.9 0.1 0.8141 427.5 0.6 1.0000 354.0 0.1 1.0000 402.3 0.6 1.0000 423.6 0.6 Table 3
In addition to showing a better consistency in FP values for the even-numbered FAEEs, ASTM D6450, again, presents the advantage of using only 1 mL of sample in each analysis. This can reduce drastically the cost of measurements in contrast to the ASTM D93C method, which requires 75 ml.
3.2. Flash point of pure W1Saturated FAEEs
FPs of Ethyl Oleate and Ethyl Llnoleate were measured as well
(Table 1). The standard deviations of these measurements were about 0.6 K, with variation coefficients lower than 0.2%. Table 1 shows that the FP values of these FAEEs were lower than the FP of Ethyl Stearate. As observed in a previous work, the FP of FAEEs depends on carbon chain size and number of unsaturation [16). Therefore, even though Ethyl Oleate and Ethyl Llnoleate have the same carbon chain size as Ethyl Stearate, the presence of any unsaturation causes the vapor pressure to increase, which reduces the FP consequently.
There is some discrepancy between experimental data obtained through the standard Method ASTM D6450 and the values obtained by ASTM D93 measurements. This could be due to the fact that the purities of the unsaturated FAEEs used in this study and the ones in the lit erature were not high, Technical Grade (TG), which implies that con taminants, such as ethyl palmitate (C16:0) and ethyl stearate (C18:0) were present in a variety of considerable concentrations. In fact, the TG ethyl oleate and TG ethyl linoleate used in this study do contain ethyl palmitate and ethyl stearate. Characterization of these reagents through gas chromatography indicated TG ethyl oleate's molar composition to be 1.91 % ethyl stearate, 88.39% ethyl oleate and 9.70% ethyl linoleate, while TG ethyl linoleate's molar composition is made of 7.98% ethyl palmitate, 2.26% ethyl stearate, 12.66% ethyl oleate and 77.10% ethyl linoleate.
3.3. Flash point of bùta,y and tema,y mixtures
Experimental PP values of the binary mixtures involving saturated
470
450
430
g410
t
a)
390
370
350
0.0 0.2 0 C8:0 + CJ2:0 {ASTM D6450) D C8:0 + CJ4:0 {ASTM D6450) 6 C8:0 + Cl6:0 (ASTM D6450) X C8:0 + Cl 8:0 (ASTM D6450) •••••••• C8:0 + Cl2:0 (UNIFAC Bessa) - - •C8:0+Cl4:0(UNIFACBessa) - • C8:0+Cl6:0(UN1FACBessa) -C8:0+ Cl8:0 (UNIFAC Bessa) 0.4 0.6 0.8 X ethyl octanoate 1.0460 �---�
a CJ2:0+Cl4:0{ASTMD6450)450
440
g430
t
c)
420
410
400 0.0 0.2 6 Cl2:0 + Cl6:0 (ASTM D6450) X Cl2:0+Cl8:0(ASTMD6450) - - -Cl2:0+Cl4:0(UNIFACBessa) - • •CJ2:0+Cl6:0(UNIFACBessa) --CJ2:0 + CJ8:0 {UNIFAC Bessa) 0.4 0.6 X elhyl laurate 0.8 1.0esters are presented in Table 3 and plotted in Fig. 2. FP values of the
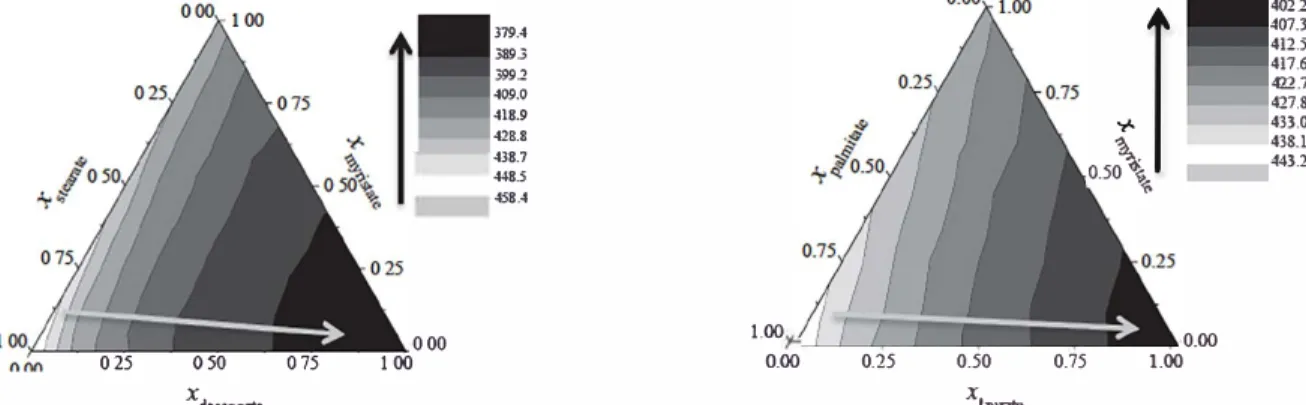
ternary mixtures of saturated FAEEs are presented in Table 4 and re
presented in Fig. 3. These sets of data show standard deviations com
parable to those observed for pure FAEEs, ranging from 0.01 to 1.0 K, and variation coefficients within the range of 0.0--0.2 %. Additionally, experimental data on binary systems containing unsaturated
FAEEs
+saturated FAEEs are presented
inTable
5(Ethyl Oleate
+Sa
turated FAEE) and Table 6 (Ethyl Linoleate
+
Saturated FAEE). Thestandard deviation for these sets of data range from 0.1 to 3.1 K, while the variation coefficients are lower than 0.7% in general.
-where FP is the average FP, FPk is one of the measured FP values out of
three measurements.
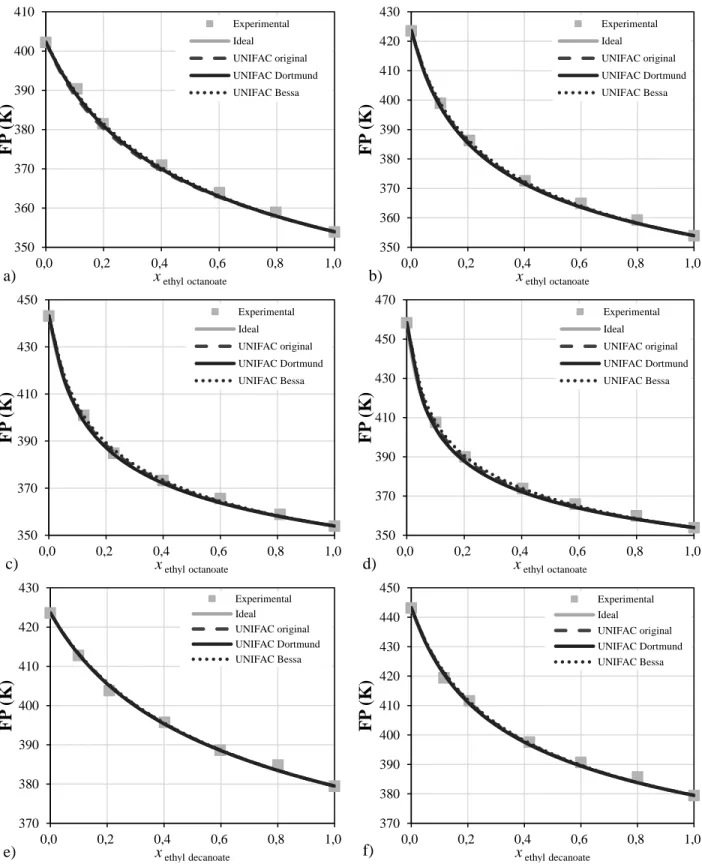
3.3.1. FP modeling method 1 for saturated FAEEs
FP of binary and ternary mixtures of Saturated FAEEs were calcu
lated by using Ceriani's group contribution method [45) for vapor
pressure and testing three UNIFAC type models (Original, Dortmund and Bessa) to estimate activity coefficients of components in the liquid
phase. Detailed results are presented as Supplementary Data, as well as
results obtained assurning an ideal behavior for the liquid phase (Y; = 1).
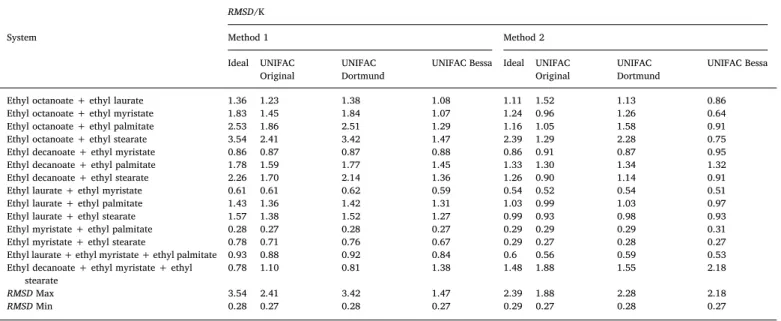
The Root Mean Square Deviation (RMSD) between experimental
data and predicted values are exposed in Table 7. These values show
that the FP temperature predicted from the activity coefficient models are in agreement with the experimental data RMSD values range from 0.27 K to 3.54 K. Overall, the UNIFAC Bessa model showed better re sults, with a RMSD between 0.27 and 1.47 K. In detail, we can note that white the lowest deviation is found for the system formed by ethyl
myristate
+
ethyl palmitate (RMSD from 0.27 to 0.28K),
the highestdeviation is found for the system containing ethyl octanoate
+
ethylstearate (RMSD from 1.47 to 3.54 K).
470
450
g430
"'- 410
390
370
b)
0.0 a CI0:0 + Cl4:0 (ASTM D6450) 6 CJ0:0 + CJ6:0 {ASTM D6450) X CI0:0 + Cl8:0 (ASTM D6450) - - -CI0:0 + CJ4:0 (UNlFAC Bessa) - • •CI0:0+Cl6:0( UNJFACBessa) --CI0:0 + Cl8:0 {UNIFAC Bessa)0.2 0.4 0.6 0.8 X elhyl decanoate 1.0
460 -�---�
d)
450
430
420
0.0
0.2
6 Cl4:0 + Cl6:0 (ASTM D6450) X Cl4:0 + Cl8:0 (ASTM D6450) - • -Cl4:0 + CJ6:0 {UNIFAC Bessa) --CJ4:0 + CJ8:0 (UNIFAC Bossa) 0.4 0.6 X cthyl myristatc 0.81.0
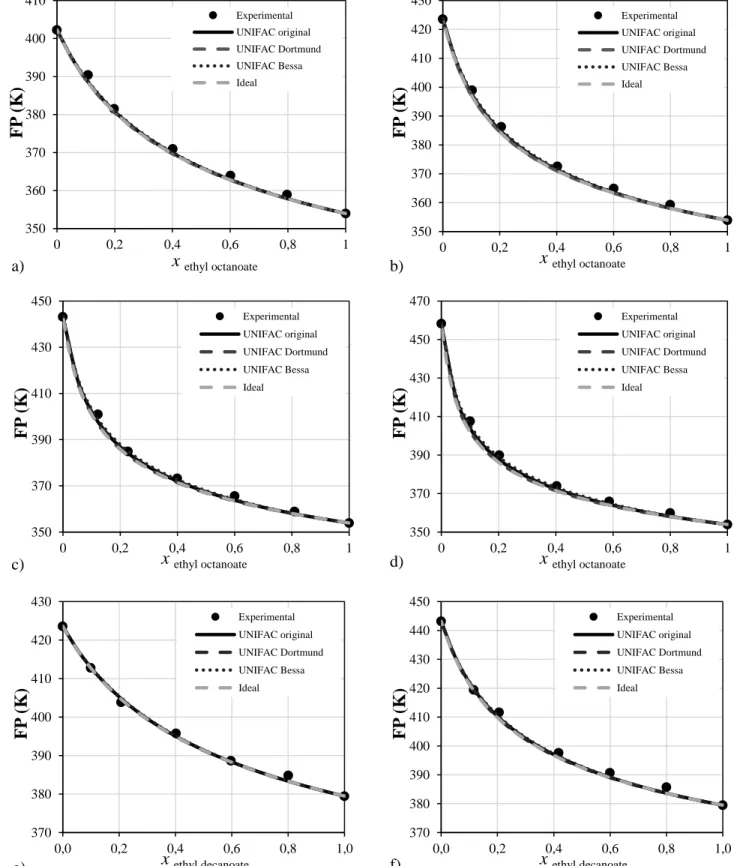
Fig. 2. FP experimental and predicted values (UNlFAC Bessa/Method 2) of Saturated FAEE binary mixtures.Table 4
PP results for the Saturated FAEES temary systems. et/ryl deœnoate + et/ryl myrts111te + etlryl stearate XethYI decanoate Xetb.YI m)'J'IState lCethYI stea.rate
0.7689 0.1114 0.5495 0.1064 0.4024 0.1029 0.2607 0.0966 0.0806 0.0987 0.5583 0.3219 0.4084 0.4760 0.2735 0.6143 0.0893 0.8032 0.0816 0.2854 0.0839 0.4365 0.0885 0.5865 0.5099 0.2615 0.3561 0.2516 0.2137 0.2473 0.3602 0.3588 0.2196 0.5057 0.2182 0.3473 0.2585 0.3595
SD stands for Standard Deviation.
025 OSO X de<aooat. 0.1198 0.3441 0.4947 0.6427 0.8207 0.1198 0.1156 0.1122 0.1075 0.6330 0.4796 0.3251 0.2287 0.3923 0.5390 0.2810 0.2747 0.4345 0.3821 0 75 100 0 00 FP/K 384.8 390.5 395.2 404.2 426.9 389.9 393.5 400.5 414.5 422.9 420.2 416.9 390.9 397.5 407.5 397.2 405.2 406.2 402.9 379.4 389.3 399.2 409.0 418.9 428.8 438.7 448.5 458.4 SD 0.1 0.6 0.6 0.6 0.1 0.1 0.6 0.6 0.6 0.1 0.6 0.1 0.1 0.6 0.6 0.6 0.6 0.6 0.1
ethyl laurate + et/ryl myrtstate + ethyl palmitate
Xetbyt la.urate 0.7987 0.5979 0.4471 0.3007 0.1010 0.6005 0.4494 0.3032 0.1018 0.1045 0.1006 0.0999 0.5488 0.4035 0.2493 0.3801 0.2524 0.2531 0.3335 1.00 0.00 Xetbyl m)'J'IState 0.0984 0.1007 0.1074 0.1032 0.1051 0.2992 0.4500 0.5975 0.7960 0.2993 0.4508 0.6001 0.2476 0.2490 0.2502 0.3651 0.4980 0.3488 0.3311 0.25 0.50 Xlaurate Xetb,y1 p.a.lmttate 0.1029 0.3013 0.4455 0.5961 0.7939 0.1003 0.1006 0.0993 0.1022 0.5963 0.4486 0.3000 0.2036 0.3476 0.5005 0.2548 0.2496 0.3981 0.3354
... 1
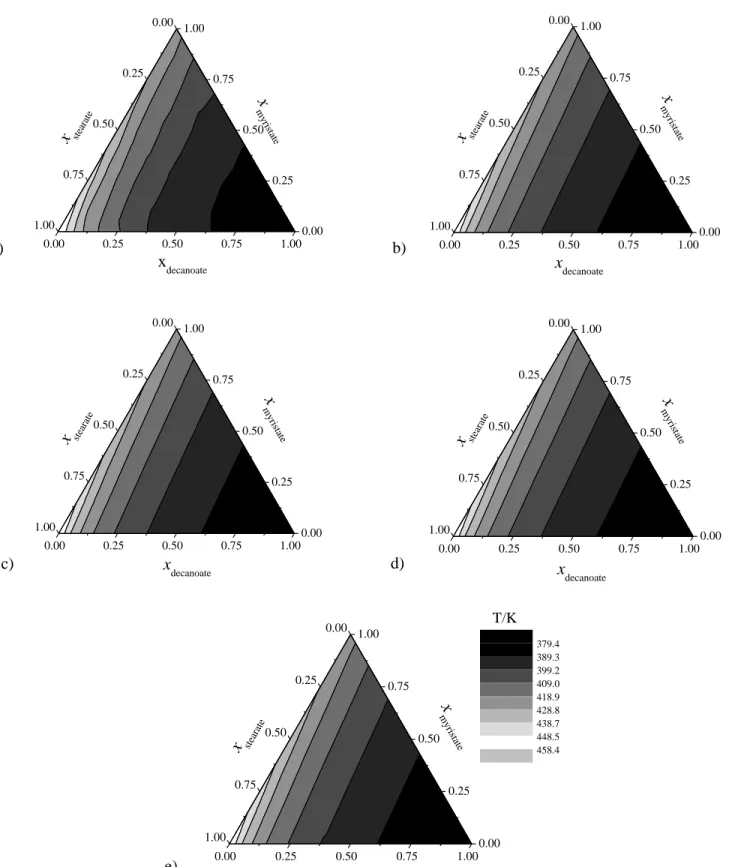
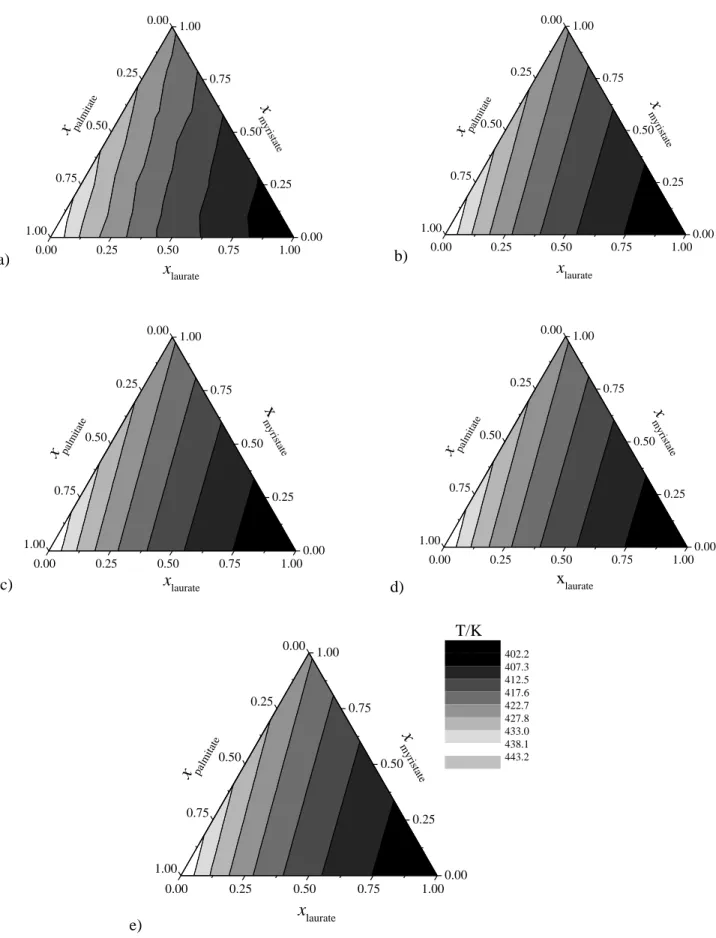
�-0.50\ 0.75 1.00 0.00 FP/K 406.4 411.4 415.8 421.8 432.1 410.1 412.8 416.8 421.8 428.5 426.9 424.5 411.9 415.9 421.5 415.1 418.8 420.8 417.8 402.2 407.3 412.5 417.6 422.7 427.8 433.0 438.1 443.2 SD 0.6 0.6 0.1 0.1 0.6 0.6 0.1 0.1 0.1 0.6 0.1 0.6 0.1 0.1 0.6 0.6 0.1 0.1 0.1Fig. 3. PP experirnental values of temary mixtures. a) ethyl decanoate
+
ethyl myristate+
ethyl stearate; b) ethyl laurate+
ethyl myristate+
ethyl palmitate.Table 5 Table 6
PP results for Ethyl Oleate
+
saturated FAEEs binary systems. PP results for Ethyl Linoleate+
saturated FAEEs binary systems. et/ryl octanoate + et/ryl oleate et/ryl deœnoate + et/ryl oleate et/ryl octanoate + et/ryl linoleate ethyl decanoate + etlryl linoleateXethYI octanoate FP/K SD Xetb.YI decanoate FP/K SD Xethyl octanoate FP/K SD Xetb.yt deœnoate FP/K SD
0.0 453.1 0.6 0.0 453.1 0.6 0.0 455.2 1.6 0.0 455.2 1.6 0.1 406.4 0.6 0.1 426.9 0.1 0.1 407.8 0.1 0.1 426.0 0.6 0.2 388.8 1.0 0.2 413.9 0.1 0.2 391.1 0.6 0.2 414.0 0.6 0.4 374.1 0.6 0.4 398.5 0.6 0.4 374.4 0.6 0.4 399.1 0.6 0.6 364.8 0.1 0.6 390.2 0.6 0.6 365.8 0.1 0.6 390.8 0.1 0.8 359.8 0.1 0.8 384.8 0.1 0.8 360.8 0.1 0.8 384.4 0.6 1.0 354.0 0.1 1.0 379.5 0.6 1.0 354.0 0.1 1.0 379.5 0.6
et/ryl laurate + et/ryl oleate et/ryl myrts111te + etlryl oleate et/ryl laurate + et/ryl linoleate ethyl myrtstate + ethyl linoleate
XethYI J.au:rate FP/K SD Xetb.YI m)'r'IState FP/K SD Xetbyl Jau:.rate FP/K SD Xetb.yt mmstate FP/K SD
0.0 453.1 0.6 0.0 453.1 0.6 0.0 455.2 1.6 0.0 455.2 1.6 0.1 440.1 0.6 0.1 448.1 0.6 0.1 441.8 0.1 0.1 448.5 0.6 0.2 430.8 0.1 0.2 443.4 0.6 0.2 432.1 0.6 0.2 444.5 0.6 0.4 419.9 0.1 0.4 437.4 3.1 0.4 420.4 0.6 0.4 437.9 0.1 0.6 412.5 0.6 0.6 430.8 1.0 0.6 412.7 0.1 0.6 431.8 0.1 0.8 407.2 0.6 0.8 426.1 0.6 0.8 407.7 0.1 0.8 427.8 0.1 1.0 402.3 0.6 1.0 423.6 0.6 1.0 402.3 0.6 1.0 423.6 0.6
3.3.2. FP modeling method 2 for saturated FAEEs
FP curves calculated using Antoine’s law for the vapor pressures of Saturated FAEEs and using the three UNIFAC models or the ideal be-havior ( = 1i ) for the liquid phase are also presented asSupplementary Data. The RMSD between experimental data and thermodynamic cal-culations is presented inTable 7, ranging from 0.27 to 2.39 K. In a similar way as to Method 1, the UNIFAC Bessa model exhibited the best results (RMSD from 0.27 to 2.18 K) (Fig. 2). Here, the system ethyl myristate + ethyl stearate showed the lowest deviation with RMSD ranging from 0.27 to 0.29 K. The highest deviations are found using UNIFAC Dortmund and the ideal model for ethyl octanoate + ethyl stearate system (RMSD equal to 2.28 and 2.39 K, respectively). How-ever, the highest deviations for the UNIFAC original and UNIFAC Bessa models are obtained for the ternary system ethyl decanoate + ethyl myristate + ethyl stearate (RMSD equal to 1.18 and 2.18 K, respec-tively).
3.3.3. Comparison between methods 1 and 2 used to calculate the vapor pressure of saturated FAEEs
Overall, Method 2, which includes a predictive activity coefficient model and Antoine’s equation, provided better results than the entirely predictive Method 1. The exception is the ternary system ethyl decan-oate + ethyl myristate + ethyl stearate where the use of Method 2 to calculate the FAEEs vapor pressure increased the RMSD from an average value of 1.02 K to 1.77 K.
Antoine coefficients were obtained from the literature. No extra-polation was needed in order to apply Antoine’s equation to vapor pressure calculation for the systems under study, which implies that this may be an accurate vapor pressure model depending on the reliability of the vapor pressure data that it was adjusted to. As Ceriani’s model is a predictive approach to vapor pressure calculation based on group contributions, we expected that its influence on FP calculation could become a source of error. Also, Antoine’s law, shows better accuracy in comparison to Ceriani’s equation, which underestimates vapor pressure values, as shown byFig. 4. As the FP prediction results suggest, Method 2 was more accurate than Method 1, as expected (Table 7). However, we noticed that RMSDs obtained through Method 1 were comparable to Method’s 2 RMSDs. Therefore, we can conclude that FP prediction is not influenced by the selection of the vapor pressure method (Method 1 or 2). This is advantageous especially when no experimental data on vapor
pressure is available, since Method 1 relies on group contribution. 3.3.4. Activity coefficients considering binary saturated FAEEs systems
In a previous work[16], in order to estimate the FP of ethylic biodiesel, we assumed that interactions between FAEE molecules were nearly ideal, with = 1i . This assumption was made based on the che-mical structures of these molecules, which can be quite similar, de-pending mostly on chain size for saturated FAEEs. Therefore, for binary mixtures, as carbon chains become closer in size, we expect a solution behavior closer to the ideality.
In this study, we observed that most binary mixtures containing saturated FAEE molecules present a behavior nearly ideal indeed, which is reflected on FP calculation. As shown inTable 3, RMSDs be-tween experimental and calculated FP considering the ideal model present values close to those obtained through UNIFAC type models. This observation is valid specially when mixture constituents have si-milar chain sizes. However, as chain sizes diverge, the FP calculated through the ideal model becomes less accurate. For mixtures containing ethyl octanoate, for example, the RMSDs obtained considering the ideal model increase proportionally to carbon chain size divergence. It varies Table 7
RMSD between the experimental data and the predicted values from ideal curve, UNIFAC Original, UNIFAC Dortmund and UNIFAC Bessa and vapor pressure calculated with Method 1 and Method 2.
RMSD/K
System Method 1 Method 2
Ideal UNIFAC
Original UNIFACDortmund UNIFAC Bessa Ideal UNIFACOriginal UNIFACDortmund UNIFAC Bessa
Ethyl octanoate + ethyl laurate 1.36 1.23 1.38 1.08 1.11 1.52 1.13 0.86
Ethyl octanoate + ethyl myristate 1.83 1.45 1.84 1.07 1.24 0.96 1.26 0.64
Ethyl octanoate + ethyl palmitate 2.53 1.86 2.51 1.29 1.16 1.05 1.58 0.91
Ethyl octanoate + ethyl stearate 3.54 2.41 3.42 1.47 2.39 1.29 2.28 0.75
Ethyl decanoate + ethyl myristate 0.86 0.87 0.87 0.88 0.86 0.91 0.87 0.95
Ethyl decanoate + ethyl palmitate 1.78 1.59 1.77 1.45 1.33 1.30 1.34 1.32
Ethyl decanoate + ethyl stearate 2.26 1.70 2.14 1.36 1.26 0.90 1.14 0.91
Ethyl laurate + ethyl myristate 0.61 0.61 0.62 0.59 0.54 0.52 0.54 0.51
Ethyl laurate + ethyl palmitate 1.43 1.36 1.42 1.31 1.03 0.99 1.03 0.97
Ethyl laurate + ethyl stearate 1.57 1.38 1.52 1.27 0.99 0.93 0.98 0.93
Ethyl myristate + ethyl palmitate 0.28 0.27 0.28 0.27 0.29 0.29 0.29 0.31
Ethyl myristate + ethyl stearate 0.78 0.71 0.76 0.67 0.29 0.27 0.28 0.27
Ethyl laurate + ethyl myristate + ethyl palmitate 0.93 0.88 0.92 0.84 0.6 0.56 0.59 0.53
Ethyl decanoate + ethyl myristate + ethyl
stearate 0.78 1.10 0.81 1.38 1.48 1.88 1.55 2.18
RMSD Max 3.54 2.41 3.42 1.47 2.39 1.88 2.28 2.18
RMSD Min 0.28 0.27 0.28 0.27 0.29 0.27 0.28 0.27
aThe vapor pressure for ethyl palmitate and ethyl stearate were calculated with the group contribution model proposed by[45].
Fig. 4. Vapor pressure values of the FAEEs using the group contribuition
method proposed by Ceriani et al.[45]and using the Antoine equation pro-posed by Benziane et al.[48]. From bottom to top: ethyl myristate, ethyl lau-rate, ethyl decanoate and ethyl octanoate curves.
470 ,---,---� 450 430
g
� 410 r.. 390 370 • Experimental -UNIFAC original - - UNIFACDortmund • • • • • • UN1F AC Bessa 350 +----,----,---,----,---! 0 0.20.4
0.6 0.8 X ethyl octanoateFig. 5. Comparison between experimental FP and UNIFAC models or ideal curve of binary system ethyl octanoate
+
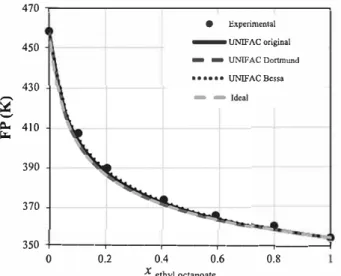
ethyl stearate (with vapor pressure calculated using the Method 1).from an RMSD value of 1.36 K (Method 1) regarding the system ethyl octanoate
+
ethyl laurate to an RMSD of 3.54 K (Method 1) for ethyl octanoate+
ethyl stearate which translates to an absolute discrepancy of up to 5.7 K for this system (Fig. 5).This maximum absolute discrepancy can be reduced to 2.2 K (1.47 K in terms of
RMSD
for Method 1) by employing the UNIFAC Bessa model to activity coefficient calculation. This suggests that for this system (ethyl octanoate+
ethyl stearate), the evaluation of liquid phase non ideality through activity coefficients is important. lt should be noticed that from the UNIFAC models tested, UNIFAC Bessa showed the best accuracy in FP prediction concerning most systems, while original UNIFAC came in second, and UNIFAC Dortmund was the least accurate. The activity coefficients calculated through each of these UNIFAC type models for most FAEE systems are in fact close to unit. For thesystem containing quite similar molecules, ethyl laurate
+
ethyl myristate, activity coefficients vary from 0.992 to 1.000 (Fig. 6a and b). In
this case the ideal model can be adequate and using an activity 1.001 0.999
:t':
0.997,
F,
,
...
'
0.995,
,
'
'
,
0.993
,
-Mctbod I UN!FACoriginal ---Mdbod I UNIFAC Oortn:n.md'
'
- -Metbod J lJNTFAC Beua'
0.991 0 0.2 0.4 0.6 0.8 a} x, 1.05
.,
,,,
.,, :oc.- - - ---:.,..,_..,.:,----
--
-0.95�
-
-
...
F 0.9-
-
...
'
--
'
0.85'
-Mctbod I UNIFACorigioll'
0.8 --- Method I UNlFAC DortmuDd
'
- -Mccbod I UNIFAC Besse
'
0.750 0.2 0.4 0.6 0.8
c} x,
coefficient model is not improving significantly the prediction. When it cornes to the system ethyl octanoate
+
ethyl stearate though, activity coefficients calculated by each UNIFAC model vary from 0.75 to 1.05(Fig. 6c and d), hinting to a non ideal solution behavior, and validating the need for using a model with activity coefficient models. As known from theory, positive deviations from ideality (repulsive interactions between molecules) result in activity coefficients greater than unit, while negative deviations (attractive interactions) result in activity coefficients lower than one. Therefore, the system composed by ethyl octanoate
+
ethyl stearate deviates negatively from ideality, which means that the vapor pressure of this system is lower than what would be expected from an ideal behavior. This results on the mixture's pre dicted FP based on the ideal model being lower than the experimental value (Fig. 5). Among the UNIFAC models tested, UNIFAC Bessa was the one able to account for this behavior, whilst original UNIFAC pre dicted a nearly ideal behavior and UNIFAC Dortmund suggested both attractive and repulsive interactions.We would like to emphasize that although many of the systems studied are nearly ideal, the UNIFAC models tested, especially UNIFAC Bessa, were still capable of improving FP prediction for most of those
systems, as Table 7 shows. This improvement was even more percep
tible for systems where the chain sizes of components diverge by more than 4 carbons. Regarding the ternary systems studied, a nearly ideal behavior was observed, which is related to similarity between the molecules involved in the solution.
These results differ in a certain way from what had been observed previously for binary systems containing Fatty Acid Methyl Esters (FAME) [28]. These types of systems seem to behave in an even more ideal way than systems composed by FAEEs. This might be due to structural differences, since FAEEs have a extra carbon atom when compared to FAME in the alcoholic moiety of the molecule. Due to this, UNIFAC type models are not able to improve the FP prediction of so lutions formed by FAMEs, while for those containing FAEEs, the im provement is evident.
3.4. FP modeUing method 1 for unsaturated FAEEs and activity coefficients
To our best knowledge, there are no Antoine coefficients for un saturated FAEEs in the literature on the temperature ranges of interest
1.001 0.999 0.997 F
'
0.995,
,
'
,
'
,
-Method 2 UNIFACoriginal'
0.993'
---Method2UNIFACOortmund'
- -Method2UNfFAC8essa 0.991 0 0.2 0.4 0.6 0.8 b} x, 1.05.,
,,,
�---
...
..,_..-:,
--,-
--0.95-:::
-
...
F 0.9-
-
-
-
...
'
-
-
'
0.85'
--Melbod2UKIFACori8in>I'
0.8 --- Mc'lhod Z UNIFAC Oortmuod
'
- -Melhod Z UNIFAC Dcis1111
'
0.75
0.2 0.4 0.6 0.8
d} x,
for this study. As there was no significant difference between Method 1 and Method 2 in terms of FP prediction, Method 1 was selected for the prediction of FP of binary mixtures involving Unsaturated FAEEs.
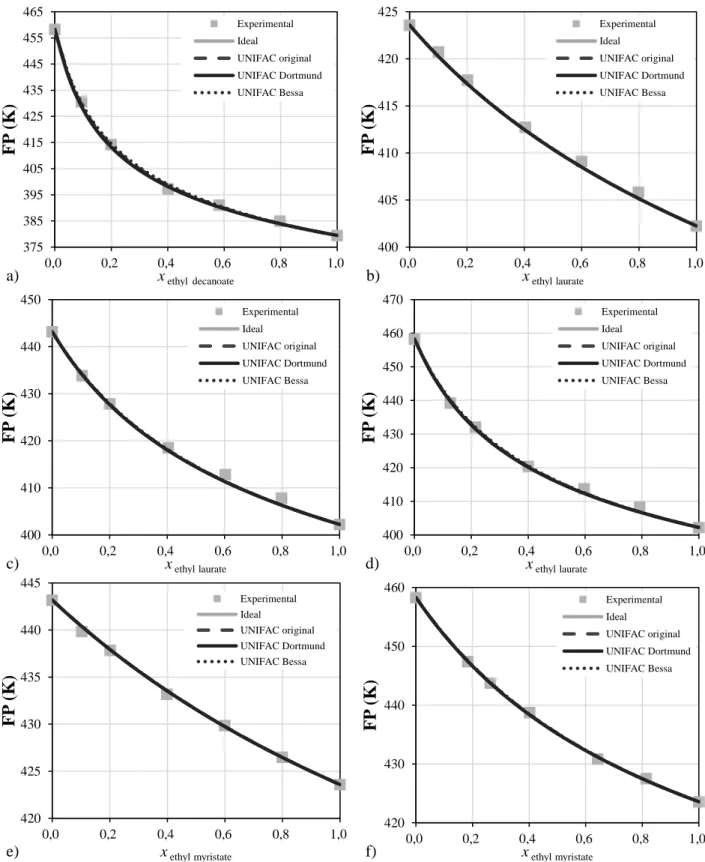
Overall, UNIFAC type models could improve FP prediction for mixtures containing Unsaturated FAEEs (Table 8). Ethyl linoleate sys-tems seemed to be less ideal than ethyl oleate ones. One can conclude that the presence of double bonds increases the non-ideality of mixtures of saturated esters and unsaturated esters proportionally to the number of double bonds present and how those influence the shape of the un-saturated molecules.
AsTable 8shows, among the three UNIFAC type models used for non-ideality characterization, UNIFAC Bessa resulted in more accurate FP prediction (max. RMSD 1.02 K and min. RMSD 0.43 K). The accu-racy in FP prediction with UNIFAC Bessa is similar for systems con-taining either ethyl oleate and ethyl linoleate. On the other hand, Original UNIFAC and UNIFAC Dortmund resulted in less accurately predicted FP values in general in comparison to UNIFAC Bessa, except for the systems involving ethyl myristate for which UNIFAC Bessa’s RMSDs are slightly higher.
A tendency previously observed for binary systems composed by saturated FAEEs was that the non-ideal character of the binary solution increases according to the difference between carbon chain sizes of the molecules involved in the mixture. This tendency is the same when it comes to systems of saturated + unsaturated FAEEs. We observed that the non-ideal character of the solution becomes more relevant when the difference in the carbon chain sizes of components increases. The FP prediction of a mixture of ethyl octanoate (C8:0), for example, with ethyl oleate (C18:1) can be significantly improved, in comparison to the ideal model result (RMSD of 2.95 K) by employing a UNIFAC type model, such as UNIFAC Bessa (RMSD of 1.02 K).
AsTable 8shows, UNIFAC Bessa resulted in better FP prediction in general, with a max. RMSD of 1.02 K in contrast with the RMSD of 3.78 K obtained for UNIFAC Dortmund. This is similar to what had been observed previously for saturated systems.
3.5. Flash point of biodiesel
FP values of four types of biodiesel from different feedstocks (corn, canola, cotton and soy oils) were measured in this study. Experimental FP values may be found inTable 9, while the characterization of each biodiesel is presented inTable 10. The characterization results through Gas Chromatography show that the major components in each biodiesel are ethyl palmitate (C16:0), ethyl stearate (C18:0), ethyl oleate (C18:1) and ethyl linoleate (C18:2). In terms of carbon chain size, there is not much difference between components, since the highest difference is by only two carbons between ethyl palmitate and the other compounds. This indicated that for these systems, a nearly ideal behavior could be
expected.
As foreseen, FP calculated from the Ideal model showed good agreement with experimental results. Out of the UNIFAC type models evaluated, UNIFAC – Dortmund was capable of slightly improving the FP prediction in comparison to the Ideal model, with a max AAD of 3.8 K and min AAD of 1.6 K (Table 11). However, the improvement observed was not significant (about 0.2 K). On the other hand, UNIFAC Bessa was not as accurate as the Ideal model or any of the other UNIFAC Table 8
RMSD between the experimental data and the predicted values from ideal curve, UNIFAC Original, UNIFAC Dortmund and UNIFAC Bessa and vapor pressure calculated with Method 1 for binary systems containing Unsaturated FAEEs + Saturated FAEEs.
RMSD/K
System Method 1
Ideal UNIFAC Original UNIFAC Dortmund UNIFAC Bessa
ethyl octanoate + ethyl oleate 2.95 1.69 2.79 1.02
ethyl decanoate + ethyl oleate 1.75 1.07 1.56 0.43
ethyl laurate + ethyl oleate 0.85 0.65 0.78 0.53
ethyl myristate + ethyl oleate 0.68 0.65 0.66 0.66
ethyl octanoate + ethyl linoleate 3.95 2.64 3.78 1.10
ethyl decanoate + ethyl linoleate 2.34 1.64 2.13 0.65
ethyl laurate + ethyl linoleate 1.33 1.08 1.24 0.82
ethyl myristate + ethyl linoleate 0.56 0.48 0.51 0.60
RMSD Max 3.95 2.64 3.78 1.02
RMSD Min 0.56 0.48 0.51 0.43
Table 9
FP of biodiesel: predicted (Method 1) and experimental values. Flash point of Biodiesel (K)
Biodiesel Experimental Model
Ideal UNIFAC UNIFAC Dortmund UNIFAC Bessa
Soy 456.5 454.9 454.8 454.9 454.3
Cotton 455.9 451.9 451.8 452.0 451.2
Corn 456.4 453.9 453.8 454.0 453.3
Canola 458.4 455.4 455.4 455.5 455.0
Table 10
Molar composition of biodiesel from fats and oils. Biodiesel
FAEE Soy Cotton Corn Canola
ethyl palmitate 0.071 0.252 0.141 0.077
ethyl stearate 0.031 0.022 0.022 0.031
ethyl oleate 0.298 0.167 0.359 0.585
ethyl linoleate 0.599 0.559 0.478 0.307
Table 11
Average Absolute Deviation (AAD) between experimental and predicted values (Method 2) from the Ideal model and original UNIFAC, UNIFAC Dortmund and UNIFAC Bessa.
AAD (K)
Biodiesel Model
Ideal UNIFAC UNIFAC Dortmund UNIFAC Bessa
soy 1.6 1.7 1.6 2.2 cotton 4.0 4.0 3.8 4.7 corn 2.5 2.6 2.4 3.1 canola 3.0 3.0 2.9 3.4 Max AAD (K) 4.0 4.0 3.8 4.7 Min AAD (K) 1.6 1.7 1.6 2.2
4. Conclusions
This work presents experimental FP data of 9 pure FAEE, 20 FAEE binary systems, 2 FAEE ternary systems and Biodiesels from four dif-ferent feedstocks (Canola, Corn, Cotton and Soy oils) measured in ac-cordance with ASTM D6450 standard procedure. Liaw’s model was employed to FP prediction for these systems in association with UNIFAC type models so that any possible liquid phase non-ideal be-havior could be accounted for. Predicted FP values were compared to experimental values through RMSD and AAD calculation, showing that the UNIFAC Bessa based model is more accurate in FP prediction of saturated FAEE systems than any other studied model, with RMSDs varying from 0.27 to 2.18 K. However, the ideal model also results in comparably accurate FP prediction whenever carbon chains of in-dividual compounds do not differ by more than 6 carbons in size. When there is a greater difference in carbon chain lengths between chemical species involved in the systems though, non-ideality description through activity coefficient models becomes important.
For Systems containing unsaturated FAEEs, UNIFAC Bessa shows the same accuracy in terms of FP prediction as previously noticed for most systems. Other UNIFAC type models are still able of improving the FP prediction in comparison to the ideal model for many of these sys-tems, especially the binary ones containing ethyl laurate (C12:0) or ethyl myristate (C14:0) plus ethyl oleate (C18:1) or ethyl linoleate (C18:2). UNIFAC Bessa’s accuracy in FP prediction of the binary sys-tems is not reflected in the FP prediction of Biodiesels (Canola, Corn, Cotton and Soy oils) though. This could be due to the fact that long carbon chain FAEEs and possible other contaminants were ignored in FP prediction of these systems.
As Liaw’s model requires not only liquid phase non-ideal behavior investigation, but also pure components vapor pressure estimation, the influence of the vapor pressure model selection was analyzed. Two vapor pressure models were compared for purely saturated systems: Antoine’s model and a group contribution semi empirical method for fatty compounds. The results showed that there is no significant influ-ence of the chosen option for FP prediction purposes, which means that both methods model fairly well the vapor pressure and can be used interchangeably for FP prediction of FAEE mixtures without loss of accuracy.
CRediT authorship contribution statement
Débora Costa do Nascimento: Software, Validation, Formal
analysis, Writing - original draft, Visualization. Natália Daniele Dorighello Carareto: Investigation, Software, Validation, Formal analysis, Writing - original draft. Antonio Marinho Barbosa Neto: Supervision, Writing - review & editing. Vincent Gerbaud: Supervision, Writing - review & editing. Mariana Conceição da Costa: Project administration, Funding acquisition, Supervision, Writing - re-view & editing.
Declaration of Competing Interest
The authors declare that they have no known competing financial interests or personal relationships that could have appeared to influ-ence the work reported in this paper.
Acknowledgments
We are grateful to CNPq (248539/2013-2, 310272/2017-3), FAPESP (2014/21252-0) and FAEPEX/UNICAMP for their financial support and assistantship. Additionally, this study was financed in part by the Coordenação de Aperfeiçoamento de Pessoal de Nível Superior – Brasil (CAPES) – Finance Code 001.
Appendix A. Supplementary data
Supplementary data to this article can be found online athttps:// doi.org/10.1016/j.fuel.2020.118717.
References
[1] Liaw HJ, Chiu YY. A general model for predicting the flash point of miscible mix-tures. J Hazard Mater 2006;A137:38–46.https://doi.org/10.1016/j.jhazmat.2006.
01.078.
[2] Liaw HJ, Chen CT, Cheng CC, Yang YT. Elimination of minimum flash-point be-havior by addition of a specified third component. J Loss Prev Process Ind 2008.
https://doi.org/10.1016/j.jlp.2007.10.001.
[3] Liaw HJ, Chen CT, Gerbaud V. Flash-point prediction for binary partially miscible aqueous-organic mixtures. Chem Eng Sci 2008;63:4543–54.https://doi.org/10.
1016/j.ces.2008.06.005.
[4] Bagheri M, Borhani TNG, Zahedi G. Estimation of flash point and autoignition temperature of organic sulfur chemicals. Energy Convers Manag 2012.https://doi.
org/10.1016/j.enconman.2012.01.014.
[5] Boog JHF, Silveira ELC, De Caland LB, Tubino M. Determining the residual alcohol in biodiesel through its flash point. Fuel 2011.https://doi.org/10.1016/j.fuel.2010.
10.020.
[6] Černoch M, Hájek M, Skopal F. Relationships among flash point, carbon residue, viscosity and some impurities in biodiesel after ethanolysis of rapeseed oil. Bioresour Technol 2010.https://doi.org/10.1016/j.biortech.2010.05.003. [7] Gharagheizi F, Alamdari RF. Prediction of flash point temperature of pure
compo-nents using a Quantitative Structure-Property Relationship model. QSAR Comb Sci 2008;27:679–83.https://doi.org/10.1002/qsar.200730110.
[8] Gharagheizi F, Ilani-Kashkouli P, Farahani N, Mohammadi AH. Gene expression programming strategy for estimation of flash point temperature of non-electrolyte organic compounds. Fluid Phase Equilib 2012.https://doi.org/10.1016/j.fluid.
2012.05.015.
[9] Katritzky AR, Stoyanova-Slavova IB, Dobchev DA, Karelson M. QSPR modeling of flash points: An update. J Mol Graph Model 2007.https://doi.org/10.1016/j.jmgm.
2007.03.006.
[10] Saldana DA, Starck L, Mougin P, Rousseau B, Creton B. Prediction of flash points for fuel mixtures using machine learning and a novel equation. Energy Fuels 2013;27:3811–20.https://doi.org/10.1021/ef4005362.
[11] Wu Z, Zhou X, Liu X, Ni Y, Zhao K, Peng F, et al. Investigation on the dependence of flash point of diesel on the reduced pressure at high altitudes. Fuel 2016.https://
doi.org/10.1016/j.fuel.2016.05.062.
[12] ASTM:D975-15b. Standard specification for diesel fuel oils. 2015. doi:10.1520/ D0975-12A.2.
[13] ASTM D6751-15c. Standard specification for biodiesel fuel blend stock (B100) for middle distillate fuels. ASTM Int 2010.https://doi.org/10.1520/D6751. [14] Moser BR. Biodiesel production, properties, and feedstocks. Vitr Cell Dev Biol –
Plant 2009.https://doi.org/10.1007/s11627-009-9204-z.
[15] Bessa LCBA, Ferreira MC, Shiozawa S, Batista EAC, Meirelles AJA. Liquid + liquid equilibrium of systems involved in the stepwise ethanolysis of vegetable oils. J Chem Thermodyn 2015.https://doi.org/10.1016/j.jct.2015.04.036.
[16] Carareto NDD, Kimura CYCS, Oliveira EC, Costa MC, Meirelles AJA. Flash points of mixtures containing ethyl esters or ethylic biodiesel and ethanol. Fuel
2012;96:319–26.https://doi.org/10.1016/j.fuel.2012.01.025.
[17] Canapi E, Augustin Y, Moro E, Pedrosa E, Bendaño M. Coconut Oil. Baileys Ind. Oil
type models.
This result was quite surprising due to the fact that UNIFAC Bessa parameters were adjusted specifically f or b iodiesel s ystems, a nd this model had previously provided accurate FP prediction for binary so-lutions involving both Unsaturated and Saturated FAEEs. In fact, the difference b etween U NIFAC B essa’s p redictions i n comparison t o the other UNIFAC type models is lower than 0.9 K in the worst case sce-nario, which is not substantial.
There might be a few reasons as to why UNIFAC Bessa was not capable of improving FP prediction in this case. The main one is related to the characterization of the biodiesels. We did not consider trace amounts (lower than 1% m/m each) of other long chain esters on FP prediction calculations. Therefore, about 2% (m/m) of the composition of each biodiesel in terms of FAEEs was ignored in the calculations. Additionally, the presence of contaminants such as glycerol or ethanol or catalysts was not quantified. Any influence due to glycerol, a high FP contaminant, would not be substantial, although ethanol could affect biodiesel FP even in low concentrations [16]. As interactions between FAEEs tend to be mostly attractive, perhaps considering trace amounts of other esters could have changed the prediction results. In conclusion, we believe that the biodiesel representation in terms of only the four main components might have influenced the UNIFAC Bessa results.
Fat Prod. John Wiley & Sons; 2005.
[18] Marlair G, Rotureau P, Breulet H, Brohez S. Booming development of biofuels for transport: Is fire safety of concern? Fire Mater 2009;33:1–19.https://doi.org/10.
1002/fam.976.
[19] Casson Moreno V, Danzi E, Marmo L, Salzano E, Cozzani V. Major accident hazard in biodiesel production processes. Saf Sci 2019.https://doi.org/10.1016/j.ssci.
2018.12.014.
[20] Calvo Olivares RD, Rivera SS, Núñez Mc Leod JE. Database for accidents and in-cidents in the biodiesel industry. J Loss Prev Process Ind 2014.https://doi.org/10.
1016/j.jlp.2014.03.010.
[21] Hoshino T, Iwata Y, Koseki H. Oxidation stability and risk evaluation of biodiesel. Therm Sci 2007.https://doi.org/10.2298/TSCI0702087H.
[22] Zuleta EC, Baena L, Rios LA, Calderón JA. The oxidative stability of biodiesel and its impact on the deterioration of metallic and polymeric materials: a review. J Braz Chem Soc 2012.https://doi.org/10.1590/S0103-50532012001200004. [23] Dantas MB, Albuquerque AR, Barros AK, Rodrigues Filho MG, Antoniosi Filho NR,
Sinfrônio FSM, et al. Evaluation of the oxidative stability of corn biodiesel. Fuel 2011.https://doi.org/10.1016/j.fuel.2010.09.014.
[24] Demirbas A. Relationships derived from physical properties of vegetable oil and biodiesel fuels. Fuel 2008.https://doi.org/10.1016/j.fuel.2007.08.007. [25] Ramadhas AS, Jayaraj S, Muraleedharan C. Biodiesel production from high FFA
rubber seed oil. Fuel 2005.https://doi.org/10.1016/j.fuel.2004.09.016. [26] Phoon LY, Hashim H, Mat R, Mustaffa AA. Flash point prediction of tailor-made
green diesel blends containing B5 palm oil biodiesel and alcohol. Fuel 2016;175:287–93.https://doi.org/10.1016/j.fuel.2016.02.027.
[27] Álvarez A, Lapuerta M, Agudelo JR. Prediction of flash-point temperature of al-cohol/biodiesel/diesel fuel blends. Ind Eng Chem Res 2019;58:6860–9.https://doi.
org/10.1021/acs.iecr.9b00843.
[28] Dias RM, Aquino RT, Krähenbühl MA, Costa MC. Flash point of fatty acid methyl ester binary mixtures. J Chem Eng Data 2019;64:3465–72.https://doi.org/10.
1021/acs.jced.9b00267.
[29] Paricaud P, Ndjaka A, Catoire L. Prediction of the flash points of multicomponent systems: applications to solvent blends, gasoline, diesel, biodiesels and jet fuels. Fuel 2019:263.https://doi.org/10.1016/j.fuel.2019.116534.
[30] Phoon LY, Mustaffa AA, Hashim H, Mat R. A review of flash point prediction models for flammable liquid mixtures. Ind Eng Chem Res 2014;53:12553–65.https://doi.
org/10.1021/ie501233g.
[31] Sandler SI. Chemical and engineering thermodynamics. Book 1989.
[32] Gmehling J, Rasmussen P. Flash points of flammable liquid mixtures using UNIFAC. Ind Eng Chem Fundam 1982;21:186–8.https://doi.org/10.1021/i100006a016.
[33] Poling BE, Prausnitz JM, O’Connel JP. The properties of gases & liquids. 5th ed.
McGraw-Hill Education; 2001. 10.1016/0894-1777(88)90021-0.
[34] Bessa LCBA, Ferreira MC, Abreu CRA, Batista EAC, Meirelles AJA. A new UNIFAC parameterization for the prediction of liquid-liquid equilibrium of biodiesel sys-tems. Fluid Phase Equilib 2016.https://doi.org/10.1016/j.fluid.2016.05.020. [35] Gmehling J, Lohmann J, Jakob A, Li J, Joh R. A modified UNIFAC (Dortmund)
model. 3. Revision and extension. Ind Eng Chem Res 1998.https://doi.org/10.
1021/ie980347z.
[36] Gmehling J, Li J, Schiller M. A modified UNIFAC Model 2. Present parameter matrix and results for different thermodynamic properties. Ind Eng Chem Res 1993.
https://doi.org/10.1021/ie00013a024.
[37] Wu HS, Sandler SI. Use of ab initio quantum mechanics calculations in group contribution methods. 1. Theory and the basis for group identifications. Ind Eng Chem Res 1991.https://doi.org/10.1021/ie00053a010.
[38] Liaw HJ, Gerbaud V, Li YH. Prediction of miscible mixtures flash-point from UNIFAC group contribution methods. Fluid Phase Equilib 2011;300:70–82.https://
doi.org/10.1016/j.fluid.2010.10.007.
[39] Liaw HJ, Gerbaud V, Wu HT. Flash-point measurements and modeling for ternary
[40] Fredenslund A, Jones RL, Prausnitz JM. Group-contribution estimation of activity coefficients in nonideal liquid mixtures. AIChE J 1975;21:1086–99.https://doi.
org/10.1002/aic.690210607.
[41] Weidlich U, Gmehling J. A modified UNIFAC model 1. Prediction of VLE, hE, and gamma∞. Ind Eng Chem Res 1987;26:1372–81.https://doi.org/10.1021/
ie00067a018.
[42] Catoire L, Naudet V. A unique equation to estimate flash points of selected pure liquids application to the correction of probably erroneous flash point values. J Phys Chem Ref Data 2004;33:1083–111.https://doi.org/10.1063/1.1835321. [43] Liaw HJ, Lee YH, Tang CL, Hsu HH, Liu JH. A mathematical model for predicting
the flash point of binary solutions. J Loss Prev Process Ind 2002;15:429–38.https://
doi.org/10.1016/S0950-4230(02)00068-2.
[44] Pan Y, Cheng J, Song X, Li G, Ding L, Jiang J. Flash points measurements and prediction for binary miscible mixtures. J Loss Prev Process Ind 2015.https://doi.
org/10.1016/j.jlp.2015.01.022.
[45] Ceriani R, Gani R, Liu YA. Prediction of vapor pressure and heats of vaporization of edible oil/fat compounds by group contribution. Fluid Phase Equilib
2013;337:53–9.https://doi.org/10.1016/j.fluid.2012.09.039.
[46] Wang TY, Meng XZ, Jia M, Song XC. Predicting the vapor pressure of fatty acid esters in biodiesel by group contribution method. Fuel Process Technol 2015.
https://doi.org/10.1016/j.fuproc.2014.11.030.
[47] Yuan W, Hansen AC, Zhang Q. Vapor pressure and normal boiling point predictions for pure methyl esters and biodiesel fuels. Fuel 2005.https://doi.org/10.1016/j.
fuel.2005.01.007.
[48] Benziane M, Khimeche K, Mokbel I, Sawaya T, Dahmani A, Jose J. Experimental vapor pressures of five saturated fatty acid ethyl ester (FAEE) components of bio-diesel. J Chem Eng Data 2011;56:4736–40.https://doi.org/10.1021/je200730m. [49] Liaw HJ, Lu WH, Gerbaud V, Chen CC. Flash-point prediction for binary partially
miscible mixtures of flammable solvents. J Hazard Mater 2008;153:1165–75.
https://doi.org/10.1016/j.jhazmat.2007.09.078.
[50] Balasubramonian S, Srivastav RK, Kumar S, Sivakumar D, Sampath M, Kamachi Mudali U, et al. Flash point prediction for the binary mixture of phosphatic solvents and n-dodecane from UNIFAC group contribution model. J Loss Prev Process Ind 2015.https://doi.org/10.1016/j.jlp.2014.12.012.
[51] Catoire L, Paulmier S, Naudet V. Estimation of closed cup flash points of combus-tible solvent blends. J Phys Chem Ref Data 2006;35:9–14.https://doi.org/10.1063/
1.1928236.
[52] Catoire L, Paulmier S, Naudet V. Experimental determination and estimation of closed cup flash points of mixtures of flammable solvents. Process Saf Prog 2006;25:33–9.https://doi.org/10.1002/prs.10112.
[53] Carareto NDD, Costa MC, Meirelles AJA, Pauly J. High pressure solid-liquid equi-librium of fatty acid ethyl esters binary systems. Fluid Phase Equilib 2014.https://
doi.org/10.1016/j.fluid.2014.09.007.
[54] Zhang H, Yin Q, Liu Z, Gong J, Bao Y, Zhang M, et al. An odd-even effect on so-lubility of dicarboxylic acids in organic solvents. J Chem Thermodyn 2014.https://
doi.org/10.1016/j.jct.2014.05.009.
[55] Gunstone FD. Fatty Acid and Lipid Chemistry. 1996. doi:10.1007/978-1-4615-4131-8.
[56] Metin S, Hartel RW. Crystallization of fats and oils. Bailey’s Ind Oil Fat Prod 2005.
https://doi.org/10.1002/047167849x.bio021.
[57] Products P, Principles S. Standard Test Method for Flash Point by Continuously Closed Cup (CCCFP) Tester 1. Annu B ASTM Stand 2011. doi:10.1520/D6450-05R10.Copyright.
[58] ASTM International. ASTM D93-18, Standard Test Methods for Flash Point by Pensky-Martens Closed Cup Tester 2018. doi:10.1520/D0093-18.
partially miscible aqueous-organic mixtures. J Chem Eng Data 2010. https://doi.
Supplementary Data
Flash point prediction with UNIFAC type models of ethylic biodiesel and
binary/ ternary mixtures of FAEEs
Débora Costa do Nascimento
a, Natália Daniele Dorighello Carareto
b, Antonio Marinho Barbosa
Neto
c, Vincent Gerbaud
dand Mariana Conceição da Costa
aa
School of Chemical Engineering (FEQ), University of Campinas (UNICAMP), 13083-852, Campinas,
Sao Paulo, Brazil.
b
Laboratoire des Matériaux Céramiques et Procédés Associés (LMCPA), Université de Valenciennes et
du Hainaut‐Cambrésis, Valenciennes, France.
c
ThermoPhase, Department of Petroleum Engineering, Santa Catarina State University, 88336-275,
Balneário Camboriú, Santa Catarina, Brazil.
d