Open Archive TOULOUSE Archive Ouverte (OATAO)
OATAO is an open access repository that collects the work of Toulouse researchers and
makes it freely available over the web where possible.
This is an author-deposited version published in :
http://oatao.univ-toulouse.fr/
Eprints ID : 19576
To link to this article : DOI:
10.1016/j.fluid.2017.08.019
URL : https://doi.org/10.1016/j.fluid.2017.08.019
To cite this version :
Da Cunha, Sergio and Liaw, Horng-Jang and Gerbaud, Vincent On
the relation between azeotropic behavior and minimum / maximum
flash point occurrences in binary mixtures of flammable
compounds. (2017) Fluid Phase Equilibria, vol. 452. pp. 113-134.
ISSN 0378-3812
Any correspondence concerning this service should be sent to the repository
administrator:
[email protected]
On the relation between azeotropic behavior and minimum /
maximum flash point occurrences in binary mixtures of flammable
compounds
Sergio da Cunha
a, Horng-Jang Liaw
b, Vincent Gerbaud
a,*aUniversit e de Toulouse, INP, UPS, LGC (Laboratoire de G enie Chimique), 4 all ee Emile Monso, F-31432 Toulouse Cedex 04, France
bDepartment of Safety, Health, and Environmental Engineering, National Kaohsiung First University of Science and Technology, 1 University Road, Yanchao, Kaohsiung, Taiwan, ROC
a r t i c l e
i n f o
Article history:
Received 10 February 2017 Received in revised form 30 June 2017
Accepted 23 August 2017 Available online 26 August 2017 Keywords:
Flash point
Vapor liquid equilibrium Azeotrope
Azeotropic conditions Minimum flash point behavior
a b s t r a c t
The flash point temperature and the boiling temperature of a mixture are related by the fact that both can be modeled based on vapor-liquid equilibrium (VLE) of each component. It has been suggested in the literature that there might exist a concomitance between azeotropic behavior and minimum/maximum flash point temperature for binary mixtures. In order to verify this statement, we derive new temper-ature dependent functions that relate the conditions valid for azeotropic behavior and those valid for minimum/maximum flash point behavior. Analysis of experimental data and predicted results allowed us to propose a heuristic to forecast extremum flash point based on the sole knowledge of azeotropic data and boiling and flash point temperatures differences. Extremum flash point might occur when both components are flammable and when the gap between the flash point temperatures of individual components (DT
fp) is of the same order or smaller than the boiling temperature gap (DTb). Hence, we contribute to the assessment of the fire and explosion hazards in binary mixtures eventually presenting a minimum flash point behavior.
©2017 Elsevier B.V. All rights reserved.
1. Introduction
The study of flash point temperature of mixtures plays an important role for the safety in the chemical processes. Several accidents due to fire and explosions[1e3]highlight the importance of an accurate description of the flash point temperature in liquids, including pure compounds and mixtures.
One of the major concerns in these studies is to forecast a minimum flash point mixture, in which the flash point over a composition range is less than those of its components. This kind of behavior is quite dangerous, since the mixture becomes more hazardous than its pure components. And it is not rare to see mixtures presenting such characteristic, especially when it comes to binary combustible mixtures. Previous works[4e13]reported nearly 15 of them to date, as n-octane þ ethanol, methanol þ methyl acrylate, ethylbenzene þ n-propanol, etc.
Since the flash point data available for binary mixtures is quite
scarce, and the experiments to get these data take some time[13], it would be important tofind an easy way to predict minimum flash point in binary mixtures. This kind of behavior is associated with the positive (negative in the case of maximum flash point mixtures) deviation from an ideal solution behavior[4,13].
Many different methods have been previously proposed to compute the flash point of different types of mixtures. The devel-oped methods first concerned flammable miscible mixtures[14]
and were later extended for miscible mixtures with flammable and non-flammable compounds[6,13]. Finally, a model has been developed taking into account partially miscible mixtures
[7,15e17]. Wickey and Chittenden used the flash point indices of stocks to calculate the flash point of petroleum blends[18]. Affens and McLaren developed a model to estimate the flash point of mixtures based on the Raoult's law and Le Chatelier's rule[19,20]. White et al. reduced Affens and McLaren's model by ignoring temperature effect on LFL to estimate the flash point of aviation fuels[21]. Catoire et al. extended their developed empirical equa-tion of estimating pure compounds' flash point to estimate the flash point of mixtures[22]. Gmehling and Rasmussen were the first ones to estimate theflash point by taking into account non-ideality
*Corresponding author.
[14]. The general flash point prediction model for miscible mixtures developed by the authors[6]was reducible for the ones of binary mixtures, either with water or not[4,5]. All the models mentioned were developed for miscible mixtures of flammable solvents, which are relevant to the scope of this study. All these methods, excluding Wickey and Chittenden's and Catoire et al.’s models, consider vapor-liquid equilibrium (VLE) for all components and we keep this hypothesis here with some nuances explained later. Do notice however that non-equilibrium conditions (such as not stirring in the liquid phase) can affect flash point behavior[8]. Nonetheless, this effect has been observed only in partially miscible systems, and such systems are out of the scope of this study.
Such a VLE based approach is similar to the one used to describe distillation curves and boiling temperature surfaces. And since the azeotropic behavior (minimum and maximum) is also associated with deviations from ideal behavior [23,24], a relation between both azeotropes and extremum (minimum/maximum) flash point behaviors has been suggested in previous works[13,25]for several mixtures, such as phenol þ cyclohexanone, n-octane þ 2-propanol, etc.
In this article we explore that concomitance more systemati-cally. The paper is organized as follows: after recalling the flash-point prediction model (section 2), two T-dependent functions are derived relating both extremum azeotropic and flash point behaviors (Section3). By studying these functions together with the available data for binary mixtures flash point, we propose an empirical criterion to predict extremum flash point without further computation (Section 4). Such criterion is based solely on the knowledge of pure component data and azeotropic behavior. Sec-tion5reports experimental materials and methods. The criterion is tested over almost all the available flash point mixture data (Sec-tion 6). Finally, we use this criterion to forecast the flash point behavior of two mixtures. The results are then compared with our experimental data, in order to evaluate the performance and limits of the heuristics.
2. Flash-point prediction model
The model used in this manuscript to predict flash point tem-peratures of flammable mixtures is based on Le Chatelier's rule (1891), which can be written as[20,26].
LFLmix¼
1 PN
iLFLzii
(1)
where LFLmix is the lower flammability limit of the mixture in
volume percent, ziis the molar fraction of component i in the vapor
phase (considering only the combustible species) and LFLiis the
lower flammability limit of pure component i, also in volume percent. Equation(1)can be rewritten as follows:
XN
i
yi
LFLi
¼ 1 (2)
where yi is the molar fraction of compound i in vapor phase
considering all species in equilibrium.
We precise that strictly speaking the flash point phenomena requires air in the vapor phase and one usually neglects its presence in the liquid phase. This consideration is enough to characterize a non-equilibrium condition for the whole system, since the chemi-cal potentials of the air are not the same in both phases. Even so, we assume that near “vapor-liquid equilibrium” conditions hold for all the other components i. Hence, they are considered to have the same chemical potential in both phases and we can rewrite equa-tion(2)as: X i xi
g
iðx; TÞPisatðTÞ Psat i;fp ¼ 1 (3)where xiis the molar fraction of component i in the liquid phase,
g
iis its activity coefficient, Psat
i ðTÞ is the saturation pressure at
tem-perature T and x is the vector of molar fractions in the liquid phase. Equation(3)is known as Liaw's equation. It can be modified in the case of the presence of a non-flammable compound (as water, for example). In this case one can ignore non-flammable compo-nents in equation(3)and rewrite it as:
X isk xi
g
iðx; TÞPisatðTÞ Psat i;fp ¼ 1 (4)where k refers to the non-flammable compounds in the mixture[6]. A more detailed review on flash point prediction models for pure components and mixtures is available in Vidal et al.[27]and Liu and Liu[28].
Several models are available to estimate the activity coefficient in eqs.(3) and (4), such as UNIFAC, UNIFAC Dortmund 93, NRTL, Wilson, UNIQUAC, etc. Once we choose the model, it is possible to compute the flash point temperature at a given composition by solving recursively for T equation(3) or (4) [13]. An assessment on the main activity coefficient models, including their limitations, is available in Kontogeorgis and Folas[29].
3. Sufficient conditions for extremum behavior in binary mixtures
3.1. The condition for minimum/maximum azeotrope
An azeotropic behavior occurs in a VLE diagram when a mix-ture's composition in the liquid phase is the same as the one in the vapor phase for a given pressure and temperature.
For a binary mixture, the azeotropic point has to satisfy:
x1¼ y1;x2¼ y2 (5)
This condition can also be presented in terms of the distribution Nomenclature
Tfp Flash point temperature
D
Tfp Flash point temperature gap ð"""T1;fp$ T2;fp " " "Þ Tb Boiling temperature
D
Tb Boiling temperature gap ð""T1;b$ T2;b
" "Þ LFL Lower flammability limit
yi Molar fraction of compound i in the vapor phase
xi Molar fraction of compound i in the liquid phase
g
i Activity coefficient of compound iPsat
i Saturation vapor pressure of compound i for a given
temperature Psat
i;fp Saturation vapor pressure of compound i at its flash
point temperature MinFP Minimum flash point MaxFP Maximum flash point MinBP Minimum boiling point MaxBP Maximum boiling point MinFPB Minimum flash point behavior
coefficient Ki¼ yi=xi. Equation(5)is now written as:
K1¼ 1 ; K2¼ 1 (6)
We can see from the above definition of the distribution coef-ficient that Kiis not defined when xi¼ yi¼ 0. However, at the limit
xi/0 for isobaric distillation:
lim xi/0 yi xi¼ limxi/0 xi
g
iPsati Pxi 0 0Kijxi¼0¼g
∞i Pisat""T j;b P (7)where
g
∞i represents the activity coefficient of i at an infinitedilution in j, and Tj; bis the boiling temperature of component j.
By using the distribution coefficient, it is possible to write suf-ficient conditions to forecast an isobaric azeotrope in binary mix-tures. These well-known conditions are[23,24].
K1jx1¼0>1 ; K2jx1¼1>1 ðminimum azeotropeÞ (8)
K1jx1¼0<1 ; K2jx1¼1<1 ðmaximum azeotropeÞ (9)
TheFig. 1below, extracted from Kiva et al., 2003[30], describes graphically the conditions presented above.
In the above Figure, the horizontal axis represents the molar fraction of component 1 in the liquid phase. Plots (1), (10), (2) and
(20) concern mixtures that do not show azeotropic behavior, as eq. (6)is never valid. The graphics (30), and (40) represent maximum
azeotrope mixtures, as predicted by equation(9). Also, plots (3) and (4) represent minimum azeotropes predicted by equation(8). One can see from plot number (5) that equations(8) and (9) fail to forecast double azeotropes. However, this kind of behavior is quite rare and has been reported for the hexafluorobenzene þ benzene mixture[31,32]and a few others (seeFig. 1).
3.2. The condition for minimum/maximum flash point
A sufficient condition for minimum/maximum flash points in binary mixtures has been proposed and verified with experimental data in previous works[33,34]. A minimum flash point occurs if flash point temperature decreases in the vicinity of x1¼ 0 and
in-creases near x1¼ 1 (seeFig. 2). Inversely, a maximum flash point
occurs when the temperature increases around x1¼ 0 and
de-creases near x1¼ 1. Using dT dx1 " " " "x 1¼0 <0 ðresp: > 0Þ and dT dx1 " " " "x 1¼1 >0 ðresp: < 0Þ, Liaw et al.[33,34]derived the following expressions, based on Liaw's model[4], as sufficient conditions for minimum (resp. maximum) flash point mixtures:
g
∞ 1P1sat " "T 2;fp Psat 1;fp >1 ;g
∞ 2Psat2 " "T 1;fp Psat 2;fp >1 ðminimum fpÞ (10)g
∞1P1sat""T 2;fp Psat 1;fp <1 ;g
∞ 2Psat2 " "T 1;fp Psat 2;fp <1 ðmaximum fpÞ (11)According to literature, Liaw's model, which was used in deriving above sufficient condition, is more reliable than other vapor-pressure-based models[35], and is the only one to predict the occurrence of minimum/maximum flash point behavior of mixtures correctly[28].
The above criteria is as reliable as the thermodynamic model
and data used to describe the mixture. In other words, wrong predictions coming from eqs.(10) and (11) may be related to: (i) inaccuracy of the activity coefficient model regarding the target mixture; (ii) poor estimation of the saturation pressures, due for example to a short temperature-domain of validity of the Antoine coefficients; (iii) inaccurate data for individual flash point temperatures.
Equations(10) and (11) for flash point extrema are quite similar to equations(8) and (9) for azeotropes. Indeed, by rewriting (8) and (9) in terms of
g
and Psat(using eq.(7)), we get:g
∞ 1Psat1 " "T 2;b P >1 ;g
∞ 2Psat2 " "T 1;b P >1 ðminimum bpÞ (12)g
∞ 1Psat1 " "T 2;b P <1 ;g
∞ 2Psat2 " "T 1;b P <1 ðmaximum bpÞ (13) Notice the fp or b subscript differences to identify quickly the equations corresponding to flash point or boiling point extremum behavior in this paper.4. Mathematical formulation e the equations associating both conditions
The similarity between the conditions to form azeotropes (eqs.
(12) and (13)) and minimum/maximum flash points (eqs.(10) and (11)) is remarkable. Indeed, it is possible to rewrite these conditions in terms of the same functions. Let us define two new functions, f1
and f2, as follows: f1ðTÞ ¼
g
∞1ðTÞP1satðTÞ Psat 1;fp ; f2ðTÞ ¼g
∞2ðTÞP2satðTÞ Psat 2;fp (14)By substitution in equations (10)e(13), it is now possible to rewrite them in terms of f1and f2applied either at T ¼ Ti;bor at
T ¼ Ti;fp, as follows: f1jT2;b> P Psat 1;fp ; f2jT1;b> P Psat 2;fp ðminimum bpÞ (15) f1jT2;b< P Psat 1;fp ; f2jT1;b< P Psat 2;fp ðmaximum bpÞ (16) f1jT2;fp>1 ; f2jT1;fp>1 ðminimum fpÞ (17) f1jT2;fp<1 ; f2jT1;fp<1 ðmaximum fpÞ (18)
The relation between an azeotropic behavior and an extremum flash point behavior can be better understood by studying equa-tions(15)e(18).
5. Materials and methods 5.1. Pure compounds data
Flash point and boiling point of each individual component, as well as its Antoine coefficients (for calculating the vapor pressure in f1 and f2 expressions), were extracted from different sources in
order to plot f1and f2, as indicated inTable 1.
For each mixture, it was verified if the UNIFAC Dortmund 93 model predicts satisfactorily the azeotropic behavior reported in the literature (seeTable 3). Other activity coefficient models could be used and they might better predict experimental data with the
help of binary interaction parameters. Our current choice of a predictive model suits the heuristics we would like to establish.
5.2. Flash point measurement
The flash point of binary mixtures were measured by the flash point analyzer, HFP 362-Tag, which was made by Walter Herzog GmbH, Germany, and meets the requirement of ASTM D56[42]. The
operation of the instrument was according to ASTM D56, which is a close cup method. The detailed operational parameters were described in previous studies[3e8,15,16,25,33,43]. The flash point value of each composition was the average one, measured more than ten times.
Acetone (99.5%), heptane (99%), ethanol (99.9%) and ethyl ace-tate (99.9%) were purched from J.T. Baker (USA). Octane (99%) and decane (99%) were from Applichem Panreac (Germany) and Alfa Aesar (USA), respectively.
6. Results and discussion
6.1. Application of the thermodynamic criterion for three different mixtures
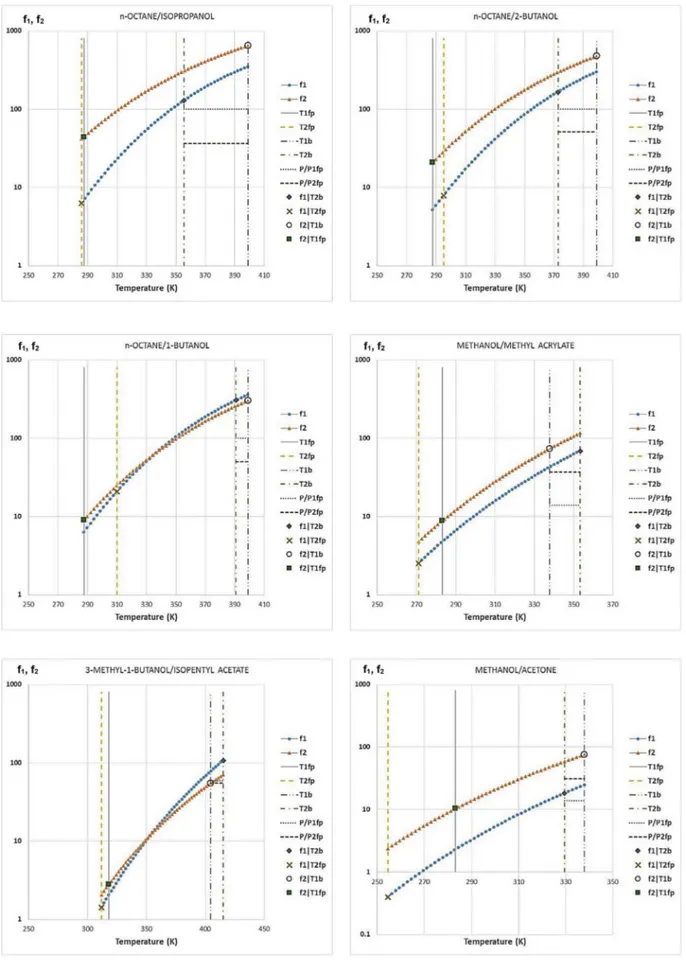
The plots of f1 and f2 for different mixtures are shown in
ap-pendix A. They were made by using the group contribution method UNIFAC Dortmund 93 for calculation of the activity coefficients within the software environment offered by Simulis Thermody-namics®
in Excel[44].
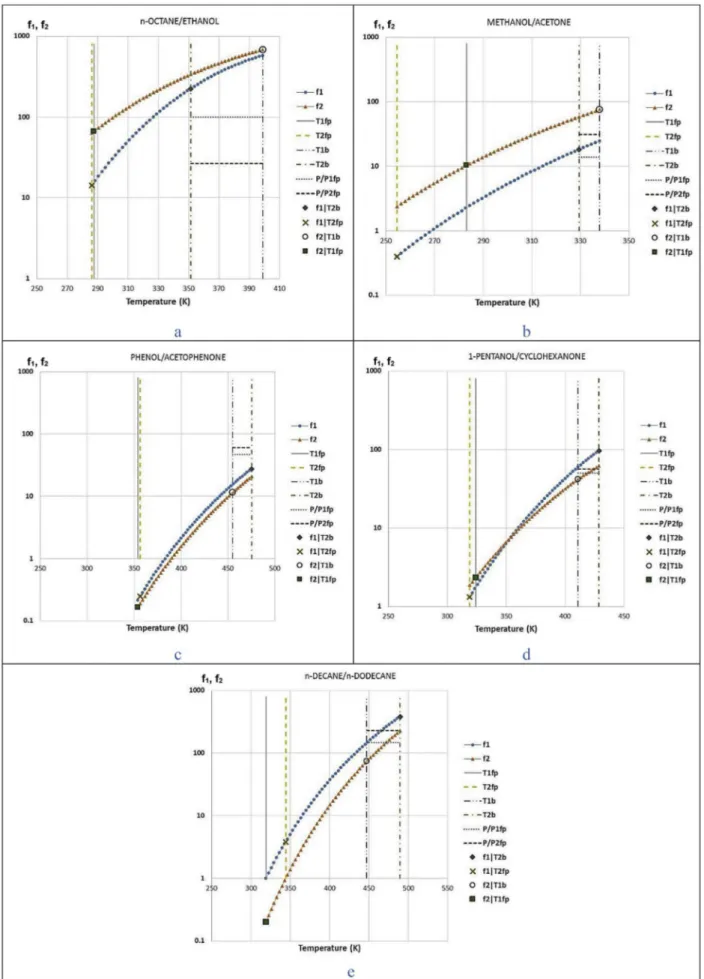
For the sake of illustration, let us study a few examples.Fig. 3
shows the functions f1and f2drawn for five different mixtures.
We know from available sources [4,13,33,45] that mixture n-octane þ ethanol inFig. 3a presents both minimum azeotropic and minimum flash point behavior. We explain now how to infer it from the plot inFig. 3a.
First, we remark the intersection between f1 ( ) and the
vertical T2;b line ( ). This point corresponds to f1jT2;b, and it is
located above the dotted line P Psat
1;fp
( ). Hence one can conclude that f1jT2;b>
P Psat
1;fp, and so the first condition for azeotrope in equation
(15)is satisfied. Analogously, the intersection between f2( ) and
the vertical T1;bline ( ) above the horizontal dashed line ( ) corresponds to the condition f2jT1;b>
P Psat
2;fp
. And so, since both condi-tions in eq.(15)are satisfied, one can conclude that this mixture
Fig. 1. Distribution coefficients. (reprinted with permission from Fig. 30 in Kiva et al., 2003[30]. Copyright 2003 Elsevier.)
Fig. 2. Minimum flash point behavior for methyl acrylate (1) þ methanol (2), reprinted with permission fromFig. 3in Liaw et al., 2003[33]. Copyright 2003 Elsevier.
Table 1
Data of pure compounds.
Compound Flash point Tfp Antoine coef.a,b Boiling point Tbpc
n-octane 14.5'C [13] A ¼ 96.084 B ¼ $7900.2 C ¼ $11.003 D ¼ 7.1802E-6 E ¼ 2 125.68'C ethanol 13'C [13] A ¼ 73.304 B ¼ $7122.3 C ¼ $7.1424 D ¼ 2.8853E-6 E ¼ 2 78.29'C 2-butanol 22'C [13] A ¼ 105.64 B ¼ $9401.9 C ¼ $11.641 D ¼ 1.2635E-6 E ¼ 6 99.55'C 2-propanol 12.9'C [13] A ¼ 76.43 B ¼ $7607 C ¼ $7.4086 D ¼ 4.3986E-18 E ¼ 6 82.26'C 1-butanol 36.9'C [13] A ¼ 107.09 B ¼ $9914.7 C ¼ $11.768 D ¼ 1.0925E-17 E ¼ 6 117.66'C methanol 10'C [13] A ¼ 82.718 B ¼ $6904.5 C ¼ $8.8622 D ¼ 7.4664E-6 E ¼ 2 64.7'C methyl acrylate $2.1'C [13] A ¼ 107.69 B ¼ $7027.2 C ¼ $13.916 D ¼ $0.015185 E ¼ 1 80.2'C 3-methyl-1-butanol 44.9'C [13] A ¼ 107.02 B ¼ $10237 C ¼ $11.695 D ¼ 6.8003E-18 E ¼ 6 131.2'C isopentyl acetate 38.8'C [13] A ¼ 99.558 B ¼ $8876.8 C ¼ $11.075 D ¼ 2.4723E-17 E ¼ 6 142'C acetone $18.6'C [7] A ¼ 69.006 B ¼ $5599.6 C ¼ $7.0985 D ¼ 6.2237E-6 E ¼ 2 56.29'C methyl acetate $14.4'C [13] A ¼ 61.267 B ¼ $5618.6 C ¼ $5.6473 D ¼ 2.108E-17 E ¼ 6 56.94'C n-heptane $5.2'C [13] A ¼ 87.829 B ¼ $6996.4 C ¼ $9.8802 D ¼ 7.2099E-6 E ¼ 2 98.43'C phenol 81'C [34] A ¼ 95.444 B ¼ $10113 C ¼ $10.09 D ¼ 6.7603E-18 E ¼ 6 181.84'C acetophenone 83.5'C [34] A ¼ 64.239 B ¼ $8173.9 C ¼ $5.7673 D ¼ 2.6743E-18 E ¼ 6 202.11'C cyclohexanone 46'C [34] A ¼ 85.424 B ¼ $7944.4 C ¼ $9.2862 155.43'C
Table 1 (continued )
Compound Flash point Tfp Antoine coef.a,b Boiling point Tbpc
D ¼ 4.9957E-6 E ¼ 2 cyclohexanol 68.5'C [34] A ¼ 189.19 B ¼ $14337 C ¼ $24.148 D ¼ 1.074E-5 E ¼ 2 160.85'C 1-propanol 21.5'C [5] A ¼ 94.126 B ¼ $8604.8 C ¼ $10.11 D ¼ 3.1334E-6 E ¼ 2 97.2'C ethyl hexanoate 57.55'C [36] A ¼ 16.675 B ¼ 3399 C ¼ $80.95 166'C [37] ethyl laurate 126.85'C [36] A ¼ 10.9743 B ¼ 1392.1779 C ¼ $258.9533 269'C [37] ethyl tetradecanoate 150.85'C [36] A ¼ 12.1979 B ¼ 1847.2703 C ¼ $259.4646 295'C [37] ethyl palmitate 160.85'C [36] A ¼ 15.7216 B ¼ 3690.0998 C ¼ $194.6189 378'C [37] ethyl oleate 153.85'C [36] A ¼ 14.0085 B ¼ 2724.21 C ¼ $252.243 331.52'C [37] ethyl linoleate 155.85'C [36] A ¼ 20.543 B ¼ 6837 C ¼ $111.8136 319.16'C [37] toluene 5.56'C [14] A ¼ 76.945 B ¼ $6729.8 C ¼ $8.179 D ¼ 5.3017E-6 E ¼ 2 110.63'C 4-methylpyridine 42.5'C [34] A ¼ 90.839 B ¼ $8013.6 C ¼ $10.096 D ¼ 5.7026E-6 E ¼ 2 145.35'C cyclohexylamine 28'C [34] A ¼ 149.08 B ¼ $9336.7 C ¼ $20.524 D ¼ 0.021378 E ¼ 1 134.5'C propanal $26'C [34] A ¼ 80.581 B ¼ $5896.1 C ¼ $8.9301 D ¼ 8.2236E-6 E ¼ 2 48'C
methyl ethyl ketone $6'C
[34] A ¼ 72.698 B ¼ $6143.6 C ¼ $7.5779 D ¼ 5.6476E-6 E ¼ 2 79.64'C propionic acid 56.6'C [10] A ¼ 54.552 B ¼ $7149.4 C ¼ $4.2769 D ¼ 1.1843E-18 E ¼ 6 141.17'C p-xylene 25'C [10] A ¼ 88.72 B ¼ $7741.2 C ¼ $9.8693 D ¼ 6.077E-6 E ¼ 2 138.36'C n-decane 46'C [37] A ¼ 112.73 B ¼ $9749.6 C ¼ $13.245 D ¼ 7.1266E-6 E ¼ 2 174.155'C n-dodecane 71'C [37] A ¼ 137.47 B ¼ $11976 C ¼ $16.698 D ¼ 8.0906E-6 E ¼ 2 216.323'C
will present a minimum azeotrope.
Now for the minimum flash point behavior. The intersection between f1and the vertical line T2;fp( ) takes place above the
ordinate equals 1 line. This results in f1jT2;fp>1. Similarly, since f2
crosses the T1;fp line ( ) above the ordinate equals 1 line, we conclude that f2jT1;fp
>1. Hence, the model forecasts a minimum flash point behavior.
But how could the minimum flash point be inferred in a simpler way? The answer relies in both azeotropic behavior and a short gap between flash point temperatures.
Mixtures presenting a minimum azeotropic behavior have positive interactions in the liquid phase (
g
1>1;g
2>1). If wesup-pose that these positive interactions will be maintained at the vi-cinity of the flash point temperature of the pure components, we can write from equations(14), (18) and (19):
f1jT1;fp¼
g
∞ 1 # T ¼ T1;fp$Psat 1 # T ¼ T1;fp$ Psat 1;fp ¼g
∞1 " "T 1;fp >1 (19) f2jT2;fp¼g
∞ 2 # T ¼ T2;fp $ Psat 2 # T ¼ T2;fp $ Psat 2;fp ¼g
∞2""T 2;fp >1 (20)A careful check at the subscript shows that this is not equivalent to equation(17)criterion and does not yet proves a minimum flash
point behavior.
Assuming that T2;fp<T1;fp, and since both f1and f2are strictly
increasing functions, f2jT2;fp>1 implies f2jT1;fp>1. Hence, the
crite-rion in eq. (17) concerning both f1jT2;fp
>1 and f2j
T1;fp
>1 can be reduced to f1jT2;fp>1.
Then, supposing that the gap""
"T2;fp$ T1;fp " "
"is quite small (as in the mixture shown inFig. 3a), one can roughly state that f1 will
have similar values at T ¼ T2;fp and at T ¼ T1;fp (see Fig. 3a). Therefore, excluding particular cases where f1jT1;fpz1:
f1jT2;fpyf1jT1;fp>1
So, we conclude that the mixture satisfies the reduced eq.(17)
and so presents a minimum flash point.
Table 1 (continued )
Compound Flash point Tfp Antoine coef.a,b Boiling point Tbpc
1-pentanol 51'C [38] A ¼ 162.64 B ¼ $12413 C ¼ $20.383 D ¼ 1.0482E-5 E ¼ 2 137.7'C 1,2,3,4-tetrahydronaphtalene 72.5'C [12] A ¼ 137.23 B ¼ $10620 C ¼ $17.908 D ¼ 0.014506 E ¼ 1 207.62'C acetic acid 40.5'C [38] A ¼ 53.27 B ¼ $6304.5 C ¼ $4.2985 D ¼ 8.8865E-18 E ¼ 6 117.9'C 1-hexanol 64'C [38] A ¼ 125.08 B ¼ $11692 C ¼ $14.258 D ¼ 1.1102E-17 E ¼ 6 157.4'C cyclohexane $18'C [37] A ¼ 51.087 B ¼ $5226.4 C ¼ $4.2278 D ¼ 9.7554E-18 E ¼ 6 80.72'C m-xylene 25'C [37] A ¼ 85.099 B ¼ $7615.9 C ¼ $9.3072 D ¼ 5.5643E-6 E ¼ 2 139.12'C 2-methyl-1-propanol 28'C [37] A ¼ 121.78 B ¼ $10504 C ¼ $13.921 D ¼ 1.6898E-17 E ¼ 6 107.66'C
a Formulation with five parameters: lnðPsatÞ ¼ A þB
Tþ C lnðTÞ þ DTE, with pressure Psatin Pa and temperature T in Kelvins and parameters from DIPPR[39]. b Formulation with three parameters: Antoine's law: lnðPsatÞ ¼ A $ B
TþC, with pressure Psatin mmHg and temperature T in Kelvins and parameters from Silva et al., 2011[40] except for ethyl hexanoate from Ref.[41]. N.B.: for Silva et al., 2011[40], Antoine coefficients do not fit well for all temperature range.
c From DIPPR[39]except when another reference is given.
Table 2
Possible combinations of azeotropic and extreme flash point behaviors.
Possible combinations Corresponding figure
MinBP and MinFP 3a
MinBP and non-extreme flash point 3b
MaxBP and MaxFP 3c
MaxBP and non-extreme flash point e
Non-azeotropic and MinFP 3d
Non-azeotropic and non-extreme flash point 3e
Table 3
A second example is hereafter analyzed, concerning the methanol-acetone mixture (Fig. 3b) with a significantly larger gap "
"
"T2;fp$ T1;fp " "
". This mixture exhibits a minimum azeotropic behavior
[45]without presenting a minimum flash point[13,46].
One can see inFig. 3b that the conditions are met for a minimum azeotrope (f1intersecting the T2;bline above the P=P1;fpline and f2
intersecting T1;bline above P=P2;fpline). However, the conditions for
minimum flash point are not met as f1jT2;fpis smaller than unity. A
possible explanation relies on the large gap""
"T2;fp$ T1;fp " "
", which is equal to 28.8'C in this case. As in the example fromFig. 3, one can
state for the methanol þ acetone mixture: f1jT1;fp>1
f2jT2;fp>1
As mentioned above, since T2;fp<T1;fp and both f1 and f2 are
strictly increasing functions, f2jT2;fp>1 implies f2jT1;fp>1. And so
criterion in eq.(17)is again reduced to: f1jT2;fp
>1.
However, since the gap between both flash point temperatures is high, f1(which values more than 1 at T1;fp) decreases from right to
left, and eventually will become smaller than 1 before crossing the T2;fpline. So there is no minimum flash point behavior.
A third example is discussed next, for the phenol-acetophenone mixture (Fig. 3c). This mixture is reported to present a maximum azeotropic point[45]and a maximum flash point[13,34]as well. And one can conclude both by analyzing the plot. Indeed, f1
inter-secting T2;bline below the P=P1;fpline and f2intersecting T1;bline
below the P=P2;fpline are signs of maximum azeotrope.
Besides, one can also see from the plot that both conditions from eq.(18)are met, which implies a maximum flash point behavior. We can transpose the reasoning made for the n-octane e ethanol mixture to prove the extremum flash point behavior:
Maximum azeotropes are due to a negative deviation from ideality, characterized by
g
1<1 andg
2<1. Assuming that thisbehavior is also present at the vicinities of the flash point tem-peratures of each component, one can write:
f1jT1;fp¼
g
∞1 # T ¼ T1;fp$Psat 1 # T ¼ T1;fp$ Psat 1;fp ¼g
∞1""T 1;fp <1 f2jT2;fp¼g
∞2 # T ¼ T2;fp$Psat 2 # T ¼ T2;fp$ Psat 2;fp ¼g
∞2""T 2;fp <1Again, since T1;fp<T2;fpand both f1and f2are strictly increasing
functions, f2jT2;fp<1 implies f2jT1;fp<1. Hence, the criterion in eq.(18)
becomes: f1jT2;fp
<1.
In our example, the gap between flash point temperatures of the pure components is quite small, so that we can state excluding particular cases where f1jT1;fpz1 (seeFig. 5):
f1jT2;fpyf1jT1;fp<1
Here again we see the role of the small
D
Tfpgap on the flash pointbehavior of the mixture. The two remaining mixtures inFig. 3 (1-pentanol þ cyclohexanone and n-decane þ n-dodecane) corre-spond to a azeotropic mixture presenting a MinFPB and a non-azeotropic mixture without an extreme flash point behavior, respectively.Table 2summarizes the different configurations of f1
and f2according to mixture behaviors.
Note thatTable 2does not have corresponding figures for two cases: MaxBP þ non-extreme flash point and non-azeotropic þ MaxFP. Such combinations might exist, but they are not observed in any of the 45 mixtures selected in this study (Table 3).
6.2. Analysis of literature data and proposal of a heuristic to forecast flash point extreme behavior
From the prediction of extremum behaviors by f1 and f2,
together with the available data for flash point and VLE diagrams in the literature, we have compiledTable 3. This table gathers results for 45 binary mixtures. The presence of azeotropes/extremum flash point regards isobaric evaluations at atmospheric pressure. All the predictions have been made based on UNIFAC Dortmund 93 model, except for the mixture of p-xylene þ m-xylene. F, where Wilson model has been applied to represent that special mixture where both components have the same boiling point.
Lines A, B, C, D,
D
TfpandD
Tbreport experimental observationsand data. Lines “eq.(15)” and “eq.(16)” relative to predicted Min. (or Max) Boiling point, indicate whether functions f1and f2predict
a minimum (maximum) azeotrope. If they do so, the field's value is T (True). If they do not, then it is F (False). Lines “eq.(17)” and “eq.
(18)” are similar to lines “eq.(15)” and “eq.(16)” but relative to flash point.
The line (“is A≡? B”) is True (T) when the mixture presents both a minimum azeotrope and a minimum flash point, or when it does not present neither a minimum azeotrope nor a minimum flash point. The same reasoning has been used for the field “is C≡? D” in with respect to maximum temperature behavior. If our assumption is valid (and so minima or maxima for boiling point and flash point are related), lines “is A≡? B” and “is C≡? D” should a priori be a True (T) value. When the mixture presents one minimum behavior without presenting the other (as in the case of methanol þ acetone, 1-pentanol þ cyclohexanone, etc.), its value is False (F) and the cell is colored in red.
The light yellow colored fields with bold font in lines “eq.(17)” and “eq.(18)” indicate that our model gives a wrong prediction of the Min. (or Max) flash point occurrence, as for the mixture phenol þ cyclohexanone. The model with f1and f2works fine but
there are four cases of wrong extreme flash point prediction highlighted: phenol þ cyclohexanone (maximum FP not predicted), acetic acid þ 1-pentanol, acetic acid þ cyclohexanone and p-xylene þ m-p-xylene (no extremum FP reported but the model pre-dicts one). Let's examine them.
The behavior of the mixture p-xylene þ m-xylene has been predicted using the Wilson model instead of UNIFAC Dortmund 93, with parameters taken from Kato et al.[47]. A group contribution model such as UNIFAC is not suggested for this case since both compounds are described with the same organic groups and group interactions. As shown inTable 3, an extreme flash point was pre-dicted using eq. (10) with Wilson model for the mixture p-xylene þ m-p-xylene, with the individual flash point temperatures considered at first equal for both xylenes (Table 1). However, a closer analysis shows that the predicted minimum flash point temperature is only 0.03'C lower than the individual flash point
temperatures. Such a marginal difference might be attributed to the slight non-ideality predicted by the model in the mixture but it remains questionable. Therefore, since no experimental flash point data of p-xylene þ m-xylene were reported in literature from our literature review, new experimental data tested in this study are displayed inFig. 4. First, they do not exhibit any extreme flash point
behavior and we may update lines B and D inTable 3. Second, the pure component p-xylene and m-xylene FP measurements in the literature[10] (Table 1) report a value of 25 'C where we have
measured 28.5'C and 29.2'C for p-xylene and m-xylene
respec-tively. With these new values, the Wilson and UNIFAC-Dortmund models shown in Fig. 4 predicts no extremum flash point, and Wilson-based prediction also demonstrated nearly ideality for p-xylene þ m-p-xylene.
For the mixtures acetic acid þ 1-pentanol and acetic acid þ cyclohexanone, the UNIFAC Dortmund 93 model fails to predict the non-extremum flash point behavior. Indeed, it predicts a strong positive deviation from ideal behavior for both mixtures, while the experimental data in Moghaddam et al., 2012 [38]
indicates a negative deviation. If we switch to the original UNIFAC model, we still predict a positive deviation for these mixtures but much smaller, and we do not forecast extreme flash point behavior, as shown in the Figures below. This shows the limit of the model with f1 and f2that is used with a predictive activity coefficient
model which extrapolation power is not absolute. One possible reason for the differences between the experimental data and the predictions is the strong association of acetic acid that takes place in the vapor phase. This phenomenon has been verified experi-mentally over a wide range of temperature encompassing the flash point range measured[54]. It can be described by the chemical theory by considering either dimerization only or higher order association schemes detailed in Ref.[54]. It indicates that the vapor phase deviates from its ideal behavior, and thus eqs.(3) and (4), which rely upon this hypothesis, are no longer valid. Inclusion of the dimerization is out of the present contribution.
The plots inFig. 5have been generated based on the Antoine coefficients available in Poling et al., 2001[55]. The individual flash point temperatures were taken fromTable 1.
Finally, the UNIFAC Dortmund 93 model fails to predict the maximum flash point behavior for the mixture phenol þ cyclohexanone. This model actually predicts the mixture as being barely to exhibit MaxFPB. But, the maximum flash point can be correctly forecasted if we switch to other activity coefficient models like NRTL, Wilson or UNIQUAC[34].
From the above discussion regarding the three mixtures in
Figs. 4 and 5, it is evident that predictions of extreme flash point behavior are sensitive to the individual flash point data and the activity coefficient model chosen. In order to minimize inaccura-cies, the selection of the source of individual flash point data should be made carefully. Because of repeatability and reproducibility, the measured values of flash point will be different and it is suggested to take the average value. As exemplified by the xylenes mixture, it is suggested to re-test the flash point values if the flash point gap between components is small, such as less than 1'C.
As for the activity coefficient model, models using parameters fitted on experimental VLE data should be prioritized to group-contribution methods, likely to be used when no VLE data is available. Even so, the use of the group-contribution UNIFAC Dortmund 93 model is justified in this work because we dealt with
Fig. 4. Experimental flash point data for p-xylene þ m-xylene with predictions based on Wilson model (dashed line) and UNIFAC Dortmund model (solid line).
Acetic acid + 1-pentanol
(a)
Acetic acid + cyclohexanone
(b)
a large number of binary mixtures and the group-contribution method made it possible to use the same model for all the mixtures. Noorollahy et al.’s data [11] indicated that the mixture n-octane þ n-decane presents a minimum flash point behavior. However, the fact that two linear hydrocarbons present such de-viation from ideality surprised the authors. Therefore, the flash point data of n-octane þ n-decane were re-tested. Our experi-mental data and the prediction curve indicated that octane þ n-decane did not exhibit minimum flash point behavior (Fig. 6).
The fields “
D
Tfp” and “D
Tb” are the absolute differences betweenthe pure component flash point temperatures""
"T1;fp$ T2;fp " " "and the pure component boiling point temperatures "
"T1;b$ T2;b
" ", respectively.
From the example inFig. 3a, we concluded that it should be sufficient for a minimum azeotrope mixture to exhibit a small flash point gap (
D
Tfp) in order to guarantee a minimum flash pointbehavior. But how small should be this gap?Table 3provides an answer.
The flash point gap in the mixture 1-hexanol þ cyclohexanone is slightly smaller (19'C) if compared with the n-octane þ 1-butanol
flash point gap (22.4'C). Both mixtures present a minimum
azeo-trope. However, the second mixture presents a minimum flash point behavior, while the first one does not. To explain it, we must take into account the boiling point gap (
D
Tb) of the components,2'C and 8'C, respectively.
It has been noticed that the higher is the boiling point gap, the more unlikely is for a mixture to present an azeotropic behavior
[56]. Indeed, mixtures with large
D
Tbhave to present very strong positive deviations from ideal mixtures in order to exhibit azeo-tropes. But the stronger this deviation, the more likely is that the mixture will present minimum flash point behavior, even for largeD
Tfp. In other words, azeotropic mixtures with large enough boiling point gaps may present minimum flash point behavior even if the flash point gaps are large.This suggests that, instead of creating a criterion based solely on
D
Tfp, we should seek for one based on the ratioD
Tfp=D
Tb(last line inTable 3). Looking again to Table 3, one can see that the three
minimum azeotropes mixtures not presenting a minimum flash point (methanol þ acetone, methanol þ methyl acetate and 1-hexanol þ cyclohexanone) have a ratio
D
Tfp=D
Tb higher than 3. This fact reinforces the authors' idea and drives the reasoning to-wards an empirical criterion based onD
Tfp=D
Tb to guarantee anextremum flash point behavior based on the azeotropic behavior. Now, one should be careful to drive conclusion for mixtures presenting very small flash point and boiling point temperature gaps (
D
Tfpz0 andD
Tbz0) since experimental errors might be of the same order or higher than the gaps themselves. This could greatly affect the computation of the ratioDTfpDTb, and perhaps driving
the user to a wrong conclusion.
Note that mixture 2-methyl-1-propanol þ toluene is a mini-mum azeotrope with a large
D
Tfp=D
Tbratio (7.556). However,ex-periments show this mixture presents minimum flash point behavior. Thus, it is not guaranteed that azeotropic mixtures with large
D
Tfp=D
Tbwill be free from extremum flash point behavior. Itseems that a large value of
D
Tfp=D
Tbis a necessary, but notsuffi-cient, condition for a minimum azeotrope not to exhibit MinFPB. The next question to be answered is: when a non-azeotropic mixture will present minimum flash point behavior?
We know that for a mixture to present minimum flash point, it has to have a positive deviation from ideality. However, mixtures with positive deviation from ideality shall not present azeotropic behavior if their boiling point gap is too large. So a mixture with positive deviation and high boiling point gap relative to its flash point gap (conversely a small
D
Tfp=D
Tb) could present minimumflash point without presenting an azeotropic behavior. Again, the ratio
D
Tfp=D
Tbseems to be a good criterion for study.Non-azeotropic mixtures presenting small
D
Tfp=D
Tb ratioshould be experimentally tested for flash point. We cannot affirm that these mixtures will not present extremum flash point behavior, as we can see from 1-pentanol þ cyclohexanone % DTfp DTb ¼ 0:341 & , 1-pentanol þ 1,2,3,4-tetrahydronaphthalene % DTfp DTb ¼ 0:308 &
and 1-propanol þ n-decane %
DTfp
DTb ¼ 0:318
& . Finally, all maximum azeotropes showed inTable 3present a maximum flash point behavior and vice-versa. The ratio between flash point and boiling point gaps for these mixtures are comprised between 0.123 and 1.325, reinforcing the idea that azeotropes with small
D
Tfp=D
Tbpratios will present extremum flash point behavior.This said, a first empirical criterion to forecast extremum flash point behaviors is proposed here. It is based on flash point and boiling point temperature gaps, and on the azeotropic data of the mixture (Fig. 7).
6.3. Forecasting flash point behavior from heuristic: verification and limits
To confirm this criterion, we tried to forecast the flash point behavior for two different mixtures: ethyl acetate þ ethanol and acetone þ n-heptane. The two mixtures present minimum azeo-tropes. The ratiosDTfp
DTp value, respectively, 17.0 and 0.3 (flash points
and boiling points taken from Alfa Aesar[34]database). Hence, we expect that acetone þ n-heptane (small ratio) will present mini-mum flash point behavior, while the mixture ethyl acetate þ ethanol might not do so.
The experimental flash point diagrams for these two mixtures are presented below:
InFigs. 8 and 9the solid lines correspond to the UNIFAC Dort-mund model, while the dashed lines correspond to the original UNIFAC model. The white squares represent the experimental data. Our empirical model predicts correctly the minimum flash point behavior for the acetone þ n-heptane mixture. For the other mixture, the empirical criterion is not conclusive
% DTfp DTeb >1 & , and so we cannot be sure about a minimum flash point behavior.
The experiments seem to indicate that the mixture ethanol þ ethyl acetate (Fig. 8) presents a slight minimum flash point. However, due to the experimental error, the data is not conclusive. This mixture could as well be one barely to exhibit MinFPB.
7. Conclusion
After gathering most of the data available in the literature for flash point of 45 binary mixtures, and comparing them with azeotropic data available for these mixtures, we can infer a concomitance between minimum/maximum flash point and min-imum/maximum azeotropic behavior, at least for binary mixtures. This relation could be better understood by using the new T-dependent functions f1and f2as defined in equation(14). Indeed, f1
and f2 could be used to could be used to reformulate the known
conditions of extremum flash point and boiling point occurrence, as done in eq.(15)e(18).
We can also state that, in general, azeotropic mixtures pre-senting smallDTfp
DTb ratios likely present minimum/maximum flash
point behavior. Besides, non-azeotropic mixtures with smallDTfp
DTb
ratios might present minimum/maximum flash point and therefore should be further tested experimentally. A limitation was found for mixtures with acetic acid, and reason may come from the well known vapor association, which is not taken into account in the model.
A first empirical criterion has been proposed to forecast extremum flash point behaviors, based solely on flash point and boiling point temperature gaps, and on the azeotropic data of the mixture. However, more data on flash point of binary mixtures is necessary to validate it more precisely.
In any case, if a suitable thermodynamic model is valid for the mixture, a thermodynamic calculation can be used to check flash point extreme behavior.
Appendix A
Fig. 7. Heuristic for inferring extreme flash point behavior from azeotropic behavior in binary mixtures.
References
[1] T. Kletz, Learning from Accidents, Chapter 6, 3 edition, Gulf Professional Publishing, Oxford, 2001.
[2] S. Mannan, Lees' Loss Prevention in the Process Industries, Appendix 1, 4 edition, Butterworth-Heinemann, Oxford, 2012.
[3] L. Marmo, N. Piccinini, G. Russo, P. Russo, L. Munaro, Multiple tank explosions in an edible-oil refinery plant a case study, Chem. Eng. Technol 36 (2013) 1131e1137.
[4] H.-J. Liaw, Y.-H. Lee, C.-L. Tang, H.-H. Hsu, J.-H. Liu, A mathematical model for predicting the flash point of binary solutions, J. Loss Prev. Process Ind. 15 (2002) 429e438.
[5] H.-J. Liaw, Y.-Y. Chiu, The prediction of the flash point for binary aqueous-organic solutions, J. Hazard. Mater 101 (2003) 83e106.
[6] H.-J. Liaw, Y.-Y. Chiu, A general model for predicting the flash point of miscible mixture, J. Hazard. Mater 137 (2006) 38e46.
[7] H.-J. Liaw, V. Gerbaud, C.-Y. Chiu, Flash point for ternary partially miscible mixtures of flammable solvents, J. Chem. Eng. Data 55 (2010) 134e146. [8] H.-J. Liaw, V. Gerbaud, C.-C. Chen, C.-M. Shu, Effect of stirring on the safety of
flammable liquid mixtures, J. Hazard. Mater 177 (2010) 1093e1101. [9] L. Catoire, S. Paulmier, V. Naudet, Experimental determination and estimation
of closed cup flash points of mixtures of flammable solvents, Process Saf. Prog. 25 (2006) 33e39.
[10] S.-Y. Kim, B. Lee, A prediction model for the flash point of binary liquid mixtures, J. Loss Prev. Process Ind. 23 (2010) 166e169.
[11] M. Noorollahy, A.-Z. Moghadam, A.-A. Ghasrodashti, Calculation of mixture equilibrium binary interaction parameters using closed cup flash point mea-surements, Chem. Eng. Res. Des. 88 (2010) 81e86.
[12] T. Khalili, Z. Moghaddam, Measurement and calculation of flash point of bi-nary aqueouseorganic and organiceorganic solutions, Fluid Phase Equilibr 312 (2011) 101e105.
[13] H.J. Liaw, V. Gerbaud, Y.-H. Li, Prediction of miscible mixtures flash point from UNIFAC group contribution methods, Fluid Phase Equilibr 300 (2011) 70e82. [14] J. Gmehling, P. Rasmussen, Flash points of flammable liquid mixtures using
UNIFAC, Ind. Eng. Chem. Fundam. 21 (1982) 186e188.
[15] H.-J. Liaw, V. Gerbaud, H.-T. Wu, Flash-point measurements and modeling for ternary partially miscible aqueous-organic mixtures, J. Chem. Eng. Data 55 (2010) 3451e3461.
[16] H.-J. Liaw, T.-P. Tsai, Flash points of partially miscible aqueous-organic mix-tures predicted by UNIFAC group contribution methods, Fluid Phase Equilibr 345 (2013) 45e49.
[17] H.-J. Liaw, T.-P. Tsai, Flash-point estimation for binary partially miscible mixtures of flammable solvents by UNIFAC group contribution methods, Fluid Phase Equilibr 375 (2014) 275e285.
[18] R. Wickey, D. Chittenden, Flash points of blends correlated. Hydrocarbon process, Pet. Refin. 42 (6) (1963) 157e158.
[19] W.A. Affens, G.W. McLaren, Flammability properties of hydrocarbon solutions in air, J. Chem. Eng. Data 17 (1972) 482e488.
[20] H. Le Chatelier, Estimation of firedamp by flammability limits, Ann. Mines 19 (8) (1891) 388e395.
[21] D. White, C.L. Beyler, C. Fulper, J. Leonard, Flame spread on aviation fuels, Fire Saf. J. 28 (1997) 1e31.
[22] L. Catoire, S. Paulmier, V. Naudet, Estimation of closed cup flash points of combustible solvent blends, J. Phys. Chem. Ref. Data 35 (1) (2006) 9e14.
[23] L. Berg, Selecting agent for distillation processes, Chem. Eng. Prog. 65 (1969) 52e57.
[24] V. Gerbaud, X. Joulia, I. Rodriguez-Donis, O. Baudouin, O. Rosemain, A. Vacher, P. Castelain, Practical residue curve map analysis applied to solvent recovery in non-ideal binary mixtures by batch distillation processes, Chem. Eng. Process 45 (2006) 672e683.
[25] H.-J. Liaw, H.-Y. Chen, Study of two different types of minimum flash-point behavior for ternary mixtures, Ind. Eng. Chem. Res. 52 (2013) 7579e7585. [26] C.V. Mashuga, D.A. Crowl, Derivation of Le Chatelier's mixing rule for
flam-mable limits, Proc. Saf. Prog. 19 (2000) 112e117.
[27] M. Vidal, W.J. Rogers, J.C. Holste, M.S. Mannan, A review of estimation methods for flash points and flammability limits, Proc. Saf. Prog. 23 (2004) 47e55.
[28] X. Liu, Z. Liu, Research progress on flash point prediction, J. Chem. Eng. Data 55 (2010) 2943e2950.
[29] G.M. Kontogeorgis, G.K. Folas, Thermodynamic Models for Industrial Appli-cations: from Classical and Advanced Mixing Rules to Association Theories, Chapters 4 and 5, Wiley, Chichester, 2010.
[30] V.N. Kiva, E.K. Hilmen, S. Skogestad, Azeotropic phase equilibrium diagrams: a survey, Chem. Eng. Sci. 58 (2003) 1903e1953.
[31] R.W. Missen, On criteria for occurrence of azeotropes in isothermal and isobaric binary systems, Can. J. Chem. Eng 83 (2005) 667e674.
[32] W.J. Gaw, F.L. Swinton, Thermodynamic properties of binary systems con-taining hexafluorobenzene, Trans. Faraday Soc. 64 (1968) 2023e2034. [33] H.-J. Liaw, T.-P. Lee, J.-S. Tsai, W.-H. Hsiao, M.-H. Chen, T.-T. Hsu, Binary liquid
solutions exhibiting minimum flash-point behavior, J. Loss Prev. Process Ind. 16 (2003) 173e186.
[34] H.-J. Liaw, S.-C. Lin, Binary mixtures exhibiting maximum flash-point behavior, J. Hazard. Mater 140 (2007) 155e164.
[35] L.Y. Phoon, A.A. Mustaffa, H. Hashim, R. Mat, A review of flash point prediction models for flammable liquid mixtures, Ind. Eng. Chem. Res. 53 (2014) 12553e12565.
[36] N.D.D. Carareto, C.Y.C.S. Kimura, E.C. Oliveira, M.C. Costa, A.J.A. Meirelles, Flash points of mixtures containing ethyl esters or ethylic biodiesel and ethanol, Fuel 96 (2012) 319e326.
[37] Alfa Aesar-https://www.alfa.com. Last accessed 23rdsept. 2016.
[38] A.-Z. Moghaddam, A. Rafiei, T. Khalili, Assessing prediction models on calcu-lating the flash point of organic acid, ketone and alcohol mixtures, Fluid Phase Equilibr 316 (2012) 117e121.
[39] DIPPR- Design Institute for Physical Propertieshttp://www.aiche.org/dippr. [40] L. Silva, R. Falleiro, A. Meirelles, M. Kr€ahenbühl, Determination of the vapor
pressure of ethyl esters by Differential Scanning Calorimetry, J. Chem. Ther-modyn. 43 (2011) 943e947.
[41] H. Matsuda, H. Yamada, R. Takahashi, A. Koda, K. Kurihara, K. Tochigi, K. Ochi, Ebulliometric determination and prediction of vapor-liquid equilibria for bi-nary mixtures of ethanol and ethyl hexanoate, J. Chem. Eng. Data 56 (2011) 5045e5051.
[42] ASTM D 56, Standard Test Method for Flash Point by Tag Closed Tester, American Society for Testing and Materials, West Conshohocken, PA, 2010. [43] H.-J. Liaw, C.-T. Chen, C.-C. Cheng, Y.-T. Yang, Elimination of minimum
flash-point behavior by addition of a specified third component, J. Loss Prev. Process Ind. 21 (2008) 82e100.
[44] Simulis Thermodynamics®
http://www.prosim.net(2010).
[45] J. Gmehling, J. Menke, J. Krafczyk, K. Fischer, Azeotropic Data, Parts I & II, 3 edition, VCH Pub, New York, 1994.
[46] H.-J. Liaw, C.L. Tang, J.S. Lai, A model for predicting the flash point of ternary flammable solutions of liquid, Combust. Flame 138 (4) (2004) 308e319. [47] M. Kato, T. Sato, M. Hirata, Vapor-liquid equilibrium relationship of
para-xylene meta-para-xylene system at atmospheric pressure, J. Chem. Eng. Jpn. 4 (1971) 305e308.
[48] T. Hiaki, A. Taniguchi, T. Tsuji, M. Hongo, K. Kojima, Isobaric vapor-liquid equilibria of octane þ 1-butanol, þ 2-butanol, and þ 2-Methyl-2-propanol at 101.3 kPa, J. Chem. Eng. Data 41 (1996) 1087e1090.
[49] C.-H. Tu, Y.-S. Wu, T.-L. Liu, Isobaric vapor-liquid equilibria of methanol, methyl acetate and methyl acrylate system at atmospheric pressure, Fluid Phase Equilibr 135 (1997) 97e108.
[50] R. Coelho, P.G. dos Santos, M.R. Mafra, L. Cardozo-Filho, M.L. Corazza, (Vapor þ Liquid) equilibrium for the binary systems {water þ glycerol} and {ethanol þ glycerol, ethyl stearate, and ethyl palmitate} at low pressures, J. Chem. Thermodyn. 43 (2011) 1870e1876.
[51] B. Hanley, A model for the calculation and the verification of closed cup flash points for multicomponent mixtures, Proc. Saf. Prog. 17 (1998) 86e97. [52] M. Schmitt, H. Hasse, Phase equilibria for hexyl acetate reactive distillation,
J. Chem. Eng. Data 50 (2005) 1677e1683.
[53] F. Comelli, R. Francesconi, Isobaric vapor-liquid equilibrium in binary mix-tures of m- and p-xylenes with cyclohexene and cyclohexanone, Can. J. Chem. Eng. 63 (1985) 344e347.
[54] J.M. Prausnitz, R.N. Lichtenthaler, E. Gomes de Azevedo, Molecular Thermo-dynamics of Fluid-phase Equilibria, third ed., Prentice Hall, 1999, pp. 174e179.
[55] B.E. Poling, J.M. Prausnitz, J.P. O'Connell, Properties of Gases and Liquids, 5 edition, McGraw-Hill, 2001.
[56] J.D. Seader, J.J. Siirola, S.D. Barnicki, Distillation, chapter 13, in: R.H. Perry, D.W. Green (Eds.), Perry's Chemical Egineer's Handbook,7 edition, McGraw-Hill, 1997.