an author's http://oatao.univ-toulouse.fr/22003
https://doi.org/10.1234/phmconf.2018.v10i1.500
Atamuradov, Vepa and Medjaher, Kamal and Dersin, Pierre and Zerhouni, Noureddine and Camci, Fatih A new adaptive prognostics approach based on hybrid feature selection with application to point machine monitoring. (2018) In: Annual Conference of the Prognostics and Health Management Society 2018, September 2018
A New Adaptive Prognostics Approach based on Hybrid Feature
Selection with Application to Point Machine Monitoring
Vepa Atamuradov1, Kamal Medjaher1, Pierre Dersin2, Noureddine Zerhouni3 and Fatih Camci4
1Production Engineering Laboratory (LGP), INP-ENIT 47 Av. d’Azereix, 65000 Tarbes, France
[email protected] [email protected]
2ALSTOM Transport, 93400 Saint-Ouen, France
[email protected] [email protected]
3FEMTO-ST Institute, UMR CNRS 6174 – UFC/ENSMM 15B av. des Montboucons, 25000 Besançon, France
4Advanced Micro Devices (AMD), USA
ABSTRACT
This paper proposes a new adaptive prognostics approach consisting of hybrid feature selection and remaining-useful-life (RUL) estimation steps for railway point machines. In step-1, different time-domain based features are extracted and the best ones are selected by the hybrid feature selection method. Then, a degradation model is fitted to each of the selected features and the parameters are estimated. In step-2, the RUL of the component is predicted by using the proposed adaptive prognostics approach. The adaptive prognostics is based on the weighted likelihood combination of the estimated model parameters. The model parameters each of which estimated by curve fitting are used in the calculation of the likelihood probability weights. Then, an adaptive degradation model is built by using the weighted combination of the model parameter estimates and the component RUL is estimated. The proposed approach is validated on in-field point machine sliding-chair degradation and the results are discussed.
1. INTRODUCTION
An improvement of reliability, availability and passenger safety has been one of the main concerns for many years in the railway industry. Thus, it is important to develop predictive maintenance strategies to monitor railway infrastructures such as bogies (Ashasi-Sorkhabi et al. 2017; Atamuradov, Medjaher, Dersin, et al. 2017), gearbox
(Ashasi-Sorkhabi et al. 2017), breaking systems (Lee 2017), overhead contact lines (Brahimi et al. 2017), tilting actuators (Martin et al. 2017) and point machines (Böhm 2017). Railway turnout system, which consists of sliding-chair plates, point machine, stock rails and locking systems are used to control the train turnouts at a distance (Eker et al. 2011). In literature, the point machine failure diagnostics (Atamuradov, Medjaher, Lamoureux, et al. 2017; García Márquez, Roberts, and Tobias 2010) and prognostics (Letot et al. 2015) have been studied extensively. However, there still remain many problems that need to be studied to increase the accuracy while minimizing the uncertainty in RUL prediction. One of the key steps in the development of robust and accurate fault prognostics is the selection of good prognostics features.
In literature, feature evaluation and selection techniques are classified as a) inherent: which uses ranking metrics to filter out least interesting feature (e.g. trendability, monotonicity (J. B. Coble 2010) and seperability (Camci et al. 2013), etc.), b) consistent: which filters out the least correlated feature from the given feature population, and c) hybrid: which is the combination of inherent and/or consistent techniques (Lei et al. 2018). The authors in (Javed et al. 2015) proposed an inherent feature selection technique to increase the prognostics accuracy. In (Liao 2014) an inherent feature evaluation metric was integrated with genetic algorithm (GA) to discover good prognostics features for RUL prediction. The authors in (J. Coble and Hines 2009) developed a hybrid feature selection technique for prognostics based on the linearly weighted combination of the inherent and consistent techniques. In this proposed technique, the weights were Vepa Atamuradov et al. This is an open-access article distributed under
the terms of the Creative Commons Attribution 3.0 United States License, which permits unrestricted use, distribution, and reproduction in any medium, provided the original author and source are credited.
optimized by utilizing the GA. However, despite the good optimization performance, feature selection techniques based on heuristic algorithms, e.g. GA, might be computationally expensive, particularly if there is a big amount of feature samples. Hence, the development of computationally efficient feature selection techniques is necessary to improve the failure prognostics accuracy. Then, the selected prognostics features can be used to train the prognostics tools for RUL prediction.
The failure prognostics can be defined as the process of predicting the remaining time (RUL) at which a component will no longer perform a particular function. The authors in (Omer F Eker and Camci 2013; Omer Faruk Eker et al. 2011), developed a state duration based prognostics approach for point machine monitoring. The developed approach gave better RUL prediction results when compared with different prognostics tools. A data-driven failure prognostics model was proposed by (Letot et al. 2015) for point machine monitoring based on the power signals to predict the RUL. A similar data-driven prognostics approach based on a Bayesian parameter update was also proposed in (Ashasi-Sorkhabi et al. 2017), for train gearbox monitoring using vibration signals. A failure of train braking system was studied in (Lee 2017). The authors developed an air leakage detection and prediction approach based on a density-based clustering and logistic function. Since prognostics approaches deal with the prediction of the future component health states, the uncertainties in system parameters, nominal system model, degradation model, RUL prediction, and failure threshold should be well quantified in component health assessment (Atamuradov, Medjaher, Dersin, et al. 2017; Sankararaman and Goebel 2015).
To fill the aforementioned gaps in the literature, this paper proposes a new adaptive prognostics approach based on hybrid feature selection for railway point machine sliding-chair degradation. The proposed approach is composed of two steps.
In step-1, a hybrid feature selection method is developed. It is based on the affinity matrix and inherent feature evaluation. The affinity matrix is built to calculate the features’ relative importance weights (RIWs). The inherent feature evaluation deals with the calculation of monotonicity, correlation and robustness metrics of each feature. Then, a hybrid fitness function is constructed by combining the weighted (with RIWs) inherent feature metrics and the features are ranked accordingly. The features with the highest hybrid ranking value are selected and used in prognostics. In step-2, a degradation model is defined to each of the selected features and the model parameters are estimated. Then, a likelihood probability of each parameter is calculated by using the estimated model parameters of each feature. Afterward, an adaptive degradation model is constructed by using the weighted combination of the estimated model parameters with the likelihood probabilities. The adaptive
degradation model parameters are estimated and updated at each prediction time, iteratively, to estimate the RUL. The paper contains four sections. After the introduction, Section 2, describes the main steps of the proposed prognostics approach. Section 3 presents the experimental rig setup, data collection and the results of the proposed approach. Section 4 concludes the paper.
2. PROPOSED APPROACH
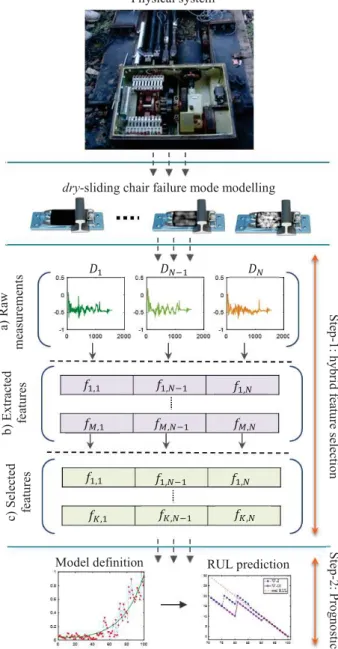
In this section, the hybrid feature selection and the adaptive prognostics steps will be explained in detail. The overall scheme of the proposed approach is depicted in Figure 1.
Figure 1. Step1: a) Raw measurements (!" is the #$% sample), b) extracted feature population (&',") and c) selected features
(&),", where *+ < -), Step2: Adaptive prognostics. &.,. &.,"/. &.,"
&),. &),"/. &)," &.,. &.,"/. &.," &',. &',"/. &',"
!. !"/. !" a) Ra w me asu re me n ts c) S elec ted fe atu re s b ) Ex trac ted fe atu re s Physical system
dry-sliding chair failure mode modelling
S tep -1 : h y b rid fe atu re se lec ti o n le), S tep -2 : P ro g n o stics
2.1. Hybrid feature selection
First, time-domain based features such as skewness, root mean square (rms), kurtosis, mean, standard deviation (stdev), variance (var), crest factor (crfactor) and peak-to-peak (p2p) are extracted from the raw measurements. The features in different scales are normalized before selection by using equations (1) and (2).
01=(489*(2(23/456*(237/456*(2377377; :>?@?*!1,$=489(AA3,B37* (1)
01=(489*(2(23/456*(237/456*(2377377; :>?@?*!1,$=456*(AA3,B37 (2) &1,$ is the Cth feature data point at time index D*(D = E, … , F7,*F is the feature length and 01 is the Cth normalized feature.
The hybrid feature selection is carried out in two-steps. In step-1, the affinity matrix (4) is built using the Euclidean distance (3).
GCHDI&J, &KL = MN(&J,1O &K,17P "
1Q. (3)
where # is the length of the given features R and S. T&&CUCDV'×'*= WGCHD(&XJ, &K7 C&*R Y S!C&*R = S ! (4)!
where GCHD(&J, &K7 is the Euclidean distance between the features &J and &K from the feature population with a size of - . The relative importance weight :1 of the C$%*(ZC = E … -7 feature is then derived by using the exponential membership function (5).
:1= ?[R \OE ×] GCHD(&1,.7 '
1Q.
- ^ (5)
In step-2, inherent metrics such as monotonicity (-_U1), correlation (`_@@1) and robustness (a_b1) are calculated by using equations (7), (8) and (9). The features monotonicity metric is used to extract increasing or decreasing trend information. -_U1(&17 = cd efg3fhi* "/. O efg3fji "/. dk (6) where -_U1 is the monotonicity value for the C$% feature (&1) with length of # . The absolute value of the difference between number of positive (e G
G&Cl X7 and negative (e
G
G&C<
X7 derivatives gives the monotonicity value. The features correlation measures the linearity statistics between the failure propagation and time.
`_@@1(&1, F17 = mnop(Arg3r3s3,q37t (7)
where u_v is the covariance of C$% feature (&1) with the time vector F, and w is the standard deviation. The robustness metric stands for the features’ resistance to the measurement noise and it is calculated by decomposing the feature into trend (Hx__D>?Gy&1) and residual (@?H&1) components by using equations (8) and (9).
@?H&1= &1O Hx__D>?Gy&1*! (8)
a_b1(&17 =*c
] z9{*(/|€• }~•g3g3 |7
" k (9)
where Hx__D>?Gy&1 is the smoothed feature, # is the length of C$% feature (&1). Then, the hybrid ranking function is built by using equation (10), which is the combination of the inherent metrics weighted by the corresponding relative importance weights.
>a@‚UƒCU„1=
] †:'1Q. 1× -_U1, :1× `_@@1, :1× a‡b1ˆ (10) Finally, the >a@‚UƒCU„ vector is sorted in descending order starting from the highest relevant feature to the lowest relevant feature. Once the feature ranking step is completed, the top best (&)7 features are selected and used in prognostics. 2.2. Adaptive prognostics approach
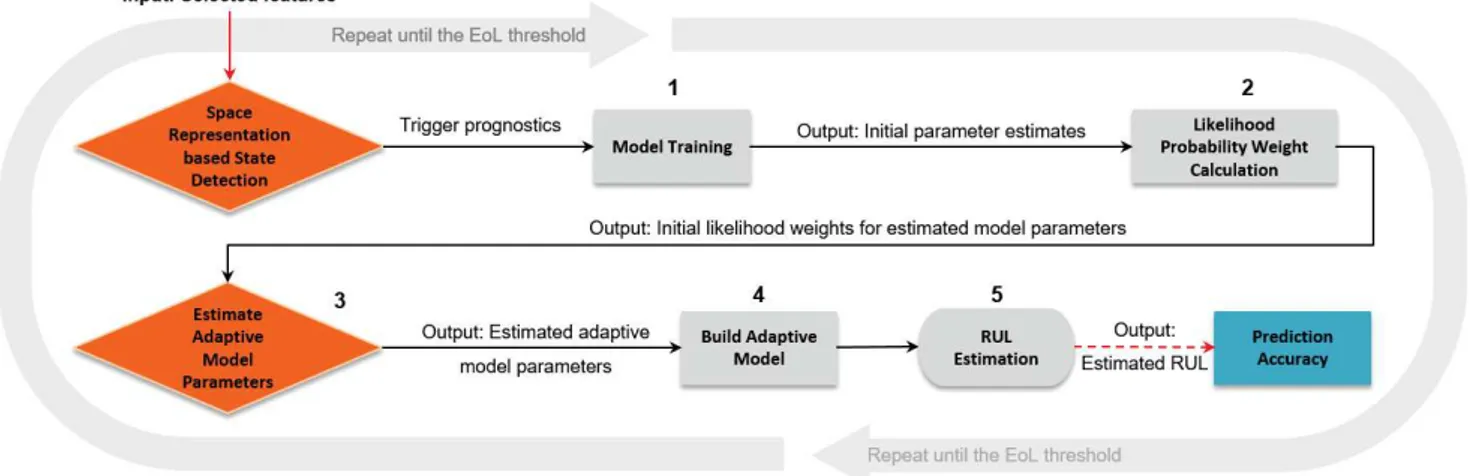
In this study, a polynomial function with a degree of 3 is used to model the sliding chair degradation due to its good degradation representability. This model is given in equation (11). The steps of the adaptive prognostics approach are illustrated in Figure 2.
&(D7‰Š= ‹ × DŒ• Ž × DP••× D • *• (11) where &(D7‰Š is the model output at time D and ‹, Ž, •, • are the model parameters to be estimated. The model parameters of each of the selected features are estimated by using a curve fitting toolbox of MATLAB. Then, the estimated parameters are used to build an adaptive degradation model for RUL prediction.
A similar work based on the Dempster-Shafer evidence theory to build a prior model for battery degradation was proposed in (He et al. 2011). The belief measure was assigned to each of the estimated parameters of the corresponding feature, by comparing the parameter confidence intervals. The basic idea was to assign a more belief weight to the parameter interval that includes the other parameter intervals to be used in parameter combination. However, the disadvantage of this evidence theory-based approach is that if there are no any such interval subsets, then it combines the parameters with the equal weights resulting in a simple weighted arithmetic mean combination.
The difference between our approach and the work in (He et al. 2011) is that the calculation of parameter likelihood weights are not limited to the confidence interval length.
Figure 2. The adaptive prognostics approach steps. Instead, in our work, the estimated parameters get varying
likelihood weights, as follows:
· If there is no parameter confidence interval that includes the other parameter intervals, then each parameter gets a varying likelihood weights proportional to their values. · If one of the parameter intervals includes the other
parameter interval(s) or has wider interval length, then a more likelihood weight is assigned to this parameter(s). Note that, our approach does not compare the parameter intervals, but only the likelihood of the estimated parameters. If one of the estimated parameters is bigger than the others, then, theoretically, it should have the wider length of the confidence interval (i.e. the estimated parameter is the mean of the confidence interval estimates).
Let’s assume that there are &) selected features and the ?‘),’= “‹),’, Ž),’, •),’, •),’, ” = E, • • ,–— are the estimated initial parameters from each features’ degradation model. Then, the likelihood probability weight for the ?‘),’Q. (i.e. the 1st estimated parameter of model + ) is calculated by using equation (12). ˜),’Q.=] ?‘?‘),. ),. ) 1Q. = ‹),. ] ‹)1Q. ),.;*N˜+,E= E ) 1Q. * (12)
The same equation (12) is used to build the likelihood probability weights for the other Ž),., •),., •),. parameters. After the calculation of ˜),’ values, the adaptive degradation model parameters R., RP, RŒ, R™ can be estimated by the weighted arithmetic mean function, which is given in (13).
R’= N˜),’× ‹),’; *” = E, … ,– )
1Q.
(13)
The adaptive degradation parameters are updated at each 5-time stamp, then the adaptive RUL is estimated. The RUL prediction accuracy (‘Tuu) is calculated by using equation (14) (Tobon-Mejia, Medjaher, and Zerhouni 2012).
‘Tuu =š.]š¤Q.O›œ•*žaŸ ¡(b7 O aŸ ¢(b7ž aŸ £ ¡(b7 (14) where ¥ is the number of data points used in RUL prediction. For the best prediction performance, the ‘Tuu produces 1, and 0 for the worst.
3. APPLICATION AND RESULTS
This section explains the experimental rig setup and data collection procedures for point machine and presents the proposed approach results.
3.1. System description and data collection
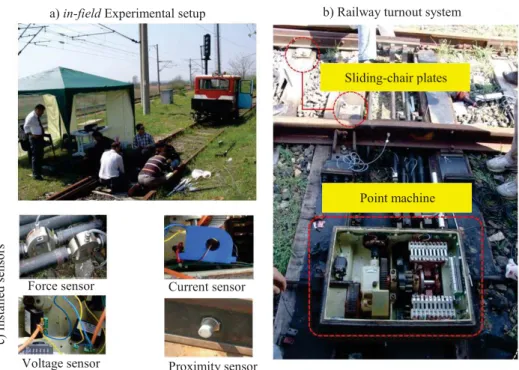
In this study, we investigated the dry sliding-chair failure mode of the point machine, which is generated by an accelerated aging procedure (i.e. a manual contamination process such as soiling or scratching out the grease) of the sliding-chair plates. Figure 3 a) shows the in-field experimental test-rig setup, Figure 3 b) the turnout system and Figure 3 c) installed sensors for data acquisition. Sliding-chair plates are the metal assets of the turnout system that assist the point machine drive rods in moving the rail blades easily. The dry sliding-chair degradation data were generated on the real turnout system with 12 sliding-chair plates, in total. At first, all 12 plates were individually lubricated and the point machine was run 10 times in each movement to get the first healthy (fault-free) measurements. Afterward, the accelerated aging procedure took place by contaminating the three farthest (10th, 11th, and 12th) plates from the point machine to get an initial faulty state.
Figure 3. a) Experimental setup, b) railway turnout system and c) installed sensors. The second faulty state was generated by contaminating the
9th plate after the first process. After each step of the contamination process, the point machine was run 10 times from normal-to-reverse (forth) and reverse-to-normal (back) positions to collect the measurements. The contamination on sliding-chair plates results in variation of performance measurement signals (e.g. force, current, voltage, etc.) due to the increasing friction force against the turnout driving rod force applied to move the blades. The accelerated aging procedure was repeated until a final and complete sliding-chair failure state was reached. Note that no trains went through the turnout system during the data acquisition operation. It was temporarily reserved for experimentation purposes only. The force and current sensor measurements are the most commonly used data in the literature for point machine diagnostics and prognostics (García Márquez and Schmid 2007). In this study, the force measurements are used to validate the proposed approach.
3.2. Results and Discussions
Figure 4 shows the extracted features and normalized features from the raw measurements (equations (1) and (2)). The hybrid feature selection step-1 results are given in Table 1 and step-2 results are given in Table 2. Table 2 presents the ranked features (F1{skw}, F2{krt}, F3{rmse}, F4{avg}, F5{stdev}, F6{Var}, F7{crst} and F8{p2p}) in descending order. Then, the first three features F5, F3 and F8 were selected as the best prognostics features and used in model training for the RUL prediction.
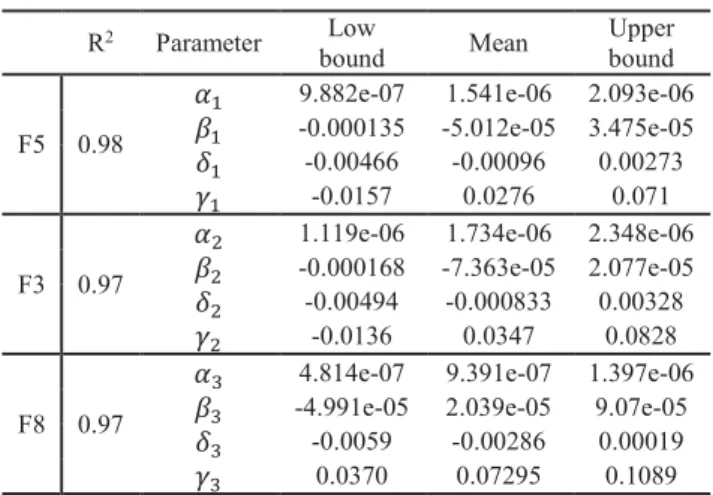
Table 3 shows the results of the model goodness-of-fit statistics (R2) and the estimated parameters for each of the features by using the curve fitting toolbox of MATLAB. The R-statistics indicates that the polynomial model is suitable to represent the degradation of the sliding-chair plate.
Table 1. Affinity matrix and calculated relative importance weights (step-1). F1 F2 F3 F4 F5 F6 F7 F8 F1 0 3.10 2.44 2.52 2.59 2.01 4.63 2.66 F2 3.10 0 1.11 0.97 1.02 1.81 2.79 0.97 F3 2.44 1.11 0 0.38 0.26 0.71 3.16 0.60 F4 2.52 0.97 0.38 0 0.37 0.96 2.83 0.40 F5 2.59 1.02 0.26 0.37 0 0.88 3.05 0.41 F6 2.01 1.81 0.71 0.96 0.88 0 3.56 1.13 F7 4.63 2.79 3.16 2.83 3.05 3.56 0 2.75 F8 2.66 0.97 0.60 0.40 0.41 1.13 2.75 0 w 0.08 0.22 0.33 0.34 0.34 0.24 0.05 0.32
Table 2. Hybrid feature ranking results (step-2). Monotonicity Correlation Robustness hRanking
F5 0.48 0.85 0.75 0.71 F3 0.50 0.76 0.71 0.67 F8 0.46 0.82 0.71 0.65 F4 0.34 0.64 0.78 0.61 F6 0.48 0.85 0.69 0.50 F2 0.22 0.60 0.74 0.35 F1 0.02 0.45 0.66 0.09 F7 0.26 0.34 0.76 0.07 a) in-field Experimental setup b) Railway turnout system
c) In sta ll ed se n so rs
Force sensor Current sensor
Voltage sensor Proximity sensor
Sliding-chair plates
Figure 4. a) Raw measurements, b) extracted features and c) normalized features.
Table 3. Estimated parameters including the 95% confidence interval bounds with R-statistics. R2 Parameter Low
bound Mean
Upper bound
F5 0.98
‹. 9.882e-07 1.541e-06 2.093e-06 Ž. -0.000135 -5.012e-05 3.475e-05 •. -0.00466 -0.00096 0.00273 •. -0.0157 0.0276 0.071
F3 0.97
‹P 1.119e-06 1.734e-06 2.348e-06 ŽP -0.000168 -7.363e-05 2.077e-05 •P -0.00494 -0.000833 0.00328 •P -0.0136 0.0347 0.0828
F8 0.97
‹Œ 4.814e-07 9.391e-07 1.397e-06 ŽŒ -4.991e-05 2.039e-05 9.07e-05 •Œ -0.0059 -0.00286 0.00019 •Œ 0.0370 0.07295 0.1089 Before triggering the prognostics tool, a faulty state from the degradation data should be detected first. In this paper, the faulty state was obtained by projecting the F5-F3-F8 feature combination in the representation space (Soualhi, Medjaher, and Zerhouni 2015) as depicted in Figure 5.
Figure 5. State detection by representation space projection. The representation space of the feature combination allows identifying the health state transitions of the sliding-chair degradation. Since the training features F5, F3 and F8 have correlated degradation pattern, it was assumed that they have the same cycle number where an incipient fault occurs. After the detection of the incipient fault, which is at cycle 69, the feature degradation models (x., xP, xŒ) are trained and the initial parameters are estimated as shown in Table 4.
Table 4. Initial parameter estimates after fault detection.
‹ Ž • • 0¦(x.7 -4.258e-07 8.055e-05 -0.0024 0.0243 0§(xP7 2.688e-07 -6.901e-06 -0.00024 0.0174 0¨(xŒ7 -1.38e-06 0.0001895 -0.0055 0.0763 sk ew n ess rm s k u rto sis m ea n crfa cto r p 2 p Cycle Cycle Cycle Cycle Cycle Cycle Cycle Cycle std ev var b) a) c) De g ra d ati o n Cycle State-3: Sever fault State-1: No fault State-2: Incipient fault
By using the equation (12) the likelihood probability weights of the training model parameters were calculated and the results are given in Table 5.
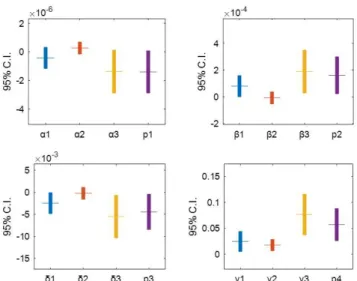
From the initial parameter estimates (Table 5), the combined parameters can be estimated by using equation (13). The combined parameters R., RP, RŒ, R™ for the adaptive degradation model (‚-) are given in Table 6. Figure 6 shows that the combined parameters and their confidence intervals (C.I.) are adapted to the change of the initial model parameter estimates and their C.Is. The parameter updating is iteratively repeated as new data points are available until the end-of-life (EoF) threshold value (see Figure 2).
Table 5. Calculated likelihood probability weights.
x. ˜.,’Q. xP ˜P,’Q. xŒ ˜Œ,’Q.
‹. 0.1355 ‹P 0.2177 ‹Œ 0.6468 Ž. 0.5102 ŽP 0.1890 ŽŒ 0.3008 •. 0.1316 •P 0.5170 •Œ 0.3515 •. 0.3400 •P 0.3281 •Œ 0.3319 Table 6. Combined adaptive degradation model parameters.
R. RP RŒ R™
‚- -1.4038e-06 1.6133e-04 -0.0044 0.0569 Figure 7 shows the RUL prediction results for the models x.(Ra‡©E7, xP(Ra‡©ª7, xŒ(Ra‡©¦7 and ‚-(‚a‡©7 , whereas Table 7 presents the RUL prediction accuracies (‘TuuxE, ‘Tuu«P, ‘Tuu«Œ, ‘Tuu¬'7. As can be seen from
the given Table 7 , the proposed adaptive prognostics approach improved the RUL prediction accuracy, which proves the applicability in railway point machine monitoring.
Figure 6. Estimated parameter confidence intervals (C.I.). Table 7. RUL prediction accuracy.
‘Tuu«. ‘Tuu«P ‘Tuu«Œ ‘Tuu¬' ‘Tuu 0.84 0.83 0.91 0.92
4. CONCLUSION
In this paper, a new adaptive prognostics approach based on a hybrid feature selection method was proposed for point machine sliding chair monitoring. A polynomial model was defined for each of the selected features and the model parameters were estimated. Then, the adaptive degradation model was built based on the likelihood probability weights calculated by using the initial model parameter estimates of the selected prognostics features. The model parameters were updated, iteratively, and the RULs were estimated. The results showed that the proposed prognostics approach improved the RUL prediction accuracy for the sliding-chair degradation.
As a future work, we plan to extend the proposed approach and to develop an adaptive system-level prognostics approach based on the extracted features from different components for condition monitoring and predictive maintenance.
ACKNOWLEDGEMENT
This research was supported by a grant from ENIT, Production Engineering Laboratory (LGP), funded by ALSTOM. Point machine and Li-ion degradation datasets were taken from the projects (# 108M275 and # 113M093), which were supported by The Scientific and Technological Research Council of Turkey (TUBITAK).
REFERENCES
Ashasi-Sorkhabi, Ali, Stanley Fong, Guru Prakash, and Sriram Narasimhan. 2017. “A Condition Based Maintenance Implementation for an Automated People Mover Gearbox.” International Journal of Prognostics and Health Management: 1–14.
Atamuradov, Vepa, Kamal Medjaher, Benjamin Lamoureux, et al. 2017. “Fault Detection By Segment Evaluation Based On Inferential Statistics For Asset Monitoring.” In Annual Conference of the Prognostics and Health Management Society 2017, , 1–10.
Atamuradov, Vepa, Kamal Medjaher, Pierre Dersin, et al. 2017. “Prognostics and Health Management for Maintenance Practitioners - Review, Implementation and Tools Evaluation.” International Journal of Prognostics and Health Management 8(3): 1–31. Böhm, T. 2017. “Remaining Useful Life Prediction for
Railway Switch Engines Using Classification Techniques.” International Journal of Prognostics and Health Management 8(Special Issue 7). https://www.scopus.com/inward/record.uri?eid=2-
s2.0-85037702039&partnerID=40&md5=45468c92ee66f1 8acca25e8d99c67764.
Brahimi, Mehdi, Kamal Medjaher, Mohammed Leouatni, and Noureddine Zerhouni. 2017. “Prognostics and Health Management for an Overhead Contact Line System - A Review.” International Journal of Prognostics and Health Management: 1–16.
Camci, F., K. Medjaher, N. Zerhouni, and P. Nectoux. 2013. “Feature Evaluation for Effective Bearing Prognostics.” Quality and Reliability Engineering
International 29(4): 477–86.
http://doi.wiley.com/10.1002/qre.1396.
Coble, Jamie Baalis. 2010. “Merging Data Sources to Predict Remaining Useful Life--an Automated Method to
Identify Prognostic Parameters.”
http://trace.tennessee.edu/utk_graddiss/683.
Coble, Jamie, and J. Wesley Hines. 2009. “Identifying Optimal Prognostic Parameters from Data: A Genetic Algorithms Approach.” Proceedings of the Annual Conference of the Prognostics and Health
Management Society: 1–11.
https://www.phmsociety.org/sites/phmsociety.org/file s/phm_submission/2009/phmc_09_69.pdf.
Eker, Omer F, and Fatih Camci. 2013. “State Based Prognostics with State Duration Information.” Quality and Reliability Engineering International.
Eker, Omer Faruk et al. 2011. “A Simple State-Based Prognostic Model for Railway Turnout Systems.” IEEE Transactions on Industrial Electronics 58(5): 1718–26.
García Márquez, Fausto Pedro, C Roberts, and Andrew Mark Tobias. 2010. “Railway Point Mechanisms: Condition Monitoring and Fault Detection.” Proceedings of the Institution of Mechanical Engineers, Part F: Journal of Rail and Rapid Transit 224(1): 35–44. http://pif.sagepub.com/lookup/doi/10.1243/09544097J RRT289.
García Márquez, Fausto Pedro, and Felix Schmid. 2007. “A Digital Filter-Based Approach to the Remote Condition Monitoring of Railway Turnouts.” Reliability Engineering and System Safety 92(6): 830–40. He, Wei, Nicholas Williard, Michael Osterman, and Michael
Pecht. 2011. “Prognostics of Lithium-Ion Batteries Based on Dempster-Shafer Theory and the Bayesian Monte Carlo Method.” Journal of Power Sources
196(23): 10314–21.
http://dx.doi.org/10.1016/j.jpowsour.2011.08.040. Javed, Kamran, Rafael Gouriveau, Noureddine Zerhouni, and
Patrick Nectoux. 2015. “Enabling Health Monitoring Approach Based on Vibration Data for Accurate Prognostics.” IEEE Transactions on Industrial
Electronics 62(c): 647–56.
arnumber=6824783.
Lee, Wan-jui. 2017. “Anomaly Detection and Severity Prediction of Air Leakage in Train Braking Pipes.” International Journal of Prognostics and Health Management.
Lei, Yaguo et al. 2018. “Machinery Health Prognostics: A Systematic Review from Data Acquisition to RUL Prediction.” Mechanical Systems and Signal
Processing 104(May): 799–834.
https://doi.org/10.1016/j.ymssp.2017.11.016.
Letot, C. et al. 2015. “A Data Driven Degradation-Based Model for the Maintenance of Turnouts: A Case Study.” IFAC-PapersOnLine 28(21): 958–63. http://dx.doi.org/10.1016/j.ifacol.2015.09.650. Liao, Linxia. 2014. “Discovering Prognostic Features Using
Genetic Programming in Remaining Useful Life Prediction.” IEEE Transactions on Industrial Electronics 61(5): 2464–72.
Martin, Andrea De, Andrea Dellacasa, Giovanni Jacazio, and Massimo Sorli. 2017. “Integrated Health Monitoring for the Actuation System of High-Speed Tilting Trains.” International Journal of Prognostics and Health Management: 1–12.
Sankararaman, Shankar, and Kai Goebel. 2015. “Uncertainty in Prognostics and Health Management: An Overview.” International Journal of Prognostics and Health Management: 1–11.
Soualhi, Abdenour, Kamal Medjaher, and Noureddine Zerhouni. 2015. “Bearing Health Monitoring Based on Hilbert – Huang Transform , Support Vector Machine , and Regression.” IEEE Transactions on Instrumentation and Measurement 64(1): 52–62. Tobon-Mejia, D. A., K. Medjaher, and N. Zerhouni. 2012.
“CNC Machine Tools Wear Diagnostic and Prognostic by Using Dynamic Bayesian Networks.” Mechanical Systems and Signal Processing 28: 167–82. http://dx.doi.org/10.1016/j.ymssp.2011.10.018.