1 2 3 4 5 6 7 8 9 10 11 12 13 14 15 16 17 18 19 20 21 22 23 24 25 26 27 28 29 30 31 32 33 34 35 36 37 38 39 40 41 42 43 44 45 46 47 48 49 50 51 52 53 54 55 56 57 58 59 60
Biocover Performance of Landfill Methane Oxidation:
Experimental Results
Cabral, A.R.1,*, Moreira, J.F.V. 2 and Jugnia, L-B.3
1 Professor, Department of Civil Engineering, Université de Sherbrooke, 2500, Boulevard
Université de Sherbrooke, Quebec, Canada J1K 2R1. E-mail: alexandre.cabral@usherbrooke.ca 2 Previously: Post Doctoral Fellow, Department. of Civil Engineering, Université de
Sherbrooke, 2500, Boulevard Université de Sherbrooke, Quebec, Canada J1K 2R1. Presently: Technical Coord., Direction of Infrastructure, Ministry of Municipal Affairs, Regions and Territorial Occupation; Aile Chauveau, 2nd Floor; 10, rue Pierre-Olivier-Chauveau, Québec, QC, Canada G1R 4J3; E-mail: JoaoFernandesViana.Moreira@mamrot.gouv.qc.ca 3 Research Officer, National Research Council Canada, Biotechnology Research Institute,
6100, Royalmount Ave., Montreal, Quebec, Canada, H4P 2R2. Email: louis.jugnia@cnrc-nrc.gc.ca
* Corresponding Author
Manuscript was submitted on December 17, 2008; approved on March 15, 2010; published online on October 24, 2009.
3 4 5 6 7 8 9 10 11 12 13 14 15 16 17 18 19 20 21 22 23 24 25 26 27 28 29 30 31 32 33 34 35 36 37 38 39 40 41 42 43 44 45 46 47 48 49 50 51 52 53 54 55 56 57 58 59 60 61 62 Abstract:
An experimental passive methane oxidation biocover (PMOB) was constructed within the existing final cover of the St-Nicéphore landfill. Its substrate consisted of a 0.80-m thick mixture of sand and compost. The goal of this experiment was to evaluate the performance of the PMOB in reducing CH4 emissions when submitted to an increasing methane load. The
CH4 load applied started with 0.3 g CH4 m−2 h−1. When the site had to be closed for the
winter, the CH4 input was 27 g CH4 m−2 h−1. Throughout the study, practically all the CH4
input was oxidized, absolute removal rates were linearly correlated to methane loading, and the oxidation zone was established between 0.6-0.8 m. These results seem to indicate that the upper limit potential of this PMOB to oxidize CH4 was not reached during the study
period. Surface CH4 concentration scans showed no signs of leaks. The substrate offered
excellent conditions for the growth of methanotrophs, whose count averaged 3.91 x 10⁸ CFU g dw-1 soil.
4 5 6 7 8 9 10 11 12 13 14 15 16 17 18 19 20 21 22 23 24 25 26 27 28 29 30 31 32 33 34 35 36 37 38 39 40 41 42 43 44 45 46 47 48 49 50 51 52 53 54 55 56 57 58 59 60 Introduction
Methane is a radiatively active gas whose concentration in the atmosphere has increased in the last several decades due principally to the great increase in anthropogenic emissions (IPCC 2001); it is now estimated that as much as 19% of the CH4 anthropogenic
emissions to the atmosphere can be attributed to landfills (IPCC 2001). A number of design advances, such as gas collection systems, have reduced the environmental impacts of new landfills. However, in small and old landfills, gas collection is not cost effective, and as a result all the biogas produced is allowed to escape into the atmosphere, constituting what is called fugitive emissions. In addition, residual emissions are expected to be released from landfills after gas collection systems are turned off. However low they might be, such residual emissions may occur for several decades.
Methane emissions from landfills, particularly fugitive and residual emissions, can be reduced through microbial methane oxidation in landfill cover soils (Ait-Benichou et al. 2009; Hilger et al. 2000) - or biocovers. This relies principally on the activity of methane oxidizing bacteria, or methanotrophs, which are able to use molecular oxygen to oxidize CH4 to CO2
and cell carbon (Hanson and Hanson 1996). Biocovers are cited in the IPCC Working Group III assessment report (IPCC 2007; Table SPM 3) as one of the key technologies for reducing fugitive landfill emissions, i.e. methane that is not captured by collection systems and migrates to the atmosphere.
Previous studies conducted in situ have demonstrated the potential of biocovers to reduce methane emissions from landfills (e.g. Barlaz 2004; Cabral et al. 2009; Chanton and Liptay 2000; Humer and Lechner 1999; 2001; Jugnia et al. 2008; Stern et al. 2007; Whalen et al. 1990). In these studies, the substrate materials used, as well as methane loadings
3 4 5 6 7 8 9 10 11 12 13 14 15 16 17 18 19 20 21 22 23 24 25 26 27 28 29 30 31 32 33 34 35 36 37 38 39 40 41 42 43 44 45 46 47 48 49 50 51 52 53 54 55 56 57 58 59 60 61 62
applied, varied significantly. As part of the framework of a multidisciplinary study to assess the potential of passive methane oxidation biocovers (PMOB) to oxidize fugitive CH4 under
field conditions, three PMOBs were constructed within the existing final cover at the St-Nicéphore landfill, Quebec, Canada. Jugnia et al. (2008) analyzed the results obtained from PMOB-1, in which a mixture of sand and compost was used as substrate, and concluded that the mixture proved to be satisfactory in sustaining and promoting growth of methanotrophic bacteria. However, the methane loading into PMOB-1 was not controlled; as a consequence, it was not possible to determine the upper limit of methane loading that the biocover system would be able to oxidize.
The present study presents and analyses the results obtained during the 2008 monitoring campaign for PMOB-2 (the second system of the above-mentioned multidisciplinary study). For this particular PMOB, the same sand-compost mixture was used as substrate. However, the PMOB was lined with a geomembrane and biogas was fed through a gas distribution system, thereby allowing for control of the CH4 loading. According
to the pattern of results, the maximum capacity of the system does not seem to have been attained.
Materials and methods
Biocover setup
PMOB-2 (Fig. 1) measures 2.75m (W) × 9.75m (L) and follows a 3.5% slope. It was constructed within the existing final cover of the St-Nicéphore landfill, in an area where the waste mass is approximately 5-years old. PMOB-2 included a 0.80-m thick layer of substrate underlain by a 0.10-m thick gas distribution layer (GDL) consisting of 6.4-mm net gravel and 0.3 m of 12.7 mm net gravel. The substrate layer consists of a mixture of 5 volumes of
4 5 6 7 8 9 10 11 12 13 14 15 16 17 18 19 20 21 22 23 24 25 26 27 28 29 30 31 32 33 34 35 36 37 38 39 40 41 42 43 44 45 46 47 48 49 50 51 52 53 54 55 56 57 58 59 60
mature compost (before sieving through 12 mm industrial sieve) and 1 volume of coarse sand (D10 = 0.07mm; D85 = 0.8mm; Cu= 4.3). More details on the compost and the mixture
can be found in Jugnia et al. (2008). The substrate layer was placed in four 0.2-m layers and compacted with a vibrating plate to obtain layers with an average dry unit weight of 8.4 kN m
-3 and total porosity (n) equal to 0.63. The specific gravity (Gs) of the sand-compost mixture is
equal to 2.24.
PMOB-2 was lined using a 1-mm thick HDPE geomembrane (GM), which was protected from tearing by a geotextile sheet. As a consequence, the biocover section was hydraulically isolated from the rest of the existing landfill cover, permitting the gas flow boundary conditions to be controlled, while maintaining the same atmospheric boundary conditions as the rest of the existing landfill cover. A drainage system was installed at the lowest point to evacuate infiltrating waters. The experimental plot was thermally shielded from the outside environment by 0.15-m thick polystyrene along its sides. The goal was to prevent lateral migration of moisture due to thermal gradients.
Instrumentation and Initial Conditions
Temperature probes (HOBO U12, from Onset) and water content capacitance sensors (ECH2O EC-5, from Decagon Devices) were installed at four depths throughout the cover at each of the four monitoring points (Fig. 2). The temperature and water content probes were connected to data loggers. At the same points, aluminum tubes equipped with a septum at the top end were inserted in the soil at 6 different depths (7 in some cases), in order to determine gas profiles (Fig. 3). Meteorological data, including precipitation, atmospheric pressure and wind speed were recorded continuously by a weather station installed near the experimental plot.
3 4 5 6 7 8 9 10 11 12 13 14 15 16 17 18 19 20 21 22 23 24 25 26 27 28 29 30 31 32 33 34 35 36 37 38 39 40 41 42 43 44 45 46 47 48 49 50 51 52 53 54 55 56 57 58 59 60 61 62
In the beginning of the study period (May to November 2008), the experimental plot was totally covered with thick vegetation, which frequently had to be removed manually in order to access the gas probes.
Gas Loading
The experimental plot was fed with biogas extracted from a well installed in the waste mass (Fig. 2). It was decided to use natural biogas from the site to maintain actual in situ conditions, i.e. the actual biogas mixture. We also wanted to keep intact the natural ratio of the stable isotopes 13C and 12C and content of odor-causing components of the biogas (for further investigations on odor control). The biogas loading (or fluxes) fed into the system was controlled by means of a valve. In the beginning of the study period, the CH4 loading was
measured using a rotameter, with readings being made once or twice a week. Subsequently, the CH4 loading was monitored using a mass flow meter (Sage model
SID-050-DC-24-DIG-GAS) connected to a data acquisition system. Samples for evaluation the CH4 and CO2
concentrations were taken from the well and end-cap of feed system.
Over the study period, the CH4 load applied ranged from 0.3 g CH4 m-2 h-1 to 27 g CH4
m-2 h-1. The lower CH4 loading value adopted corresponds to what is considered ad hoc as a
residual loading that one would expect to find at the base of a landfill cover decades after closure of the site (0.5 l CH4 m-2 h-1; or 0.3 g CH4 m-2 h-1; Stegmann et al. (2007)).
As indicated in Table 1, the study was subdivided into four periods corresponding to the four different CH4 loadings. In the 1st period, the CH4 loading was steadily increased from
0.3 to 8 g CH4. m-2.h-1, which was the maximum that could be monitored by the rotameter
installed. During the 2nd period, the 8 g CH4. m-2.h-1 loading rate was maintained for several
4 5 6 7 8 9 10 11 12 13 14 15 16 17 18 19 20 21 22 23 24 25 26 27 28 29 30 31 32 33 34 35 36 37 38 39 40 41 42 43 44 45 46 47 48 49 50 51 52 53 54 55 56 57 58 59 60
meter allowing monitoring of higher loadings was installed and the loading was again steadily increased up to 16 g CH4. m-2.h-1. During the 4th period, the goal was to steadily increase the
loading again so as to double the latter value. However, the experimental site had to be closed for the winter in early November, when the loading was equal to 27 g CH4 m-2.h-1. As
will be shown, the PMOB was capable of oxidizing all of the methane under this flux rate. This means that an upper limit on the amount of methane oxidation possible with this PMOB was not inferred in this study.
Gas Concentration Profiles and Emission Measurements
Emission measurements included CH4 surface fluxes and surface scans of CH4
concentration. CH4 surface fluxes were measured following the static chamber method, at
five permanent different points on the experimental plot (Fig. 2). The perimeter of the Plexiglas® chamber was sealed with a bentonite paste to prevent dilution of the gas inside the chamber by atmospheric air. CH4 concentrations within the chamber were monitored
every 10 seconds over a 6 minute interval using a portable FID (TVA 1000B, Thermo Scientific) equipped with a data acquisition system. Fluxes (f) were calculated according to the equation:
f V C A t
'
' (1)
where f is the CH4 flux (mg/m²/s); V is the chamber volume (m³); A is the internal surface
area (m²); and 'C/'t represents the slope of the plot relating change in gas concentration to time (mg/m³/s). The test was considered acceptable when the determination coefficient was equal or superior to 80% (R2 ≥ 0.8), as recommended by the U.S. Environmental Protection Agency (2003) for control of gas emissions from landfills.
3 4 5 6 7 8 9 10 11 12 13 14 15 16 17 18 19 20 21 22 23 24 25 26 27 28 29 30 31 32 33 34 35 36 37 38 39 40 41 42 43 44 45 46 47 48 49 50 51 52 53 54 55 56 57 58 59 60 61 62
CH4 surface concentration scans were made using the FID, following a pre-defined
path inside the PMOB. Gas samples were obtained continuously every 5 seconds, with a probe maintained at a distance of approximately 1 cm above the surface. The data was then used to define iso-concentration curves by kriging.
CH4, CO2 and O2 concentration profiles within the PMOB were established from gas
samples collected from the aluminum gas probes and analyzed in situ using a portable gas meter (Columbus Instruments Inc.) equipped with infrared sensors able to detect CO2 and
CH4 on a scale from 0 – 100 vol% and an electrochemical sensor calibrated to detect O2 from
0-21 vol%. The N2 concentrations were obtained from the difference between 100% and the
sum of the concentrations of CO2, CH4 and O2. At various dates, the actual concentrations of
N2 were determined using a gas chromatograph (Micro GC 3000 A, Agilent).
Methanotroph Count
A previous study performed with samples from PMOB-1 (Cabral et al. 2007) showed that on average, the number of methanotrophic bacteria decreased quite abruptly within the first 0.4 m of depth from the surface. Based on these results, it was decided in the beginning of the 2008 monitoring season not to sample PMOB-2 for methanotroph count below the depth of 0.4 m. Substrate samples were collected monthly at three different points of the PMOB. The samples were taken from the uppermost part of the substrate (0-0.1, 0.1-0.2, 0.2-0.3 and 0.3-0.4 m) using PVC coring tubes (internal diameter = 0.5 m). Equal volumes of samples from the same depths were mixed to form composite samples that were used for methanotroph counts.
The cores were kept at 4ºC and methanotroph counts were performed following the most probable number (MPN) method within 24 hours. For this, soil slurries from the
4 5 6 7 8 9 10 11 12 13 14 15 16 17 18 19 20 21 22 23 24 25 26 27 28 29 30 31 32 33 34 35 36 37 38 39 40 41 42 43 44 45 46 47 48 49 50 51 52 53 54 55 56 57 58 59 60
composite samples were serially diluted in 96-well plates (microtiter) containing ammonium mineral salts medium. Fresh soil (5 g) was suspended in 45 ml of a mineral salts medium (Heyer 2002) and shaken for 1 hour. Two hundred μl of this suspension was placed in the first well of a 96-well microtiter plate which consists of 12 wells. Serial 10-fold dilutions were performed from the second well to the 11th well with transfers of 20 μl to the next wells, containing 180 μl of mineral medium, using a multichannel pipettor. The 12th well contained only mineral medium and was used as the control. Thereafter, the plates were incubated for 4 weeks at 25ºC in gastight jars containing 18% CH4 in air. After incubation, all plates were
read using a microplate reader and the MPN calculated from the dilution factor and dry weight of the soil.
Results and Discussion
Methane Removal Efficiency
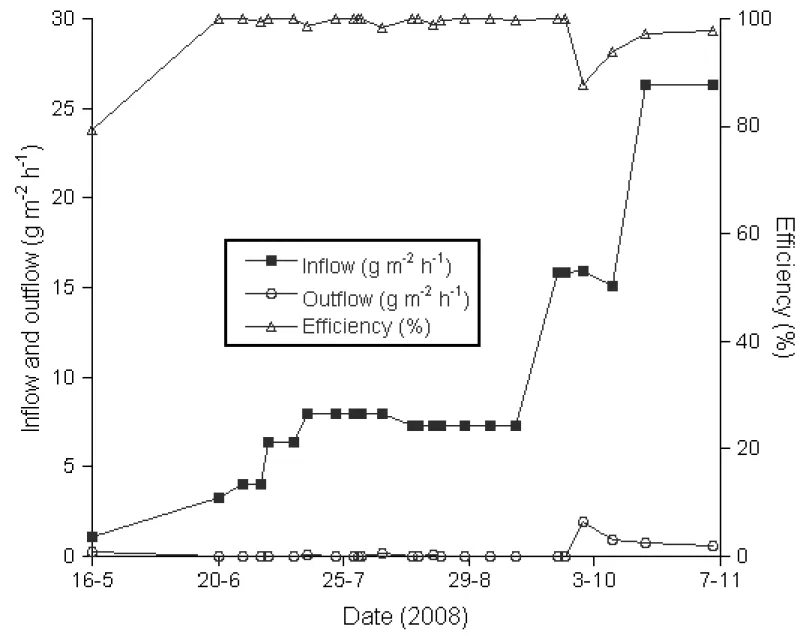
Fig. 4 shows the evolution with time of the oxidation efficiency, CH4 loading and emission
rate. It can be observed that the CH4 loading increased steadily up to mid-July, when it was
left constant for a while. The associated outflow remained always close to nil or below detectable limits, which results in almost 100% efficiencies. By mid-September, the CH4
loading was increased rapidly and a relatively higher outflow was measured on Oct. 3. But the system responded very well and the calculated efficiencies increased back again after Oct. 3 to values very close to 100%.
In Fig. 5, the relationship between CH4 loading and absolute CH4 removal rates can be
observed. The CH4 removal rate is equal to the difference between methane loading and
3 4 5 6 7 8 9 10 11 12 13 14 15 16 17 18 19 20 21 22 23 24 25 26 27 28 29 30 31 32 33 34 35 36 37 38 39 40 41 42 43 44 45 46 47 48 49 50 51 52 53 54 55 56 57 58 59 60 61 62
increasing loading; and the high determination coefficient obtained (R2 = 0.99) indicates that the variability in the mass of CH4 being supplied to the gas distribution layer below the
biocover was the sole contributor to the variability in the CH4 removal rate. Consequently, it is
possible to anticipate that the maximum possible removal rate for this particular biocover was not reached at the end of this study.
Typical scans of methane concentrations at the surface of PMOB-2 are shown in Fig. 6. Due to the high oxidation efficiency of the biocover (Fig. 4), recorded concentrations of CH4
at the surface remained quite low throughout the study; and were below the maximum concentration allowed by the Quebec landfill regulations, i.e. 500 ppm. The observed low concentrations of CH4 along the PMOB-2’s perimeter, as well as variability in the locations of
registered peaks, can be interpreted as an indication that the seal along the interface between the substrate and the geomembrane was good enough to prevent gas leaks. As a consequence, the surface point measurements can be considered representative of the entire surface of the PMOB.
Gas profiles representative of the four periods into which the study was subdivided, are shown in Fig. 7. The profiles relative to the 1st period (Fig. 7a) showed that CH4 was
practically absent throughout the profile. The only plausible explanation for this observation is that CH4 was being completely oxidized; even as deep as the interface between the
substrate and the gas distribution layer (0.82 m). Indeed, N2 concentrations at 0.82 m were
similar to those found in atmospheric air, which means that the air supply – thus O2 – was not
a limiting factor. Nonetheless, the low O2 concentrations deep down can be related to the fact
that O2 was immediately consumed as it became available.
The concentration of CH4 at the bottom of PMOB-2 (0.82 m) gradually increased with
4 5 6 7 8 9 10 11 12 13 14 15 16 17 18 19 20 21 22 23 24 25 26 27 28 29 30 31 32 33 34 35 36 37 38 39 40 41 42 43 44 45 46 47 48 49 50 51 52 53 54 55 56 57 58 59 60
concentration, which means that the O2 supply necessary for biotic degradation of CH4 also
decreased. The CH4 concentrations normally found in landfill biogas (in the vicinity of 55%;
Bogner et al. 1995; Börjesson et al. 2001) were observed at the bottom of PMOB-2, only when the CH4 loading reached 27 g CH4 m−2 h-1 (Fig. 7d).
The steep declines in CH4 concentrations shown in Fig. 7 b, c, d indicate that the
oxidation front would be located quite deep in the PMOB (near a depth of 0.60 m) throughout the last three periods of CH4 loadings. Humer and Lechner (2001) found, in a field test where
sewage sludge and MSW compost were used as substrate, that the maximum CH4 oxidation
zone extended from 0.4 and 0.9 m deep.
It can be hypothesized that the presence of N2 deep down for an extended period of
time was enough of a proof that the incoming biogas was being diluted. However, it can be observed in Fig. 7 that the CO2 concentration deep down was similar for periods 3 and 4. For
this to happen CO2 production must have taken place, otherwise the CO2 would have been
diluted to the same extent as the CH4.
The results presented above are quite different from those obtained for PMOB-1 (Rannaud et al. 2009), which differed from PMOB-2 only by the fact that it was not lined with a geomembrane. As a consequence, the gas distribution layer sits directly upon the waste mass and the biogas loading cannot be determined. Indeed, typical gas profiles for PMOB-1 show that CH4 concentrations were usually high deep down (as compared to PMOB-2) and,
with the exception of some short periods of draught, they remained high along the entire profile (Rannaud et al. 2009). Given the fact that the degrees of saturation of PMOB-1 and 2 were within the same range for all depths during the study period (see discussion below), one can conclude that very high upward biogas loadings in PMOB-1 (roughly estimated to be in
3 4 5 6 7 8 9 10 11 12 13 14 15 16 17 18 19 20 21 22 23 24 25 26 27 28 29 30 31 32 33 34 35 36 37 38 39 40 41 42 43 44 45 46 47 48 49 50 51 52 53 54 55 56 57 58 59 60 61 62
the order of 400 g CH4 m−2 h-1) must have prevented the downward migration of atmospheric
O2, thereby precluding CH4 oxidation.
In addition, in the beginning of the 2008 study period, the CH4 loading applied to
PMOB-2 was nil and thick vegetation (canary grass, peas, etc.) had developed on its surface. Given the fact that vegetation is known to increase rhizosphere-related microbial activity (e.g. Denier van der Gon 1996; Hilger and Humer 2003; Stralis-Pavese et al. 2004; Tanthachoon et al. 2008), it is highly possible that the establishment of vegetation had a positive impact on the performance of PMOB-2. However, this discussion is beyond the scope of the present paper, and no particular investigation was made concerning this matter.
Degree of Saturation within the Biocover
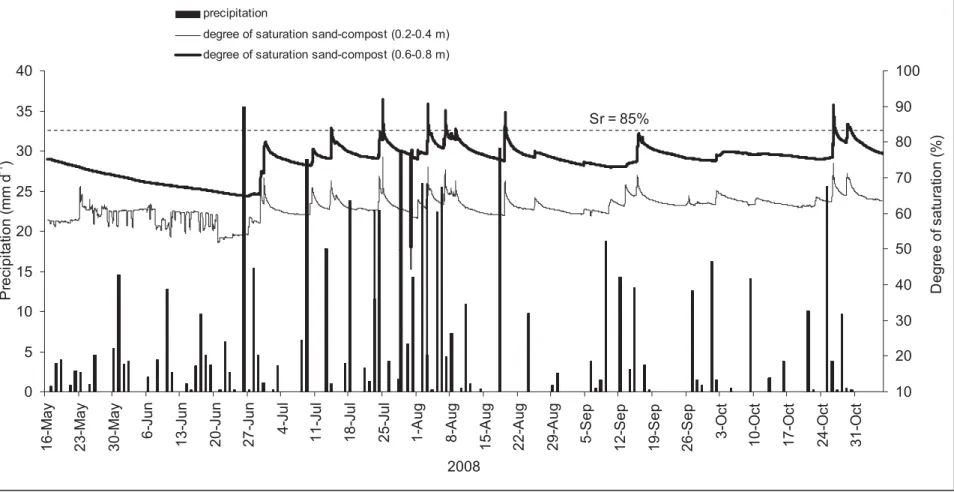
The evolutions of the degree of water saturation (Sr) within PMOB-2 and precipitation,
during the study period, are presented Fig. 8. Only the average Sr values obtained for the two
sub-layers, i.e. from 0.2 to 0.4 m and 0.6 to 0.8 m, are presented. The Sr values were
calculated using volumetric water content data and the porosity (n = 0.63). As a crosscheck, these Sr values were compared to those obtained from a Sr vs suction plot (water retention
curve of the material; data not shown), where suction measurements were obtained from tensiometers installed on the experimental plot (Fig. 3). A t-test analysis (results not shown) revealed no statistically significant difference between the two sets of data, i.e. between the calculated degrees of saturation and the degrees of saturation corresponding to measured suction values.
The degree of saturation of the substrate in PMOB-2 was sensitive to variations in the precipitation level. Indeed, peaks in precipitation levels associated with Sr values higher than
4 5 6 7 8 9 10 11 12 13 14 15 16 17 18 19 20 21 22 23 24 25 26 27 28 29 30 31 32 33 34 35 36 37 38 39 40 41 42 43 44 45 46 47 48 49 50 51 52 53 54 55 56 57 58 59 60
following continuous precipitation events. Otherwise, Sr values during the present study averaged 61.5 ± 3.5% at the topmost part of the PMOB (surface to 0.4 m deep) and 74.7 ± 4.8% within the bottom-most part (0.4 to 0.8 m). These average degrees of saturation values in the PMOB were then lower than 85%, which corresponds approximately to the degree of saturation value beyond which air becomes occluded in fine grained soils (Brooks and Corey 1966; Nagaraj et al. 2006). In addition, according to Nicholson et al. (1989), Yanful (1993), Aachib et al. (2004) and Cabral et al. (2004), gas fluxes become quite low when the value of Sr approaches 85%. Simulations performed by Rannaud et al. (2009) with Sr values in the
vicinity of 85% resulted in very limited, to no penetration of O2, irrespective of the loadings
applied. It can thus be inferred that high Sr would result in extremely low O2 concentrations
even at shallow depths, which would induce a significant decrease in microbial oxidation activity.
No correlation was found between Sr and the methane oxidation rate in the present study. It can thus be inferred that Sr values observed were within the optimal range for CH4
oxidation to occur under the field conditions prevailing in PMOB-2.
It is relevant to note that the biocover substrate used in this experiment retains more moisture than most mineral soil covers; its volumetric water content varied between 32.0 and 63.0%, with this latter value occurring only very sporadically. Stern et al. (2007) concluded that biocover cells were more successful in oxidizing CH4 when the retention times were long
enough and desiccation was avoided as much as possible.
Temperature within the Biocover
Characteristic values of temperature obtained from the temperature probes placed in PMOB-2 indicated that temperatures in the top part of the PMOB (0.10 - 0.25 m) exceeded
3 4 5 6 7 8 9 10 11 12 13 14 15 16 17 18 19 20 21 22 23 24 25 26 27 28 29 30 31 32 33 34 35 36 37 38 39 40 41 42 43 44 45 46 47 48 49 50 51 52 53 54 55 56 57 58 59 60 61 62
the outside air temperature (Fig. 9). The combined effects of the warm landfill gas supplied and the heat generated by microbial activity are at the origin of this difference in temperature. However, when the air temperature started to drop, the bottom of the PMOB (0.45 – 0.70 m) became warmer than the top (Fig. 9), which is directly affected by outside weather conditions. As shown in Table 2, there was only a small difference between average temperature values measured near the surface (20.1˚C at 0.10 m) and deeper into the substrate (18.7 ˚C at 0.75 m). Gebert and Gröngröft (2006), who employed a much coarser substrate, obtained higher temperatures at the bottom of their biofiltre experiment in the field. These authors suggested that the top layer is subjected to considerably higher, but also to considerably lower temperatures, presumably inducing higher and lower oxidation rates, than in the deeper layers. In the present study, the active oxidation zone seems to be located between 0.60 – 0.80 m, exactly within the region where a more constant temperature regime was observed (Fig. 9). The high temperatures at the top layers during the warmer months can be partly explained by aerobic activity and oxidation of organic matter. When the outside temperature started to drop, the bottom of the PMOB became warmer than the top (Fig. 9).
A statistical analysis performed using soil temperature and methane removal rate data led to an unusual negative correlation (-0.9; p>0.001) between the two variables. Usually, methane removal rates (or for that matter, oxidation rates) increase with the increase in temperatures (e.g. Börjesson et al. 2004). In the present case, the statistical analysis does not reflect the physical phenomena, because the CH4 loading was being increased precisely
during the time of the year when the air temperature was starting to fall, causing a decrease in soil temperature, particularly near the surface (Fig. 9; the average temperature at the bottom of the PMOB was almost the same throughout the experiment). Nevertheless, despite
4 5 6 7 8 9 10 11 12 13 14 15 16 17 18 19 20 21 22 23 24 25 26 27 28 29 30 31 32 33 34 35 36 37 38 39 40 41 42 43 44 45 46 47 48 49 50 51 52 53 54 55 56 57 58 59 60
the decrease in soil temperature and the increase in CH4 loading, almost 100% of the CH4
was still being oxidized.
Gebert et al. (2003) claim that, during the winter, biofilters and biocovers may still be operated successfully, since, as the temperature in the soil drops, the methanotrophic population composition can adapt.
Methanotrophs and CH4 Abatement
As shown in Fig. 10, the mean number of methanotrophs did not decrease considerably with depth, ranging from 7.82 ± 4.45 108 CFU g_dw-1 near the surface (0- 0.10 cm) to 1.73 ± 1.14 x 10⁸ CFU g_dw-1 soil at the bottom (0.3 – 0.4 m). These densities are in
the upper range of values reported in the literature and are comparable to those found by Gebert et al. (2003) (1.3 x 10⁸ to 7.1 x 10⁹ cells g_dw-1) for a biofilter that was able to oxidize 80 g CH4 m-3 h-1, with absolute removal rates linearly correlated to the amount of methane
entering the filter (such as illustrated in Fig. 5). Such uniform distribution profiles of methanotrophs suggest that the first 0.4 m of PMOB-2 offered optimal growth conditions. As mentioned previously (discussion relating to Fig. 7), air penetrated deep into the PMOB and, as a result, the molecular O2 required by methanotrophs for CH4 oxidation was not a limiting
factor. Therefore, under the conditions that prevailed within PMOB-2 during this study, it is plausible to presume that the number of methanotrophs within the bottom layer (0.4 – 0.8 m; where samples were not collected from for microbial analyses) was as high as in the top layer. This would support the statement made previously that the potential removal rate obtained for PMOB-2 has possibly not been reached during this study.
Comparison of Biocover Performance to Methane Removal Rates Found for Other Biofilters and in Landfill Covers
3 4 5 6 7 8 9 10 11 12 13 14 15 16 17 18 19 20 21 22 23 24 25 26 27 28 29 30 31 32 33 34 35 36 37 38 39 40 41 42 43 44 45 46 47 48 49 50 51 52 53 54 55 56 57 58 59 60 61 62
Table 3 presents the CH4 removal rates for several biofilter and biocover studies. The
performance of the 0.8-m thick PMOB investigated in the present study, during which a removal rate of 27 g CH4 m−2 h−1 (or 33.8 g CH4 m−3 h−1) was achieved under relatively low
air temperatures (Fig. 9), is much higher than those found for the other selected landfill covers. However, the reported removal rates in Table 3 were limited to the low CH4 loadings
to which the covers were submitted in the field. It is therefore possible that higher removal rates might have been achieved had higher loadings be applied (unfortunately, monitoring had to be terminated because the site had to be closed for the winter). PMOB-2 was the only biocover in the list submitted to controlled CH4 loading (biofilters are always submitted to
controlled loadings).
The performance of PMOB-2 also compares rather well with the biofilters presented in Table 3, which were, with the exception of the one performed by Gebert and Gröngröft (2006), tested under the controlled conditions prevailing in the laboratory. Furthermore, if the compost added to the mixture used as substrate for PMOB-2 had not been sieved (as was the case with the sewage and waste compost used in Humer and Lechner’s (2000) biocover study), a higher air-filled porosity would have been obtained, and the substrate would have been even more aerated, further facilitating CH4 oxidation.
Final comments and conclusions
An experimental biocover constructed on top of the existing final cover at the St-Nicéphore landfill was tested under increasing CH4 loadings. The results show that practically
all the CH4 provided to the system was oxidized, with a maximum removal rate of 27 g m−2
h−1 attained at the end of the study period, when the experimental site had to be closed for the winter. At this moment, a sharp decrease in temperature near the surface of the substrate
4 5 6 7 8 9 10 11 12 13 14 15 16 17 18 19 20 21 22 23 24 25 26 27 28 29 30 31 32 33 34 35 36 37 38 39 40 41 42 43 44 45 46 47 48 49 50 51 52 53 54 55 56 57 58 59 60
was being registered, while the air temperature varied widely during the day (reaching 0ºC during the night), and the temperature deeper into the PMOB decreased, but not as steeply as near the surface.
The results also show that the absolute removal rates were linearly correlated to CH4
loading, that the methanotrophs were present in great numbers near the surface, and that the oxidation zone was established between 0.6-0.8 m. In this bottom-most zone, we did not perform counts of methanotrophs, but we anticipate that they were present in great numbers given the conditions prevailing at these depths. All this leads to the conclusion that the maximum potential of PMOB-2 to oxidize CH4 has not been reached. This is of great
importance when considering that the oxidation rate attained far exceeds what has been considered as the residual loading one would expect to find at the base of a landfill cover decades after closure, i.e. 0.3 g CH4 m-2 h-1.
Acknowledgements
We wish to thank the numerous students involved in the project, namely C. Roncato, M. Capanema, F. Lenzi, and M. Létourneau. The invaluable help of Jean-Guy Lemelin, technician, must also be particularly acknowledged. This work was supported by a grant from the Natural Science and Engineering Research Council of Canada (NSERC), BIOCAP Foundation Canada, the Biotechnology Research Institute (NRC) and Waste Management Canada under strategic grant # GHG 322418-0. When finalizing this manuscript, the 1st Author was working as Visiting Professor at the Federal University of Santa Catarina, Brazil, with a grant from CAPES/Brazil.
3 4 5 6 7 8 9 10 11 12 13 14 15 16 17 18 19 20 21 22 23 24 25 26 27 28 29 30 31 32 33 34 35 36 37 38 39 40 41 42 43 44 45 46 47 48 49 50 51 52 53 54 55 56 57 58 59 60 61 62
Aachib, M., Mbonimpa, M., and Aubertin, M. (2004). "Measurement and prediction of the oxygen diffusion coefficient in unsaturated media, with applications to soil covers." Water, Air, and Soil Pollution, 156(1), 163-193.
Ait-Benichou, S., Jugnia, L.-B., Greer, C. W., and Cabral, A. R. (2009). "Methanotrophs and methanotrophic activity in engineered landfill biocovers." Waste Management, 29(9), 2509-2517.
Barlaz, M. A., Green , R.B., Chanton , J.P., Goldsmith, C.D., And, Hater, G.R. (2004). "Evaluation of a Biologically Active Cover for Mitigation of Landfill Gas Emissions." Environ. Sci. Technol., 38(18), 4891-4899.
Bogner, J., Spokas, K., Burton, E., Sweeney, R., and Corona, V. (1995). "Landfills as atmospheric methane sources and sinks." Chemosphere, 31(9), 4119.
Börjesson, G., Chanton, J., and Svensson, B. H. (2001). "Methane oxidation in two Swedish landfill covers measured with carbon-13 to carbon-12 isotope ratios." J. Environ. Qual., 30, 369-376.
Börjesson, G., Sundh, I., and Svensson, B. (2004). "Microbial oxidation of CH4 at different temperatures in landfill cover soils." Fems Microbiology Ecology, 48(3), 305-312. Brooks, R. H., and Corey, A. T. (1966). "Poperties of Porous Media Afecting Fluid Fow."
Journal Irrig. and Drainage Div., ASCE(June), 61-88.
Cabral, A. R., Arteaga, K., Rannaud, D., Aït-Benichou, S., Pouët, M. F., Allaire, S., Jugnia, L.-B., and Greer, C. W. (2007). "Analysis of methane oxidation and dynamics of methanotrophs within a passive methane oxidation barrier." 11th International Waste Management and Landfill Symposium, Sta. M. di Pula, Italy.
4 5 6 7 8 9 10 11 12 13 14 15 16 17 18 19 20 21 22 23 24 25 26 27 28 29 30 31 32 33 34 35 36 37 38 39 40 41 42 43 44 45 46 47 48 49 50 51 52 53 54 55 56 57 58 59 60
Cabral, A. R., Capanema, M. A., Gebert, J., Moreira, J. F., and Jugnia, L. B. (2009). "Quantifying microbial methane oxidation efficiencies in two experimental landfill biocovers using stable isotopes." Water, Air, and Soil Pollution, In press.
Cabral, A. R., Tremblay, P., and Lefebvre, G. (2004). "Determination of the diffusion coefficient of oxygen for a cover system composed of pulp and paper residues." Geot. Testing J., 27(2), 184-197.
Chanton, J. P., and Liptay, K. (2000). "Seasonal Variation in Methane Oxidation in a Landfill Cover Soil as Determined by an In situ Stable Isotope Technique." Global Biogeochem. Cycles, 14, 51-60.
Denier van der Gon, H. A. C. N., H.-U. (1996). "Oxidation of methane in the rhizosphere of rice plants." Biol. Fertil. Soils, 22, 359-366.
Gebert, J., and Gröngröft, A. (2006). "Performance of a passively vented field-scale biofilter for the microbial oxidation of landfill methane." Waste Management, 26(4), 399-407. Gebert, J., Gröngröft, A., and Miehlich, G. (2003). "Kinetics of microbial landfill methane
oxidation in biofilters." Waste Management, 23(7), 609-619.
Hanson, R. S., and Hanson, T. E. (1996). "Methanotrophic bacteria." Microbiol. Rev., 60, 439-471.
Heyer, J., Galchenko, V.F., and Dunfield, P.F. (2002). "Molecular phylogeny of type II methaneoxidizing bacteria isolated from various environments." Microbiology, 148, 2831-2846.
Hilger, H., and Humer, M. (2003). "Biotic Landfill Cover Treatments for Mitigating Methane Emissions." Environmental Monitoring and Assessment, 84(1), 71-84.
3 4 5 6 7 8 9 10 11 12 13 14 15 16 17 18 19 20 21 22 23 24 25 26 27 28 29 30 31 32 33 34 35 36 37 38 39 40 41 42 43 44 45 46 47 48 49 50 51 52 53 54 55 56 57 58 59 60 61 62
Humer, M., and Lechner, P. (1999). "Alternative approach to the elimination of greenhouse gases from old landfills." Waste Management Research(17), 443-452.
Humer, M., and Lechner, P. (2000). "Methane oxidation in optimized landfill cover layers under different seasonal conditions." Proceedings of 1st Intercontinental Landfill
Research Symposia, Lulea, Sweden, CD-Rom.
Humer, M., and Lechner, P. (2001). "Microbial Methane Oxidation for the Reduction of Landfill Gas Emissions." Journal of Solid Waste Technology and Management, Vol. 27, No. 3-4.
IPCC. (2001). "Climate Change 2001: The Scientific Basis. Contribution of Working Group I to the Third Assessment Report of the Intergovernmental Panel on Climate Change." IPCC, Cambridge.
IPCC. (2007). "Climate change 2007: Mitigation. Contr. Working Group III to the 4th Assess Report of the IPCC." <http://www.ipcc.ch/ipccreports/ar4-wg3.htm>.
Jugnia, L. B., Cabral, A. R., and Greer, C. W. (2008). "Biotic methane oxidation within an instrumented experimental landfill cover." Ecological Engineering, Vol 33(2), 102-109. Nagaraj, T. S., Lutenegger, A. J., Pandian, N. S., and Manoj, M. (2006). "Rapid estimation of
compaction parameters for field control." Geotechnical Testing Journal, 29(6), 497-506.
Nicholson, R. V., Gillham, M., Cherry, J. A., and Reardon, E. J. (1989). "Reduction of acid generation in mine tailings through the use of moisture-retaining cover layers as oxygen barriers." Canadian Geotechnical Journal, 26, 1-8.
Rannaud, D., Cabral, A., and Allaire, S. E. (2009). "Modeling methane migration and oxidation in landfill cover materials with TOUGH2-LGM." Water, Air, and Soil Pollution, 198(1-4), 253-267.
4 5 6 7 8 9 10 11 12 13 14 15 16 17 18 19 20 21 22 23 24 25 26 27 28 29 30 31 32 33 34 35 36 37 38 39 40 41 42 43 44 45 46 47 48 49 50 51 52 53 54 55 56 57 58 59 60
Stegmann, R., Heyer, K.-U., and Hupe, K. (2007). "Landfill Aftercare - Duration, strategies and closure criteria." 2nd BOKU Waste Conference, Vienna, Austria, 349-335.
Stern, J. C., Chanton, J., Abichou, T., Powelson, D., Yuan, L., Escoriza, S., and Bogner, J. (2007). "Use of a biologically active cover to reduce landfill methane emissions and enhance methane oxidation." Waste Management, 27(9), 1248-1258.
Stralis-Pavese, N., Sessitsch, A., Weilharter, A., Reichenauer, T., Riesing, J., Csontos, J., Murrell, J. C., and Bodrossy, L. (2004). "Optimization of diagnostic microarray for application in analysing landfill methanotroph communities under different plant covers." Environmental Microbiology, 6(4), 347-363.
Tanthachoon, N., Chiemchaisri, C., Chiemchaisri, W., Tudsri, S., and Kumar, S. (2008). "Methane oxidation in compost-based landfill cover with vegetation during wet and dry conditions in the tropics." Journal of the Air and Waste Management Association, 58(5), 603-612.
USEPA. (2003). "Inventory of US greenhouse gas emissions and sinks, 1990-2001." EPA 430-R-03-004, U.S. Environmental Protection Agency.
Whalen, S. C., Reeburgh, W. S., and Sandbeck, K. A. (1990). "Rapid methane oxidation in a landfill cover soil." Appl. Environ. Microbiol., 56, 3405-3411.
Yanful, E. K. (1993). "Oxygen Diffusion through Soil Covers on Sulphidic Mine Tailings." Journal of Geotechnical Engineering-ASCE, 119(8), 1207-1228.
List of Tables
3 4 5 6 7 8 9 10 11 12 13 14 15 16 17 18 19 20 21 22 23 24 25 26 27 28 29 30 31 32 33 34 35 36 37 38 39 40 41 42 43 44 45 46 47 48 49 50 51 52 53 54 55 56 57 58 59 60 61 62
Table 2 - Minimum (Min), maximum (Max) and average temperature values within the BOPM-2
Table 3 – Methane removal rates by biofilters and landfill (bio)covers
List of Figures
Fig. 1. Cross Section of BOMP-2
Fig. 2. Position of the instrumentation profiles and surface flux measurement Fig. 3. Instrumentation installed in PMOB-2
Fig. 4. Oxidation efficiency, methane loading and emissions as determined from surface emissions
Fig. 5. Methane removal rates as a function of CH4 loading
Fig. 6. Representative surface scans of CH4 concentrations for each loading period
Fig. 7. Representative gas profiles for each CH4 loading period
Fig. 8. Evolution of (a) precipitation and degree of saturation in the PMOB-2 in 2008 Fig. 9. Evolution temperature within the PMOB-2 in 2008 (top and bottom sub-layers) Fig. 10. Distribution with depth of the mean values of methanotroph counts within PMOB-2
1 2 3 4 5 6 7 8 9 10 11 12 13 14 15 16 17 18 19 20 21 22 23 24 25 26 27 28 29 30 31 32 33 34 35 36 37 38 39 40 41 42 43 44 45 46 47 48 49 50 51 52 53 54 55 56 57 58 59 60
Table 1 – CH4 loadings applied to PMOB-2 for each period
Time (in 2008) Load (gCH4 m-2 h-1) May to Mid-July ~ 0.3 to 8 Mid-July to September ~ 8 September to October ~ 16
3 4 5 6 7 8 9 10 11 12 13 14 15 16 17 18 19 20 21 22 23 24 25 26 27 28 29 30 31 32 33 34 35 36 37 38 39 40 41 42 43 44 45 46 47 48 49 50 51 52 53 54 55 56 57 58 59 60 61 62
Table 2 - Minimum (Min), maximum (Max) and average temperature values within BOPM-2
Depth from Surface (m) Average, °C MAX, °C MIN, °C
0 (air) 16.2 26 0
10 20.1 28.8 5.2
25 19.9 25.3 8.5
45 19.4 23.7 9.1
4 5 6 7 8 9 10 11 12 13 14 15 16 17 18 19 20 21 22 23 24 25 26 27 28 29 30 31 32 33 34 35 36 37 38 39 40 41 42 43 44 45 46 47 48 49 50 51 52 53 54 55 56 57 58 59 60
Table 3 – Methane removal rates by biofilters and landfill (bio)covers
Reference Substrate material System Temp. (°C)
CH4 removal rate (g m−3 h−1 for biofilters) (g m−2 h−1 for biocovers) Whalen et al. (1990) Loamy landfill cover Biocover 25 2 Jones and Nedwell (1993) Humic landfill cover Biocover 22 0.3 Kightley et al. (1995) Sandy landfill cover Biocover 20 5–7 Humer and Lechner (2000) Sewage sludge and waste composts Biocover 18 1–16 Stern et. Al (2007) Pre-composted yard or garden waste placed Biocover 25.7 ± 8.8 2
Sly et al. (1993) Glass tubes Biolfilter - 21
Figueroa (1996) Compost Biolfilter 43 50
Streese and
Stegmann (2003) Compost Biolfilter 30 65
Wilshusen et al.
(2004) Compost Biolfilter
Room
temperature 4.1
Melse and Var
der Werf (2005) Compost -perlite Biolfilter 12 11–15 Gebert and
Gröngröft (2006) Expanded clay Biolfilter
3 – 24 (avg 12 °C° in
the soil) Max 80
This study
(PMOB-2) Sand/Compost Biocover See Fig. 9
27
(maximum not reached; test discontinued when site had to be closed for
Biogas well
Water drainage
Slope
(3.5%)
Mass flowmeter
(rotameter before
Set 08)
9.75 m
(0;0)
2.75 m
Surface
measurement
Profiles
Gas G T T \ suction Water content Temperature Gas G T T \ suction Water content Temperature \ G G G G T T T T T 0.65 m 0. 65 m T T T \ \ \ 0.20 m G G - 0.2 m - 0.4 m - 0.6 m - 0.8 m - 0.1 m - 0.25 m - 0.45 m - 0.7 m - 0.2 m - 0.4 m - 0.6 m - 0.8 m - 0.1 m - 0.2 m - 0.3 m - 0.4 m - 0.6 m - 0.82 m G T T \ Gas Tensiometer
Water contentTemperature
0 1 2 3 0 1 2 3 4 5 6 7 8 9 10 0 1 2 3 0 1 2 3 4 5 6 7 8 9 10 0 15 30 45 60 75 90 105 120 135 150 165 180 195 210 225 240 255 270 285 300 315 330 345 360 ppm CH4 0 1 2 3 0 1 2 3 4 5 6 7 8 9 10 0 1 2 3 0 1 2 3 4 5 6 7 8 9 10
(a) Period 1 (b) Period 2 (c) Period 3 (d) Period 4
Slope 3.5% Max = 102 ppm Max = 101 ppm Max = 362 ppm Max = 369 ppm
0 20 40 60 80 100 0 0.1 0.2 0.3 0.4 0.5 0.6 0.7 0.8 CH 4 O 2 CO 2 N 2 Gas Concentration% S U B S T R A T E (a) Period 1 0 20 40 60 80 100 0 0,1 0,2 0,3 0,4 0,5 0,6 0,7 0,8 Gas Concentration% S U B S T R A T E (b)Period 2 0 20 40 60 80 100 0 0,1 0,2 0,3 0,4 0,5 0,6 0,7 0,8 Gas Concentration% S U B S T R A T E (c) Period 3 0 20 40 60 80 100 0 0,1 0,2 0,3 0,4 0,5 0,6 0,7 0,8 Gas Concentration% S U B S T R A T E (d) Period 4 Fig. 7. Representative gas profiles for each CH4 loading period
0 5 10 15 20 25 30 35 40 16-M ay 23-M ay 30-M ay 6-Ju n 13 -J un 20 -J un 27 -J un 4-Jul 11 -J u l 18 -J u l 25 -J u l 1-A u g 8-A u g 15 -A ug 22 -A ug 29 -A ug 5-S e p 12-S e p 19-S e p 26-S e p 3-O ct 10 -O ct 17 -O ct 24 -O ct 31 -O ct 2008 P re cip ita tio n ( m m d -1 ) 10 20 30 40 50 60 70 80 90 100 D e g ree o f s a tur a tio n (% ) precipitation
degree of saturation sand-compost (0.2-0.4 m) degree of saturation sand-compost (0.6-0.8 m)
Sr = 85%
0 5 10 15 20 25 30
22-May 11-Jun 1-Jul 21-Jul 10-Aug 30-Aug 19-Sep 9-Oct 29-Oct
2008 Tem p er a tur e ( °C )
Tair taken from the Envir.
Canada database, because of problems with weather station
o CH4 influx loads 1 to 8 g m-2 h-1 8 g m-2 h-1 16 g m-2 h-1 27 g m-2 h-1 Tair ( C) Top layer (0.10 - 0.25 m) Bottom layer (0.45 - 0.70 m)
1.0E+00 1.0E+02 1.0E+04 1.0E+06 1.0E+08 1.0E+10 0 - 0.1 m 0.1 - 0.2 m 0.2 - 0.3 m 0.3 - 0.4 m Depths (m) M P N of m e tha not rophs /g s oi l