HAL Id: tel-01139146
https://pastel.archives-ouvertes.fr/tel-01139146
Submitted on 3 Apr 2015HAL is a multi-disciplinary open access archive for the deposit and dissemination of sci-entific research documents, whether they are pub-lished or not. The documents may come from teaching and research institutions in France or abroad, or from public or private research centers.
L’archive ouverte pluridisciplinaire HAL, est destinée au dépôt et à la diffusion de documents scientifiques de niveau recherche, publiés ou non, émanant des établissements d’enseignement et de recherche français ou étrangers, des laboratoires publics ou privés.
Design and engineering of barrier materials including
nano-adsorbents
Xiaoyi Fang
To cite this version:
Xiaoyi Fang. Design and engineering of barrier materials including nano-adsorbents. Food engineering. AgroParisTech, 2013. English. �NNT : 2013AGPT0055�. �tel-01139146�
N°: 2009 ENAM XXXX
AgroParisTech
UMR AgroParisTech/INRA Ingénierie Procédés Aliments GENIAL 1145
1, avenue des Olympiades
présentée et soutenue publiquement par
Xiaoyi FANG
13 Septembre 2013Conception raisonnée de matériaux barrière incorporant des
nano-adsorbants
Doctorat ParisTech
T H È S E
pour obtenir le grade de docteur délivré par
L’Institut des Sciences et Industries
du Vivant et de l’Environnement
(AgroParisTech)
Spécialité : Sciences et Procédés des Aliments et Bioproduits
Directeur de thèse : Violette DUCRUET Co-encadrement de la thèse : Olivier VITRAC
Jury
M. Stéphane MARAIS, Professeur, UMR 6270, Université de Rouen Rapporteur M. Hendrik MEYER, Chargé de recherches-HDR, CNRS, Institut Charles Sadron Rapporteur M. Eric FAVRE, Professeur, UMR 7274, ENSIC, Université de Lorraine Examinateur M. Luc AVEROUS, Professeur, UMR 7515, ECPM, Université de Strasbourg Examinateur
Mme. Violette DUCRUET, Ingénieur de recherche-HDR, UMR 1145, INRA Directrice de Thèse M. Olivier VITRAC, Chargé de recherches, UMR 1145, INRA Co-encadrant
A
CKNOWLEDGMENTS
I would like to acknowledge Dr Violette Ducruet, Dr Olivier Vitrac and Dr Sandra Domenek for their continuous guidance, suggestions and encouragements.
I would like to express my friendship to all students, postdocs and technicians helping me in my experiments and discovering the pleasure of France: Cecile Courgneau, Anna Patsioura, Etzael Espino-Perez, Jean-Michael Vauvre, Phuong-Mai Nguyen, Thomas Verroust, Romulo Salazar.
The presented work would not have been possible without the technical assistance of Cedric Plessis in sorption and analytical experiments and without the assistance of Frédéric Jamme at Synchrotron Soleil.
T
ABLE OF CONTENTS
Chapter 1. Introduction ... 1
Chapter 2. Literature review ... 9
Diffusion in food packaging materials ... 13
2.1
Abstract ... 162.1.1 Introduction ... 16
2.1.2 The concepts of “generally recognized diffusion models” in legal US and EU 2.1.3 systems ... 18
Some generalities about diffusion ... 21
2.1.4 2.1.4.1 Mass transfer from and to food packaging materials ... 21
2.1.4.1.1 Sorption of food constituent into food packaging: first observation of the reality of diffusion ... 21
2.1.4.1.2 Cross mass transfer in multicomponent food packaging systems ... 22
2.1.4.1.3 Mass transfer controlled by diffusion in the packaging materials ... 29
2.1.4.1.4 The concept of functional barrier ... 31
2.1.4.2 Molecular diffusion ... 32
2.1.4.2.1 A macroscopic definition ... 32
2.1.4.2.2 A microscopic definition ... 33
2.1.4.2.3 Trace diffusion and random walks ... 35
2.1.4.2.4 Mutual diffusion ... 36
2.1.4.3 Diffusion in thermoplastic and elastomers ... 37
Scaling laws and friction models ... 40
2.1.5 2.1.5.1 Overview ... 40
2.1.5.1.1 Hydrodynamic theory of diffusion ... 40
2.1.5.1.2 Theoretical composition laws for diffusants consisting in N repeated patterns 41 2.1.5.2 Experimental data of diffusion coefficients in solid polymers ... 44
2.1.5.2.1 Linear substances ... 44
2.1.5.2.2 Additive type substances ... 45
2.1.5.2.3 Combined effect of T, Tg and geometry ... 46
Free-volume theories ... 48
2.1.6.1 Common assumptions ... 48
2.1.6.2 Vrentas and Duda theory for rigid solutes ... 50
2.1.6.3 Extension to flexible solutes ... 53
Activation models and data ... 55
2.1.7 2.1.7.1 Apparent effects of temperature and pressure ... 55
2.1.7.2 Activation energies ... 58
2.1.7.2.1 Effect of the molecular mass ... 58
2.1.7.2.2 Polymer effects ... 59
2.1.7.2.3 Combined solute and polymer effects ... 60
Alternative models to predict D or to overestimate D ... 61
2.1.8 2.1.8.1 The justification of alternative models ... 61
2.1.8.2 Models overestimating D ... 64
2.1.8.3 Prediction of D based on decision trees and molecular descriptors ... 70
Conclusions ... 73 2.1.9 References ... 75 2.1.10
Barrier materials ... 95
2.2
Some definitions and choices ... 952.2.1 Non-reactive barrier systems ... 97
2.2.2 2.2.2.1 Overview ... 97
2.2.2.2 Common transfer models for passive/active systems ... 101
2.2.2.2.1 Out-of-equilibrium approaches ... 101
2.2.2.2.2 Approaches at equilibrium ... 103
2.2.2.3 Reported experimental performances of passive barrier systems ... 104
2.2.2.4 New concepts of active systems ... 105
Reactive barriers ... 109
2.2.3 2.2.3.1 The concept of sacrificial reagent to increase barrier properties ... 109
2.2.3.2 Performances of reactive barriers ... 111
Conclusions ... 113
2.3
Chapter 3. Objectives and approaches ... 115
General objectives ... 117
3.1
Particular objectives ... 117
3.2
Approaches followed in this thesis ... 118
3.3
Chapter 4. Materials and methods ... 123
Materials ... 126
4.1
Solutes ... 126 4.1.1 Polymer ... 128 4.1.2 Nano-adsorbents ... 130 4.1.3 Polymer/nanocomposite film processing and formulation ... 1324.1.4 4.1.4.1 Virgin films ... 132
4.1.4.2 Source films ... 132
4.1.4.3 Nanocomposite film processing ... 132
Methods ... 133
4.2
Differential scanning calorimetry (DSC) ... 1354.2.1 Polarized optical microscopy... 135
4.2.2 Measurement of diffusion coefficients ... 135
4.2.3 4.2.3.1 Single film imaging by DUV/fluorescence microspectroscopy ... 136
4.2.3.1.1 Sample preparation ... 136
4.2.3.1.2 Theoretical concentration profiles ... 136
4.2.3.1.3 Data analyzing ... 137
4.2.3.2 14 films contact method ... 139
4.2.3.2.1 Sample preparation ... 139
4.2.3.2.2 Theoretical concentration profiles ... 139
4.2.3.2.3 Data analyzing ... 140
Chapter 5. Results and discussion ... 143
Diffusion in bulk polymers ... 145
5.1
Beyond tortuosity: how negative correlations decrease D values with 5.1.1 considered time-scale ... 145Non-obstacle related effects on D ... 148
5.1.2 Study and model development ... 151
5.1.3 5.1.3.1 Abstract ... 153
5.1.3.2 Introduction ... 153
5.1.3.3 Theory ... 155
5.1.3.3.1 Scaling of D with the number of jumping units and temperature for linear solutes 156 5.1.3.3.2 Conventional free-volume theories ... 160
5.1.3.3.3 Extended free-volume models for aromatic solutes in aliphatic polymers 163 5.1.3.3.4 Modeling of activation terms for oligophenyl solutes ... 166
5.1.3.4 Experimental section ... 168
5.1.3.4.1 Materials ... 168
5.1.3.4.2 Film processing and formulation ... 169
5.1.3.4.3 Methods ... 170
5.1.3.5 Results and discussion ... 172
5.1.3.5.1 Comparison of the scaling of D between linear aliphatic solutes and aromatic solutes ... 172
5.1.3.5.2 Scaling diffusion coefficients according to Eqs. (5-11), (5-30)-(5-31) ... 175
5.1.3.5.3 Polymer effects as probed with diphenyl alkanes ... 177
5.1.3.5.4 Solute activation parameters of oligophenyls ... 180
5.1.3.5.5 Mechanisms of translation of oligophenyls in aliphatic polymers ... 183
5.1.3.6 Conclusions ... 186
5.1.3.7 Author information ... 188
5.1.3.8 Acknowledgements ... 188
5.1.3.9 References ... 188
Possible application for the study of polymer nanocomposites ... 192
5.1.4
Characterization and thermodynamic properties of nano-clays .. 193
5.2
Introduction ... 1935.2.1 Simulation and experimental study ... 197
5.2.2 5.2.2.1 Abstract ... 198
5.2.2.2 Introduction ... 198
5.2.2.3 Material and method ... 200
5.2.2.3.1 Materials ... 200
5.2.2.3.1.1 Nanoclay ... 200
5.2.2.3.2.1 X-ray diffraction analysis (XRD) ... 201
5.2.2.3.2.2 Thermogravimetric analysis (TGA) ... 201
5.2.2.3.2.3 Specific surface area ... 201
5.2.2.3.3 Sorption properties at infinite dilution ... 202
5.2.2.3.4 Sorption isotherms of anisole ... 204
5.2.2.3.5 Molecular modeling strategies ... 205
5.2.2.3.5.1 Preparation of neat clay crystal structure ... 205
5.2.2.3.5.2 Preparation of surface modified clays... 206
5.2.2.3.5.3 Sorption calculations at diluted state ... 206
5.2.2.3.5.4 Sorption calculations at concentrated state ... 207
5.2.2.3.5.5 Sorption properties of organic solutes in surfactants ... 208
5.2.2.4 Results and Discussion ... 208
5.2.2.4.1 Experimental characterization of clays ... 208
5.2.2.4.1.1 Organic composition ... 208
5.2.2.4.1.2 Gallery structure... 211
5.2.2.4.2 Clay atomistic model and its characterization ... 212
5.2.2.4.3 Sorption properties at infinite dilution ... 217
5.2.2.4.3.1 Simulated Henry coefficient and isosteric heat of sorption ... 217
5.2.2.4.3.2 Comparison with experimental adsorption enthalpy ... 220
5.2.2.4.4 Sorption behavior at concentrated state ... 225
5.2.2.4.4.1 Simulated isotherms ... 225
5.2.2.4.4.2 Experimental sorption isotherms ... 227
5.2.2.4.4.3 Isosteric heats of sorption ... 231
5.2.2.5 Conclusions ... 232
5.2.2.6 References ... 233
Applications for developing polymer nanocomposite systems ... 237
5.2.3
Proof of the concepts of barrier materials including
nano-5.3
adsorbents ... 239
Introduction ... 239
5.3.1 Experimental study and interpretation ... 241
5.3.2 5.3.2.1 Abstract ... 242
5.3.2.2 Introduction ... 242
5.3.2.3 Theory of polymer barrier materials ... 245
5.3.2.3.2 Reduction of D due to asymmetric barriers to translation: a two states toy model. 247
5.3.2.3.3 Inverse gas chromatrography (IGC) as a one-dimensional physical model.
248
5.3.2.3.4 D reduction due to entropic trapping: a first approach ... 249
5.3.2.4 Materials and methods ... 251
5.3.2.4.1 Polymer and nano-adsorbents. ... 251
5.3.2.4.2 Solute probes ... 252
5.3.2.4.3 Estimation of γi,MMT(T) ... 252
5.3.2.4.4 Estimation γi,P(T) by a generalized off-lattice Flory-Huggins method ... 253
5.3.2.4.5 Diffusion coefficient (D) determinations. ... 253
5.3.2.5 Results and discussion ... 254
5.3.2.5.1 Effect of crystallite morphology on diffusion coefficients ... 254
5.3.2.5.2 Partitioning between nanoclays and amorphous regions of PCL and PVA. 254 5.3.2.5.3 Reduction of diffusion coefficients in PCL nanocomposite. ... 256
5.3.2.5.4 Reduction of diffusion coefficients in PVA nanocomposite. ... 257
5.3.2.6 Conclusions ... 261
5.3.2.7 References ... 261
Does the nano-adsorbent concept work? ... 266
5.3.3
Extended results and discussion ... 269
5.4
The concept of increasing dwelling times to lessen D ... 2695.4.1 Do we expect a change in the molecular mechanism of diffusion in presence 5.4.2 of nano-adsorbents? ... 272
Chapter 6. Conclusions and perspectives ... 275
Overview ... 277
6.1
Diffusion of tracers in bulk polymers ... 278
6.2
A new concept of barrier material: chaotic materials ... 280
6.3
Outlook ... 282
6.4
Chapter 7. References ... 285
L
IST OF PUBLICATIONS
Publications included in the thesis
Publication I
X. Fang, and O. Vitrac, (2013). Predicting diffusion coefficients of chemicals in and through packaging materials. Submitted to Crit. Rev. Food. Sci. Nutr.
Publication II
X. Fang, S. Domenek, V. Ducruet, M. Réfrégiers, and O. Vitrac, (2013). Diffusion of Aromatic Solutes in Aliphatic Polymers above Glass Transition Temperature. Macromolecules. 46: 874-888.
Publication III
X. Fang, V. Ducruet, and O. Vitrac, (2013). Sorption properties of solutes onto pristine and organo-modified montmorillonites. Submitted to Langmuir.
Publication IV
X. Fang, S. Domenek, and O. Vitrac, (2013). Controlling the molecular interactions to improve the diffusion barrier of biodegradable polymers to organic solutes above Tg. In preparation.
Publications not included
X. Fang, O. Vitrac, S. Domenek, V. Ducruet, (2012). Controlling the molecular interactions to improve the diffusion barrier of biosourced polymers to organic solutes, Defect and Diffusion Forum, 323-325, 26.
L
IST OF FIGURES
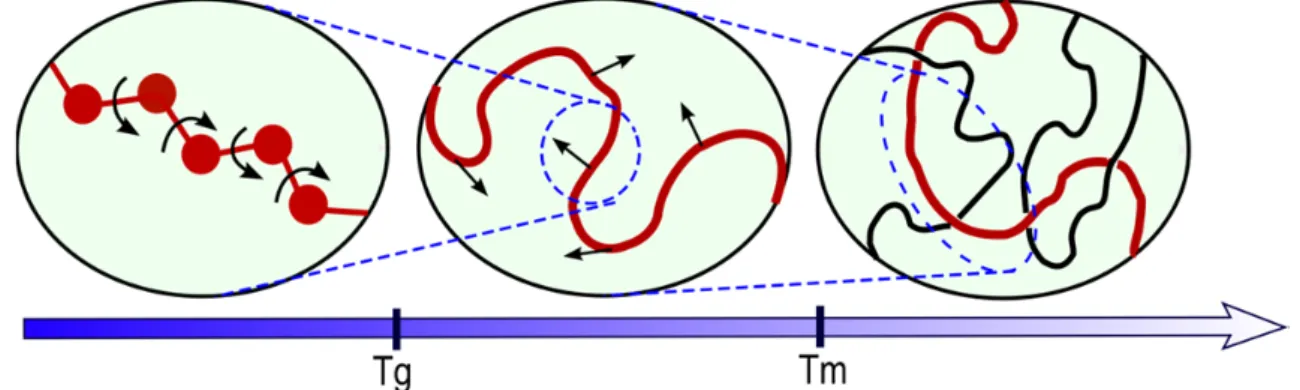
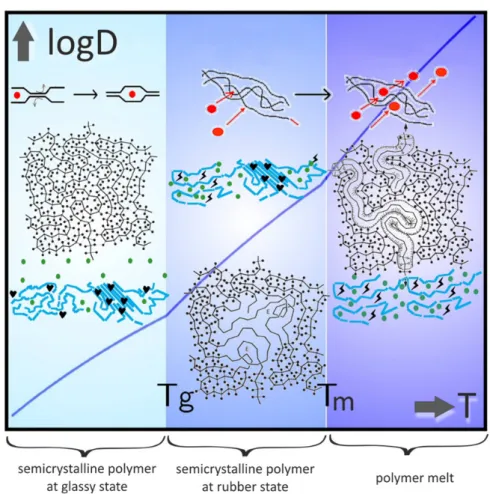
Figure 1-1 Different cases of energy barriers between the matrix and inclusions, {li}i=1..2 , {Ei}}i=1..2 are the hop length and the activation energy of diffusion in the inclusions i=1 and in the matrix i=2. (a) An inclusion with a diffusion coefficient in the inclusions smaller than in the matrix; there is no significant energy barrier between them. (b) An energy barrier Ea for the penetration into inclusion. (c) Partial trapping of particles inside inclusions, the “detrapping” energy is Et. After Figure 2 of Kalnin and Kotomin (1998). ... 6 Figure 2-1 Microscopic observations in visible light and its molecular interpretation of the sorption of decane in atactic polystyrene at 70 °C (after Morrissey and Vesely (2000)). ... 22 Figure 2-2 Main mass transfer from, to and cross packaging materials (after Rahman (2007), Vitrac and Hayert (2007a)). ... 29 Figure 2-3 Concentration profile of migrants (e.g. additive) along the thickness of the food-packaging system as detailed in Vitrac and Hayert (2006). When t=0, migrants are assumed to be distributed homogeneously in the packaging material so that a uniform concentration profile can be assumed. For t>0, mass balance enforces that the surface area below the concentration profile on the food side is equal to complementary surface area between the profiles at t=0 and t>0 on packaging side. ... 31 Figure 2-4 Cumulated amount of diffusant (Qt) crossing a plane sheet of thickness, lFB, with upstream concentration C1 versus dimensionless time DFBt/lFB2. The intercept of tangent line with Qt=0 at tdelay= lFB2/6DFB gives the typical time lag to get a significant permeation across the film. (after Fig. 4.2 in book of Crank (1979)) ... 32 Figure 2-5 One-dimensional interpretation of molecular diffusion with “eyed” particles a) as populations in contiguous elemental volumes exchanging particles, b) as a local hopping process and c) as mutual diffusion of a bulky additive among connected polymer beads. In the real life (at macroscopic scale), the particles and the direction of jumps are indiscernible. To enable particles counting, the direction of the sight gives here the direction of the next jump. In details, situations in (a) and (b) illustrate the concepts of macroscopic and microscopic mass balance applied implicitly in second and first Fick equations, respectively. ... 34 Figure 2-6 Simulation of 10 one-dimension random walks starting from a same initial position. The continuous probability Gaussian distributions associated to an infinite number of trajectories are also represented for different times.(see Eqs. (2-6) and (2-7)). ... 36 Figure 2-7 Schematic representation of multi-scales of the organization of polymer materials (e.g. polyethylene). a) chemical structure (Baschnagel et al., 2004), b) intermingled chains (Baschnagel et al., 2004), c) semi-crytalline structure (Queyroy and Monasse, 2012), d) poly-crystalline structure (Callister and Rethwisch, 2011), e) heterogeneous materials
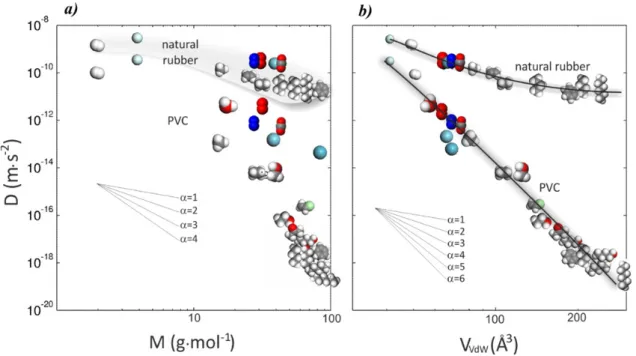
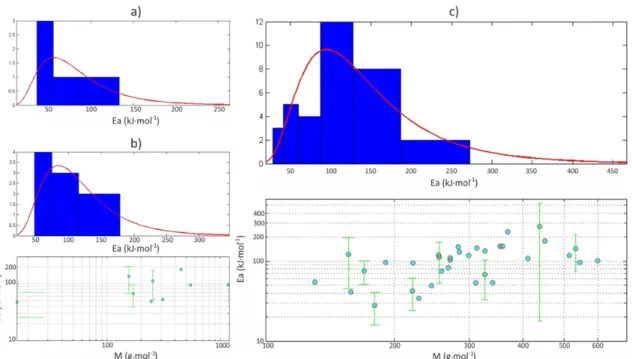
(Muller-Plathe, 1991). l0: length of a C-C bond, lp: persistence length, θ: bond angle, ϕ: torsion angle, rg: gyration radius, dee: end-to-end distance. ... 38 Figure 2-8 Largest polymer displacements versus temperature. Tg is the glass transition temperature, Tm is the melting temperature, (after Paul and Smith (2004)). ... 39 Figure 2-9 Scaling of diffusion coefficients in natural rubber and polyvinyl chloride (PVC) with a) molecular mass (M) and b) van-der-Waals volume (VVdW) of diffusant (Berens, 1981). ... 40 Figure 2-10 Scaling laws associated to the diffusion a-b) of linear n-alkanes (at 40 °C, according to Reynier et al. (2001b), Vitrac et al. (2007)) and c) linear or branched alkanes (between 23 °C and 30 °C, data collected by EU working group SMT-CT98-7513 and published by Begley et al., (2005), Vitrac et al., (2006) and available within the EU database hosted on the Safe food packaging portal (INRA, 2011) for low density polyethylene. ... 45 Figure 2-11 Scaling laws identified for additive-type molecules in different thermoplastic materials at 298K (Dole et al., 2006a). ... 46 Figure 2-12 a, b) Log-log plots of trace diffusion coefficients in polyethylene of linear aliphatic and aromatic solutes. c) The corresponding scaling exponents α versus T-Tg for both linear aliphatic solutes (Koszinowski, 1986; Arnould and Laurence, 1992; Möller and Gevert, 1994; Kwan et al., 2003; Vitrac et al., 2007; von Meerwall et al., 2007) and aromatic solutes (Koszinowski, 1986; Doong and Ho, 1992; Fang et al., 2013). ... 47 Figure 2-13 Distribution of free volumes around a planar and rigid diffusant (fluorene) in high density polyethylene at room temperature pressure as extracted by isobaric and isothermal molecular dynamics simulation. The image is obtained by plotting the projected Connolly surfaces onto the plan defined by the main axes of the diffusant. Only the atoms included in the thickness of the diffusant are considered. ... 48 Figure 2-14 Interpretation of the translation of additive-type molecules according to the state of the polymer. ... 58 Figure 2-15 Estimated activation energies between 20 and 40°C in low density polyethylene: a) smalls molecules M<100 g·mol-1, b) linear alkanes, c) additive molecules with 100<M<600 g·mol-1. Data extracted from the European database of diffusion coefficients (INRA, 2011). 59 Figure 2-16 Van’t Hoff diagram of diffusion coefficient of 2',5'-dimethoxy-acetophenone in different polymers et high temperature (near to processing temperature). (after Feigenbaum et al. (2005), Dole et al. (2006a), Dole et al. (2006b)). ... 60 Figure 2-17 Variation of activation energy for different polymers between 20 and 40°C according to Dole et al. (2006a). ... 61 Figure 2-18 Estimation of D with molecular weight by both models listed in Table 2-9 and
collected by the EU project SMT-CT98-7513 (EC, 2002b) and renormalized at 23°C in a) LDPE (345 values), b) HDPE (142 values) and c) PP at 23°C (141 values). ... 66 Figure 2-19 Plot of scaling exponents α with molecular weight for different models in Table 2-9 and reported averaged experimental α values in corresponding range of tested molecular weight (after Fang et al. (2013)). Each horizontal segment represents the range of molecular masses used to determine α. ... 67 Figure 2-20 Evaluation of the robustness of the Piringer model for two typical polymers above their Tg: a), c) polypropylene (Tg=0°C) and b), d) polyamide (Tg=50°C). The considered diffusants are aliphatic solutes (e.g. alkanes and alkyl acetates) below the entanglement length. a-b) Comparison between iso-D values (from Fang et al. (2013), see Table 2-6, solid lines) and iso-D values obtained from Piringer model (see Table 2-9, dashed lines). c,d) Corresponding iso-ratios D/D where “safe regions” (with overestimations) are depicted in light blue. e) Safe strategies to extend the Piringer model to new polymers in presence of scarce data. ... 69 Figure 2-21 Example of automatic classification of Chimmassorb 90 (Vitrac et al., 2006). The request has been typed online on the Safe Food Packaging Portal (INRA, 2011), which gives in return all substances in the EU database with similar D values. ... 72 Figure 2-22 Decision tree for the prediction of diffusion coefficients in LDPE at 23°with different risks of overestimations: 50% or 10% (after Vitrac et al. (2006)). ... 73 Figure 2-23 The main categories of barrier materials ... 96 Figure 2-24 Overview of existing passive and active systems ... 99 Figure 2-25 Example of outstanding active material: barrier to small molecules such as helium and permeable to larger ones such as water. a) The transport mechanism of water molecular due to “tunneling effect”; b) the permeability of different solute molecules (after Nair et al. (2012)). ... 100 Figure 2-26 One-dimensional periodic free energy profile including two states: A and P separated by a transition state denoted ‡. ... 106 Figure 2-27 The reduction ratio of D by non-reversible and reversible random walks on hexagonal lattices with Poisson distributed dwelling times in two situations: with or without preferential routes. (after Vitrac and Hayert (2007)) ... 107 Figure 2-28 a) Excess polymer-air partition coefficient K or “sorption excess” (positive value= chemical affinity for the polymer above the one expected from Eq. (2-29)) versus the volume fraction in particles ϕP. b) Reduction of mutual diffusion coefficients with ϕP. Subscripts ϕ and B denote effective and bulk properties respectively. Filled and empty symbols represent data obtained with a diameter of 14 nm and 50 nm respectively. The
theoretical D reduction with impermeable particles (Sangani and Yao, 1988) are plotted with (×) for particles of diameter 14 nm. ... 108 Figure 2-29 The concentration profiles of diffusants and reagent in reactive film with thickness, l. The reaction front separated film into diffusion zone, l’, and reaction zone, l-l’. C10 and C20 are the constant diffusants concentration in contact with film and the reagent concentration in reactive film. ... 110 Figure 4-1 The scheme of the structure of pristine montmorillonites. ... 130 Figure 4-2 Scheme of sample preparation (A, C=virgin films, B=source film) ... 136 Figure 4-3 Simulated concentration profiles at cross section of three contact films assembled as in Figure 4-2 with thickness 200μm each normalized at a) the interface and b) the center of source layer ... 136 Figure 4-4 Comparison of theoretical concentration profiles with diffraction patterns (colored curves) and without (black curves) for a) the layer A or C and b) the layer B. ... 137 Figure 4-5 Example of the collected spectra at each measured position with baseline. Two peaks are related to excitation (i.e. λ=275nm) and emission (i.e. λ=280-380nm) respectively ... 137 Figure 4-6 The experimental concentration profiles of biphenyl at 343K (red filled dot) in PP film at a) position C and b) position B fitted with theoretical concentration profiles (colored curves). ... 138 Figure 4-7 The experimental concentration profile of biphenyl at 343K (red filled dot) in PLA film at position C fitted with theoretical concentration profiles (colored curves). ... 139 Figure 4-8 Scheme of sample preparation in 14 films contact experiment ... 139 Figure 4-9 14 films method involving 2 sources sandwiched among 12 virgin films. Concentration profiles are plotted for different Fourier number. Bars represent the concentration as measured (i.e. averaged over the film thickness) whereas the continuous line represents the continuous profile. All concentration profiles are normalized to yield an overall stack concentration of 2. ... 140 Figure 4-10 a) Measured profiles after 1 hour of contact (bars), predicted profiles and corresponding 95% confidence intervals are plotted in continuous and dotted lines respectively. All concentrations profiles are normalized to yield an overall stack concentration of 2. b) Least-square fitting criterion between measured and predicted concentration profiles. 95% confidence interval around the minimum is plotted as a red line. c) Details of the minimum region (linear scale of Fourier numbers). ... 140 Figure 5-1 a) Main homologous series used in this section to probe both free-volume effects and the scaling of D with M. b) Bivariate domain T×Tg examined in this section ... 150
Figure 5-2 Log-log plots of trace diffusion coefficients in polyethylene (PE) either with low density (LDPE) or high density (HDPE) of a) linear aliphatic and b) aromatic solutes. Dref was chosen as the diffusion coefficient of the first solute in the considered solute series. ... 157 Figure 5-3 Correlations between ξ values as reported in Tables 2 and 3 of33 and lnM M0.
Experimentally determined ξ values are plotted as solid symbols and theoretically calculated ones (see Eq. (22) in33) as empty symbols. The reference solutes are: hexane, methyl acetate and benzene with molecular mass (M0) of 86 g⋅mol-1, 74 g⋅mol-1 and 78 g⋅mol-1 respectively. ... 163 Figure 5-4 Scaling exponents of trace diffusion coefficients versus T-Tg. Symbols plot determinations of α inferred from experimental D values reported in references enclosed within brackets. α values for oligophenyls measured by this study and those calculated from D values of short linear aliphatic solutes in PVAc34 were not used to fit Eq. (5-18). The classification of solutes as linear aliphatic and aromatic is based on the same one as used in Figure 5-2. ... 173 Figure 5-5 a) Log-Log plot of trace diffusion coefficients of diphenyl alkanes and b) oligophenyls in various polymers. Symbols are experimental values. Continuous straight lines are scaling relationships fitted according to Eq. (5-11). Dashed lines are values fitted from Eqs. (5-30) and (5-31) for diphenyl alkanes and oligophenyls respectively. ... 176 Figure 5-6 Comparison between calculated (with Eqs. (5-30) and (5-31) respectively) and measured diffusion coefficients of a) diphenyl alkanes series and b) oligophenyls series in PLA, PP, PCL(×) and PVA(▲).The continuous lines plot the straight line y=x. The corresponding distribution of relative fitting errors values and fitted Gaussian distribution (continuous curve) are plotted within insets. Values in PVA are external validation predictions not used in the fitting procedure. ... 177 Figure 5-7 Scaling diffusion coefficients of diphenyl alkanes with the number of carbons, NC, between phenyl rings: a) raw diffusion coefficients measured at 343 K for PLA, 333 K for PP, and 323 K for PCL b) diffusion coefficients relative to biphenyl D N
C0, ,T Tg
. Eq. (5-30) predictions are plotted as continuous lines. ... 178 Figure 5-8 Experimental diffusion coefficients of diphenyl alkanes in PLA, PP, PCL (empty symbols) and PVA (filled symbols) versus T-Tg a) raw diffusion coefficients, b) D/Dsolute. Eq. (5-30) fitted on empty symbols is plotted as continuous lines. Filled symbols are used for external validation purposes. ... 180 Figure 5-9 Scaling of diffusion coefficients of oligophenyls with the number of phenyl rings, NPh, a,c) in PCL and b,d) in PP at different temperatures: a,b) raw diffusion coefficients, c,d)scaled diffusion coefficients with polymer effects removed. Predictions according to Eq. (5-31) are plotted as continuous lines. ... 181 Figure 5-10 Normalized van’t Hoff plots of oligophenyls a,b) raw diffusion coefficients and c,d) scaled diffusion coefficients with polymer effect removed a,c) in PCL and b,d) in PP. Predictions according to Eq. (5-31) are plotted as continuous lines. ... 182 Figure 5-11 a,c) Raw and b,d) solute activation energies and diffusion entropy of oligophenyls in PP and PCL versus the number of phenyl rings, NPh; e) correlation between solute activation parameters; f) related free barrier energy to diffusion at 298 K. ... 183 Figure 5-12 a) Comparison of relative solute activation energy (continuous lines, left scale), calculated as
ring
NPh
ring
NPh
trapped for different p values according to Eqs. (5-32) and (5-33), with experimental values (dotted lines, right scale) reported in Figure 5-11b). The horizontal dashed line represents the average value of Easolute for studied oligophenyls. b) Comparison of solute entropy (continuous lines, left scale), calculated for different p values according to Eqs. (5-34)-(5-37), with experimental values (dotted line, right scale) reported in Figure 5-11d). ... 185 Figure 5-13 Interpretation of inverse gas chromatography (IGC) as 1D random walk along a surface energy. The unique assumption is that the number/amount of sorption sites (i.e. the probability of accessibility) is the same for all substances (including for the reference low interacting one) so that the ratio of elution times is a measure of the energy differenceex i adsorbent
H RT. a) Equivalent energy surface. b) Retention times at high and low flow rate (FR). c) Possible interpretation of the right tailing of retention distributions due to a mixed interactions with external/internal accessible surfaces, surfactants or in gas phase. ... 194 Figure 5-14 a) Detailed description of mass transfer at one adsorption site within the IGC column. The longitudinal direction represents a macroscopic transport along the column, while the transverse direction details the mass balance at molecular scale. b) Corresponding free energy distribution associated to the sorption/desorption jumping processes. According to the transition state theory, ‡ is the transition state whose probability does not depend on the origin of the solute (in gas phase or in adsorbed phase). ... 203 Figure 5-15 Differential thermal analysis (DTA) curves of a) pristine MMT, b) C18MMT, c) C18OHMMT and d) C6H5MMT. Deconvolved peaks are identified with Roman numbers with corresponding parameters listed in Table 5-6. ... 209 Figure 5-16 Diffraction spectra of a) MMT, b) C18MMT, c) C6H5MMT and d) C18OHMMT samples. Bragg peaks were fitted as a sum of Gaussian (a, b, d) and Lorentzian curves (c) and baseline. The baseline is fitted with a tangent constrained fourth degree spline polynomials.
Figure 5-17 The dspacing distribution calculated according to Bragg’s law. Likeliest values and typical percentiles are reproduced in Table 5-7. ... 212 Figure 5-18 Illustrations of our atomistic models of MMT: (a) i: overview of periodic unit cell in 2×2×2 arrangement with a lattice spacing (d-spacing) in c direction and a significant gap between the two adjacent layers, iii: side view details of the crystal structure with P1 symmetry, the elemental crystal pattern is represented in CPK style. iv: the corresponding top view of six tetrahedral silica connected clearly identifiable, (b) Details of the Al octahedral layer with random substitutions by Mg atom. c)-f) Typical side views of pristine MMT (d-spacing= 1.27 nm) and organo-modified MMT (d-(d-spacing=2.2 nm). g)-h) Two typical orientations of one single surfactant molecule: octadecylamine (C18). ... 213 Figure 5-19 Correlations between surfactant loading and d-spacing as assessed from GCMC simulations. ... 214 Figure 5-20 Theoretical distributions of surfactant amounts from GCMC simulations (Figure 5-19) integrating the dispersion of d-spacing plotted in Figure 5-16. Mean values and typical percentiles are reproduced in Table 5-8. ... 215 Figure 5-21 a) Top view of the volume accessible to spherical probes into one typical clay interlayer filled with C18 surfactant to spherical probes (the contact surface for different probe radii are plotted in red color). b) Relationships between volumes and gyration radius of tested solutes. c-d) Accessible volume and surface area according to radius of the considered spherical probe. ... 216 Figure 5-22 a)-c) The calculated Henry coefficient sampled by one single solute molecule with all clay models at 313 K. The horizontal dashed line separates the theoretical Henry coefficient for an inert ideal gas. d)-f) the isosteric heat calculated in the temperature range from 298 K to 348 K a), d) The effect of surfactant on n-alkanes with equal d-spacing (d=2.2nm), b), e) the effect of d-spacing on n-alkanes in the range of d=1.27-2.2nm and c), f) on solute series of heptane, toluene and anisole in the range of d=1.27-2.2nm ... 219 Figure 5-23 The corresponding sorption energy (i.e. -isosteric heat) distribution of solute series of heptane, toluene and anisole a)-c) on all clay type with equal d-spacing of 2.2nm and d)-f) on pure MMT with d-spacing ranging from 1.4 to 2.2nm. The averaged energy values are reported in Figure 5-22a)). ... 220 Figure 5-24 Typical distributions of elution times for n-alkanes (n=1..6), toluene and anisole in columns filled with a) pure MMT and b) C18OHMMT samples. Fiited exponentially-modified Gaussians are depicted as thin solid lines and c) the peak shape factor (skewness) of elution profiles as function of the position of the peak mode. ... 221 Figure 5-25 Effect of flow rate effect on retention times of pentane and hexane. Normalized retention times (see Eq. 4) are plotted as dashed lines. ... 222
Figure 5-26 The experimentally determined Henry coefficients of pristine MMT compared with simulated ones averaged over the distribution of real d-spacing values (see Figure 5-17). The dashed line represents the straight line. y=x. Vertical and horizontal lines represent 95% confidence intervals ... 223 Figure 5-27 Comparisons of isosteric heat of sorption and net values between experimental (IGC) values (open symbols) and simulation ones for a-b) n-alkanes and c) aromatic solutes. Excess in solute-surfactant mixing energies are also represented more general heptane, toluene and anisole (the experimental data are compared with simulation data with two possible interactions: between one solute molecular and clay surface which defined upper boundary above 30 kJ⋅mol-1; between solute and surfactant which defined lower boundary
below 5 kJ⋅mol-1). ... 224
Figure 5-28 a) Simulated sorption isotherms of anisole in pure MMT with different d-spacing and b) linear relatioshop between maximum loading and gap distance. ... 226 Figure 5-29 a) Maximum loading as determined from simulated isotherms of clays with a fixed d-spacing of 2.2nm and b) equivalent Henry coefficients KL as extrapolated from Langmuir equation (see Eq. 14) (solid lines with symbols) compared with KH values calculated from solute insertion at infinite dilution (see Figure 5-22a)). ... 227 Figure 5-30 Experimental sorption isotherms of anisole (open symbols and dashed lines) compared with fitted isotherms relying on BET equation (solid line). Dashed lines are continuous least squares approximates. ... 228 Figure 5-31 Experimental isosteric heat of sorption vs loading inferred from IGA experiments ... 231 Figure 5-32 Simulated isosteric heat of sorption versus loading of anisole. ... 232 Figure 5-33 Energetic interpretation of Kcontrast in nano-adsorbent – polymer systems. Excess mixing energies are evaluated for a reference state of the considered solute at liquid state (or equivalent at molten state). ... 240 Figure 5-34 One-dimensional periodic free energy profile including two states: MMT and P separated by a transition state denoted ‡. ... 247 Figure 5-35 (a) Mass transfer description at one adsorption site within the column of IGC. The longitudinal direction represents a macroscopic transport along the column, while the transverse direction details the mass balance at molecular scale. (b) Corresponding free energy distribution in the process of desorption (note that GΔ→0). ... 249
Figure 5-36 Dynamics of a particle moving randomly within a sphere. (a) Distribution of collision times (reciprocal of a Maxwell-Boltzmann distribution). (b) Velocity correlations for a particular starting position (continuous line) and averaged over all possible starting times
(dashed line). (c) Velocity correlations averaged all collision intervals. (d) Corresponding 3D(τ) values. ... 250 Figure 5-37 The diffusion coefficients of PCL films casting a) on a glass surface with and b) on a Teflon surface with close crystallinity degree of 55% and c)-d) the corresponding crystallite morphology in two PCL films. Pictures above depict the size of crystallites by polarized light microscopy (width=100 µm). ... 254 Figure 5-38 a) The excess energy of mixing and b) corresponding partitioning coefficient Kcontrast between organo-modified MMT and amorphous regions of PCL. The symbol of data is coded as xy: x is the index of solute; y is the index of polymer or clay. ... 256 Figure 5-39 a) The excess energy of mixing and b) corresponding partitioning coefficient Kcontrast between pristine MMT and amorphous regions of PVA. The symbol of data is coded as xy: x is the index of solute; y is the index of polymer or clay. ... 256 Figure 5-40 Normalized concentration profiles of biphenyl after 20 min of contact time at 298K (a) in pure PCL films with D value of 9.1e-13 m2/s, (b) in PCL nanocomposite films including 0.5wt % of C18OHMMT with D value of 5.2e-13 m2/s. The average film thickness is of 40 µm. ... 257 Figure 5-41 Reduction of diffusion coefficients of biphenyl in PCL nanocomposite: a) effect of concentration of nanoclays. b) interpretation according to Kcontrast. Pictures above depict the size of crystallites in PCL and its nanocomposite systems containing 0.5wt% of nanoclays by polarized light microscopy (width=100 µm). ... 257 Figure 5-42 Normalized concentration profiles of biphenyl at 343K (a) in pure PVA films with D value of 3.8×10⁻¹⁵ m2⋅s-1, (b) in PVA nanocomposite films including 5wt % of pristine
MMT with D value of 3.4×10⁻¹⁶ m2⋅s-1. The average film thickness is of 13 µm. ... 259
Figure 5-43 Molecular dynamics of oligophenyls in vacuum when one or several aromatic rings are blocked randomly: a) internal degrees of freedom, b) corresponding trace of the trajectory of the center-of -mass projected along its main inertia axis. ... 270 Figure 5-44 a) Extreme configurations leading to a translation of center-of-mass (CM) of quaterphenyl beyond the size of one aromatic ring while keeping the position of end ring fixed. The projections on the main axes represent the same molecule as connected rigid blocks (robot model) The visited distance of CM is represented by an arrow and the ring size by a solid circle centered on CM. b) Sketched fluctuations of mean-square-distance (msd) when one or several rings are alternatively blocked. ... 270 Figure 5-45 Mean-square-displacement (msd) of the center-of-mass versus time scale, τ, when one single ring is blocked in a) biphenyl, b) p-terphenyl, c) p-quaterphenyl molecules. d) msd value when the ring to be blocked is chosen randomly for all tested solutes. e) Comparison of
relative solute activation energy (continuous lines, left scale) and calculated for different pring values as detailed in section 5.1.3. ... 271 Figure 5-46 Covariances between the displacements of atoms versus time scale, τ, when one single ring is randomly blocked in a) biphenyl, b) p-terphenyl, c) p-quaterphenyl molecules. d) Conformational entropy when 1 to NPh-1 ring is randomly blocked as calculated from Eq. (13) in section 5.1.3. e) Comparison of solute entropy (continuous lines, left scale), calculated for different pring values according to Eqs. (13)-(16) in section 5.1.3when 1 to NPh-1 ring is randomly blocked, and experimental values measured for oligophenyls (dotted line, right scale). ... 272 Figure 5-47 Scaling of equivalent transport coefficient (assimilated to D) with molecular mass M in IGC experiments: n-alkanes (circles), toluene and anisole (square). The upper dashed line represents the prediction according to Knudsen scaling. ... 274 Figure 6-1 Comparison between experimental data of (Janes and Durning, 2013) for particles and Eq.(6-4). ... 284
L
IST OF TABLES
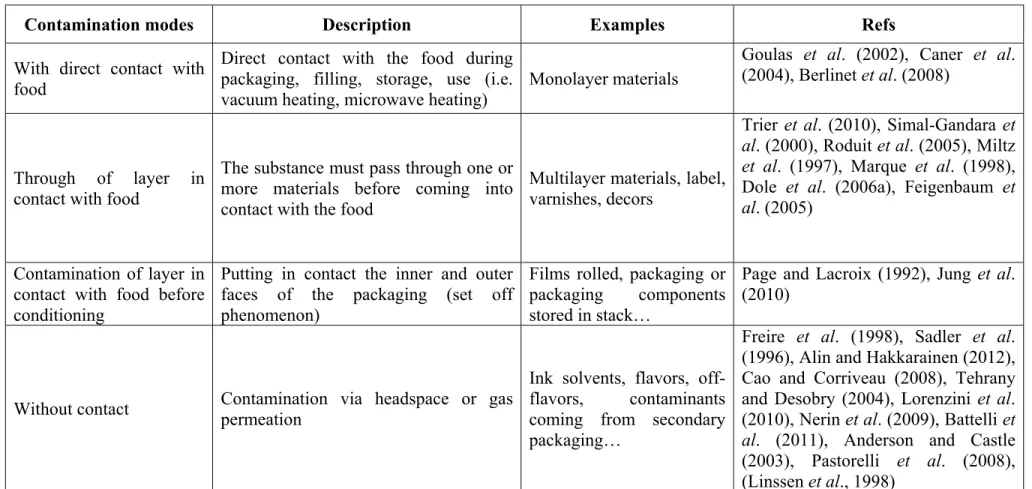
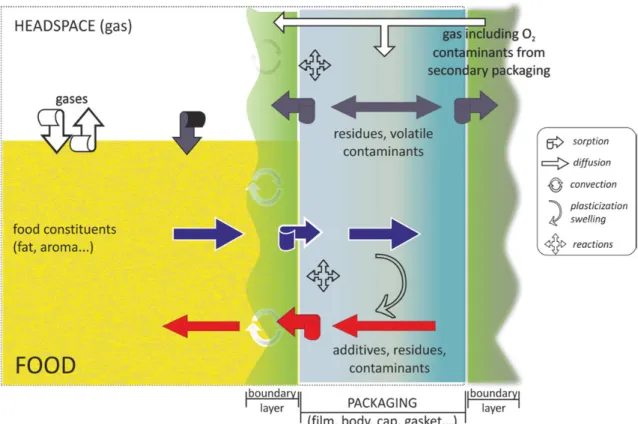
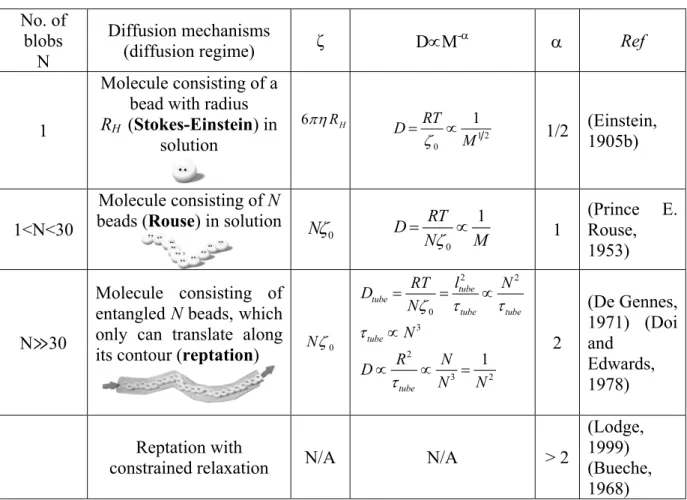
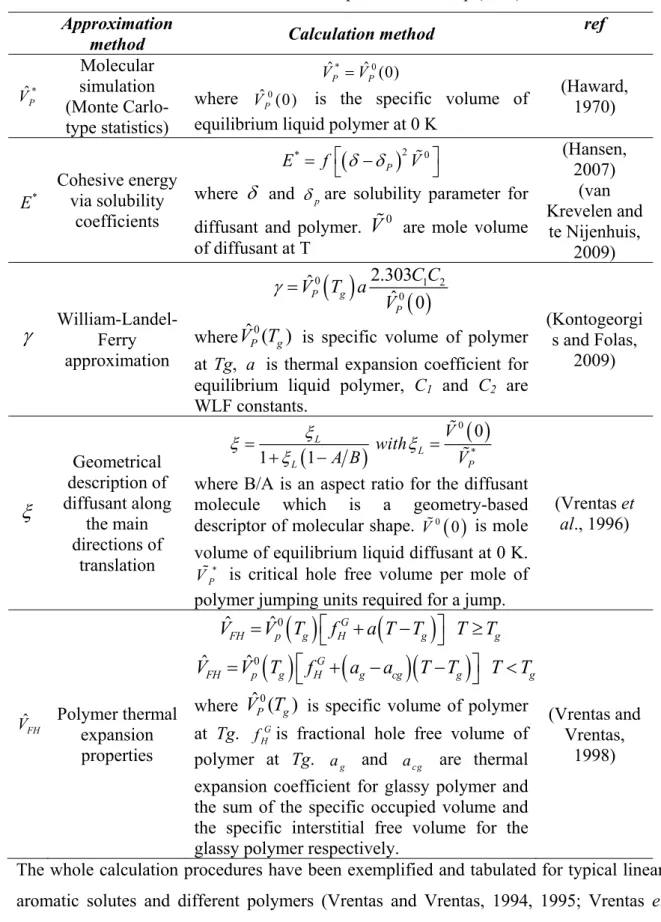
Table 2-1 List of typical potential substances existing in different materials for food contact purpose. ... 24 Table 2-2 Main contamination routes of food by materials in direct or indirect contact ... 28 Table 2-3 Scaling law and diffusion mechanisms associated with ideal mixtures ( = 1). ... 43 Table 2-4 Calculation method of free volume parameters in Eq. (2-22) ... 51 Table 2-5
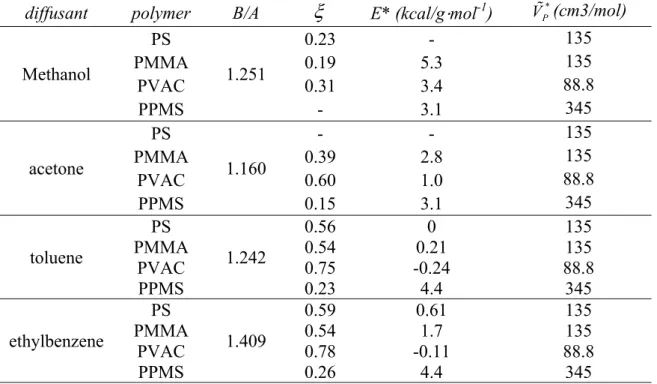
and E values for 8 diffusant-polymer systems. ... 52*Table 2-6 Formal equivalences between scaling law of diffusion coefficients and free-volume theory for diffusants based on linearly repeated sub-units (see Figure 2-5) in rubber polymers (Fang et al., 2013) ... 53 Table 2-7 Equivalent terms in Eq. (2-24) for two homologous series of aromatic diffusants. 55 Table 2-8 The activation energy and volume responsible for rotation and translation of the additive-type molecule in high density polyethylene at macroscopic and molecular scale. (after Kovarski (1997)). ... 56 Table 2-9 Main models to overestimate D values for compliance testing ... 64 Table 2-10 Available parameter values of main models for different polymers as reported in (Limm and Hollifield, 1996; Begley et al., 2005; Helmroth et al., 2005; EC, 2012a) ... 65 Table 2-11 Main geometric parameters used in CART approaches (Vitrac et al., 2006) and their physical justifications. Conformers are usually obtained from molecular dynamics simulation to reach representative configurations at the considered temperature. ... 71 Table 2-12 Values of topological descriptors for six typical molecules as associated to their state of minimum internal energy. The values are ordered as VVdW ,
, Iz/Ix (see Table 2-11). All molecules were oriented along their main axes (x, y and z); the three main projected surfaces are also depicted. ... 71 Table 2-13 Effective TReff from out-of-equilibrium approaches ... 102 Table 2-14 Effective Deff from equilibrium approaches ... 104 Table 2-15 Reported reduction of permeability and D in some typical nanocomposite passive systems ... 105 Table 2-16 Effective TReff and Deff in reactive barrier systems (after Table 1 in Yang et al. (2001)) ... 111 Table 2-17 Estimated reduction of permeability and D in reactive barrier systems containing reactive flakes (after Table 2 in Yang et al. (2001)) ... 111 Table 3-1 The objectives and corresponding methodologies included in the thesis. ... 119 Table 4-1 List of solutes applied in the thesis ... 126Table 4-2 Information and characterization of applied polymers ... 129 Table 4-3 The information and chemical structure of four commercial available clays ... 131 Table 4-4 Index of methodologies applied in the thesis ... 134 Table 5-1 Variations of D, which are not affected by the presence of obstacles. D’ is the corresponding diffusion coefficient in a nanocomposite material incorporating obstacles. .. 148 Table 5-2 List of studied aromatic solutes ... 168 Table 5-3 Information and characterization of processed films ... 169 Table 5-4 The detailed information of four tested clays ... 200 Table 5-5 Information of column dimension and sample filling condition for IGC experiments ... 202 Table 5-6 Content of tested clays based on the deconvolution of the TGA spectra (peaks are identified with roman numbers in Figure 5-15). ... 210 Table 5-7 d-spacing values integrating uncertainties over the distributions ... 212 Table 5-8 Comparison of surfactant loading between experimental and calculation. ... 215 Table 5-9 Comparison of sorption parameters of anisole from IGA experiments and simulations at concentrated and diluted states. ... 230 Table 5-10 Comparison of recommendations to develop Hybrid MMT-polymer composite systems according to processing and sorption properties. ... 238 Table 5-11 Polymer-MMT nanocomposite systems used to test the concepts of barrier materials integrating nanoparticles ... 239 Table 5-12 Characteristics of samples prepared. Suppliers: A= Creagif Biopolyméres (France); B= Süd Chemie (Germany) and C=Sigma Aldrich (France) ... 251 Table 5-13 The diffusion coefficients of biphenyl and terphenyl in both PVA film and PVA nanocomposite containing 5wt% of pristine MMT. ... 260 Table 5-14 Activation energies of diffusion of p-terphenyl in PVA equilibrated at 28% of relative humidity ... 261 Table 5-15 Calculated Kcontrast values versus basal spacing (d) of clay for aromatic solutes . 266 Table 5-16 Reported performances of the different systems. ... 267
Due to a significant concern for the contamination of food products by substances originating from materials in contact such as packaging materials, INRA (Institut National de la Recherche Agronomique) has collected diffusion coefficients (D) in different polymers (Begley et al., 2005; Cottier et al., 1997; Feigenbaum et al., 2005; Pennarun et al., 2004a; Pennarun et al., 2004b; Pinte et al., 2010; Pinte et al., 2008; Reynier et al., 2001a; Reynier et al., 2001b; Vitrac et al., 2006) as a public mission (Feigenbaum et al., 2002; Nguyen et al., 2013; Vitrac and Hayert, 2007a) and for sanitary survey(Gillet et al., 2009; Vitrac et al., 2007a; Vitrac and Hayert, 2005; Vitrac and Leblanc, 2007). For several decades, the common opinion has been that D values of organic solutes such as additives (e.g. antioxidants, light-stabilizers, plasticizers…), oligomers or non-intentionally added substances (e.g. residues, contaminants, neoformed substances…) were intrinsic properties of polymers and could be only raised in conditions of use due to temperature increase or plasticization. Decreasing D values were thought possible only by changing the design of the packaging assembly (i.e. by inserting a barrier layer between the source and the food) or by blending the barrier material with a higher glass transition temperature (Tg) into the base polymer (Lange and Wyser, 2003). In appearance, diffusion of large and bulky substances in solid thermoplastic polymers suffers a lack of interest from the scientific community. The likely reasons are in two aspects: i) diffusion coefficients of organic substances in solid thermoplastics are spread over several decades requiring long-term measurements or a combination of different techniques at microscopic and macroscopic scales to reach accurate determinations (Goujot and Vitrac, 2013; Moisan, 1980; Roe et al., 1974; Vitrac and Hayert, 2006; Vitrac et al., 2007b); ii) most of the reported works in the literature focused on the transport of gas molecules, mainly oxygen and water (Marais et al., 1999; Métayer et al., 1999; Xu et al., 2001), initially with an intent of understanding diffusion (Bavisi et al., 1996; Bharadwaj and Boyd, 1999; Pavel and Shanks, 2005) and subsequently with an intent of developing new barrier materials (Alexandre et al., 2009; Andrade et al., 2003; Beake et al., 2004; Fang et al., 2005; Hiltner et al., 2005; Liu et al., 2004).
During the last decade, two main trends extended the perspective of barrier materials:
o new biosourced or biodegradable materials, used as mono-materials such as polyesters (Liu et al., 2004; Ray et al., 2003; Shogren, 1997)(Baker et al., 2008) or used in blends with polymers from vegetable (Averous, 2004) or animal (Matet et al., 2013) sources, and requiring optimization in particular to increase their resistance to water;
o the development of nanocomposite systems as a solution to the increasing demand for environmental friendliness and materials with improved barrier properties (Bordes et al., 2009; Bordes et al., 2008; Follain et al., 2013; Katiyar et al., 2011; Lagaron and Lopez-Rubio, 2011; Li et al., 2013; Martucci and Ruseckaite, 2010; Sanchez-Garcia and Lagaron, 2010; Singh et al., 2010; Svagan et al., 2012; Vartiainen et al., 2010; Yu et al., 2006).
Although most of hybrid systems are not yet authorized in the EU due to insufficient migration and toxicological data (Arora and Padua, 2010; Cushen et al., 2013; Espitia et al., 2012; Restuccia et al., 2010; Rhim and Ng, 2007), the concept of nanocomposite materials for food contact is flourishing in the literature. The reviews of (Azeredo, 2009; Hatzigrigoriou and Papaspyrides, 2011) list not only enhanced barrier properties but also novel attributes such as antimicrobial properties (Espitia et al., 2012), oxygen scavenging (Busolo and Lagaron, 2012), enzyme immobilization, and sensor of food storage conditions. The presence of nanoparticles could have also additional benefits by reducing the risk of release of plastic additives (De Abreu et al., 2010).
The reported physical principles of barrier effects in nanocomposites have been reviewed by (Choudalakis and Gotsis, 2009) and comprise: delamination/exfoliation effects, orientation effects, aspect ratio effects, local polymer reordering (i.e. Tg shift, densification/ dedensification, crystallization-induced). All combined effects were however associated to reductions of permeability lower than one decade and insufficient to transform poor barrier materials into good ones. The work of Merkel et al. (2002a; 2002b; 2003) describes an increase of free-volume around inclusions instead, which tends to increases conversely permeability (Hill, 2006).
The thesis addresses the barrier problem from a different interest i) by focusing on organic molecules instead of gases or water vapor ii) by using modeling as a tool to understand and optimize barrier effects. The initial motivation was to develop new concepts to be used for biodegradable materials (such as polylactide, polycaproclactone), but the work must be envisioned in a broader acceptation of materials incorporating nano-adsorbents to be used as packaging material or as separation membrane. For the first application, the main goals are limiting the sorption of food constituents (e.g. lipids or aroma) (Ducruet et al., 2007) in packaging materials or to prevent the leaching of substances (Courgneau et al., 2013). For the second application, it is more prospective but significant results have been recently
discovered by showing that silica beads could block beyond existing theories (Janes and Durning, 2013) in n-alkyl acetates in poly(methyl acrylate).
The premises used in this work originate from earlier theoretical works of (Watanabe, 1978) showing that the macroscopic concepts of diffusion and sorption could not be transposed at low scale without significant precaution. In particular, although it is well established that random walks around particles or micro-domains follow well the Smoluchowski equation (von Smoluchowski, 1906) (i.e. continuous approach), it is only true after sufficiently many jumps or after a time much longer than a jump itself. In the vicinity of inclusions, the reality may be different and lead to new properties. The main initial application was the description of the escaping time of radicals around traps or quenchers. The results show a well-known result in chromatography: multiplying the number of independent adsorption time increases proportionally the escape/elution time. Such coarse ideas have been generalized in the theoretical work of (Kalnin and Kotomin, 1998) on the generalization of Maxwell-Garnett equation in materials comprising inclusions. The generalization addresses the random walk or trace diffusion of substances in inhomogeneous materials crossing energy barriers as depicted in Figure 1-1. It is shown that significant energy barriers between phases are able to decrease significantly the effective diffusion coefficient regardless the organization of phases and the diffusion coefficient in the continuous phase. Additional proofs on the strong effects of the asymmetry of energy barriers on effective diffusion coefficients can be found in Karayiannis et al. (2001) and (Vitrac and Hayert, 2007b).
Figure 1-1 Different cases of energy barriers between the matrix and inclusions, {li}i=1..2 , {Ei}}i=1..2 are the hop length and the activation energy of diffusion in the inclusions i=1 and in the matrix i=2. (a) An inclusion with a diffusion coefficient in the inclusions smaller than in the matrix; there is no significant energy barrier between them. (b) An energy barrier Ea for the penetration into inclusion. (c) Partial trapping of particles inside inclusions, the “detrapping” energy is Et. After Figure 2 of Kalnin and Kotomin (1998).
The thesis explored these phenomena by molecular modeling/simulation and from an experimental point of view. Experiments were used at two stages: to supply reference transport or thermodynamic data to validate calculation methods and theories but also to
recommended in such engineering problems (Xiao et al., 2010), calculations and theories provided support and methods to detect non-conventional effects with particles and means to optimize them by a proper choice of systems and thermodynamic conditions. From previous considerations and because trapping can have both an enthapic (i.e. energetic barrier) or an entropic (i.e. correlations) origin, the general approach should be seen as combination of concepts from chromatography and diffusion in amorphous polymers. The document is organized consequently as follows. Section two reviews available theories of diffusion in amorphous polymers and their recent evolutions for systems containing inclusions or not. Emerging concepts for extending free-volume theories of diffusion or to trap reversibly or not organic solutes are particularly illustrated. Section three details the objectives followed and the corresponding experimental or computational strategies. The choices of systems are justified as a balance between feasibility and cognitive needs. The main materials and methods are detailed in section four. Results are presented in section five as independent studies corresponding to the three majors of the thesis: i) to understand enough diffusion in amorphous polymers to detect adsorbent effects, ii) to estimate the energetic barrier on commercially available nano-adsorbents, iii) to probe the concepts on real systems and assessing the remaining distance of progress. Finally the findings are summarized in section six and the concepts are challenged based on the recent results of (Janes and Durning, 2013).
In mass transfer, the concept of barrier materials is a somewhat contentious concept, which has been interpreted differently in different contexts. The notion of barrier is very often related to the macroscopic idea of low permeability (Hansen, 2007), which implies that the reservoir of substance to block is located outside the material. The practical consequence is that the substance needs both i) to be absorbed in the material before diffusing inside and ii) to diffuse along a significantly long period of time so that a steady concentration profile (linear if the diffusion coefficient is uniform) is obtained. Many data have been published for gases (Stern and Fried, 2007) and lead to several prediction attempts. One of this model has been coined by its author Salame (1986) as “Permachor” which has been proposed to extrapolate the permeability of any simple gas in any arbitrary polymer from its permeability in reference polymer at the same temperature (see page 676 in van Krevelen and te Nijenhuis (2009)). In simple words, the approach argues that the relative permeability between two rubber polymers should be independent of the considered substance. Is it true for larger substances? The behavior of a new polymer could be predicted from its barrier performance to one single gas (e.g. helium, oxygen)? As some authors suggest that the approach could also work for large organic substances (Prasad and Brown, 1995), the approach might be highly attractive. But as quoted by van Krevelen page 557 (van Krevelen, 2012), the approach is mainly correlative and does not provides any recommendation to lower the permeability of any new polymer (e.g. composite, semi-crystalline,…) except that permeability decreases as the ratio of cohesive energy density and fractional free volume in the polymer.
Is it possible to transpose similar ideas when the substance is already inside the material as part of its initial composition or if the substance diffuses so slowly that it did not reach opposite side? The answer is no as solubilization and diffusion are closely intricate within the permeability concept. Similarly, the barrier properties of polymer materials are assessed usually with respect to their barrier performances to gas (e.g. oxygen and water vapor). Naive considerations will suggest that a material that is barrier to gas is also a good barrier to larger molecules such as organic substances. This is however only true when the substance does not plasticize the material by contributing to an excess of free volumes. Is the opposite true? That is, do we need a good barrier to gas to limit the diffusion or permeation of larger molecules? If the material is already barrier for one substance, will it be also a good material for a substance with approximately the same specific volume but with different chemical structure and shape? These raised questions do not provide simple answers. Instead of looking for analytical equations, i.e. quantitative relationships, to describe a complicate reality, an alternative could be to use a molecular or theoretical representation of the “barrier effect” as suggested by Goddard Iii et al. (2001) and Kontogeorgis and Folas (2009).
This section reviews extensively the two main topics necessary to understand how energy barriers could be used to modulate effective diffusion coefficients in solid polymers. At first sight, the suggested idea should violate the common belief that sorption and diffusion are macroscopically independent properties. Without prejudging the origin of a possible coupling at microscopic scale, section 2.1 explores theories, data and models of diffusion of organic solutes in rubber polymers from solid to molten states. The expected outcome is a general representation of diffusion and models, which could be used to detect non-standard effects, such as those involving interactions with nano-particles. In particular, it is a priori thought that they could be related as specific deviations when a solute or temperature is changed. The concepts of barrier materials are clarified in section 2.2 by considering that a “good barrier” material is a material, which prevents permeation, sorption and desorption phenomena. With this respect, the claimed barrier performance of composite systems, nano or not, are compared with their real ability to reduce robustly diffusion coefficients. The strategies to gain additional selectivity in the blocking of substances are also presented.
Diffusion in food packaging materials
2.1
Article: Predicting diffusion coefficients of chemicals in and through packaging materials Authors: X. Fang, O. Vitrac
Predicting diffusion coefficients of chemicals in and through packaging
materials
Xiaoyi Fang1,2, Olivier Vitrac2,1*
1AgroParisTech, UMR 1145 Ingénierie Procédés Aliments, F-91300 Massy, France 2INRA, UMR 1145 Ingénierie Procédés Aliments, F-91300 Massy, France
Predicting diffusion coefficients of chemicals in and through packaging
materials
Abstract 2.1.1
Most of the physicochemical properties in polymers such as activity and partition coefficients, diffusion coefficients and their activation with temperature are accessible to direct calculations from first principles. Such predictions are particularly relevant for food packaging as they can be used (1) to demonstrate the compliance or safety of numerous polymer materials and of their constitutive substances (e.g. additives, residues…), when they are used: as containers, coatings, sealants, gaskets, printing inks, etc. (2) or to predict the indirect contamination of food by pollutants (e.g. from recycled polymers, storage ambiance…) (3) or to assess the plasticization of materials in contact by food constituents (e.g. fat matter, aroma…). This review article summarizes the classical and last mechanistic descriptions of diffusion in polymers and discusses the reliability of semi-empirical approaches used for compliance testing both in EU and US. It is concluded that simulation of diffusion in or through polymers is not limited to worst-case assumptions but could also be applied to real cases for risk assessment, designing packaging with low leaching risk or to synthesize plastic additives with low diffusion rates.
Keywords: diffusion, packaging, mathematical modeling, molecular modeling, migration Introduction
2.1.2
The evolution of our urban lifestyles (takeout food, portioned packaging food, ready-to-eat food or microwaved food...) inevitably leads to a lot of concerns not only of sustainability impacts of packaging (Lewis et al., 2010) but also of packaging food safety involving an increase of the surface area of the materials in contact with food and consequently to a repeated exposure to chemical substances leached by these materials (Delmaar et al., 2005; van Leeuwen and Vermeire, 2007; Halden, 2010). Even if food contact materials are not the only source of exposure, such a chronic exposure starts from the first stages of life: during fetal life with the food ingested by the mother (Ranjit et al., 2010) and baby foods (Muncke, 2011). The exposure related to ubiquitous substances (i.e. highly frequent in food) depends on the considered substance or family, its frequency of occurrence, the time and temperature of contact between the food and its packaging (Vitrac and Hayert, 2005, 2007a; Vitrac and Leblanc, 2007; Poças et al., 2010) and in a less extent additional physicochemical factors such as pH and ozone content, which were found significant for the migration of bisphenol A
packaging materials have been reviewed by Poças and Hogg (2007). They attract nowadays more and more attention due to the high concern for the contamination of packaged food product by endocrine disruptors (Vandenberg et al., 2009; Wagner and Oehlmann, 2009; Tacker, 2011; Batra, 2011; du Yeon et al., 2012) or cocktail of substances (Muncke, 2009; Zeliger, 2011). As a result, packaging materials are involved in strong scientific controversies propagated by evocative titles or editorials in both magazine and scientific literature such as: "How dangerous is Plastic" in Time Magazine of April 12, 2010 (Walsh, 2010); "…the drinking water left in a hot car can cause breast cancer" in Nature Reviews Endocrinology of May, 2010 (Heath, 2010). Two controversies have found large echoes in the scientific literature: the contamination of drinking water stored in polyethylene terephthalate bottles (Bach et al., 2012) and the role of packaging on the exposure to bisphenol A (Vandenberg et al., 2009; Goetz et al., 2010; Sharpe, 2010; Siva, 2012). Without necessarily similar audience, many surveys tend to incriminate almost all available materials in the market including: plastics (Wittassek and Angerer, 2008; Felix et al., 2008; Guart et al., 2011; Bach et al., 2012; Kappenstein et al., 2012), can coatings (Poole et al., 2004), paper and board (D'Hollander et al., 2010; Vollmer et al., 2011). These experimental studies are macroscopic and usually neglect the physicochemical details and the conditions, where the amounts transferred to the food are significant. Such phenomena have been reviewed by Lau and Wong (2000), Piringer and Baner (2000, 2008), Helmroth et al. (2002a), Arvanitoyannis and Bosnea (2004), Poças et al. (2008). They all conclude on the key role of diffusion and its activation on migration of organic substances (e.g. additives, polymer residues) and mineral substances (e.g. catalyst residues) (Fordham et al., 1995; Kawamura et al., 2009; Welle and Franz, 2010; Haldimann et al., 2012). Diffusion mechanisms in solid polymers have been discussed in several reference textbooks (Mehrer, 2010; Neogi, 1996; Stastna and De Kee, 1995; Vieth, 1991) and reviews. They tend however to focus either on the diffusion of gas molecules in polymers (Alexander Stern, 1994; Klopffer and Flaconneche, 2001) or large molecules in gels (Masaro and Zhu, 1999). Hence, there is a general opinion according to: diffusion coefficients of additive-like molecules could not be predicted accurately (page 156 of Cussler (2009)) or related to the chemical structures of the diffusants (page 135 of Piringer and Baner (2008)). The practical consequence is that migration modeling concepts used to check the compliance of food contact materials or for evaluating consumer exposure to packaging substances rely on models (Helmroth et al., 2002a; Begley et al., 2005) disconnected from the progress gained in the field of Polymer Science or more broadly in Chemical Engineering over the last decade. The question is all the more relevant than it could be expected that the same science might be used to design low migration materials assemblies and to assess the safety of
materials (Vitrac and Hayert, 2007a; Nguyen et al., 2013). For complementary properties, such as partition coefficients (Tehrany and Desobry, 2004) and their activation with temperature, it has been demonstrated that both molecular dynamics (Hess et al., 2008; Hess and van der Vegt, 2008; Özal et al., 2008; Boulougouris, 2010, 2011; De Angelis et al., 2010) and advanced molecular simulation techniques (Gillet et al., 2009a, 2010; Vitrac and Gillet, 2010) enable tailored and accurate estimations of partition coefficients of additive and polymer residues in rubber and glassy polymers (Lipscomb, 1990) without requiring any fitting procedure or experimental data. Similar trends have been obtained for diffusion coefficients, by simulating hundreds of configurations with coarse-grained molecular dynamics (Durand et al., 2010) and by bridging free-volume theories for small and rigid solutes with the theory of flexible solutes in solid polymers (Fang et al., 2013).
This review aims at filling the gap between disciplines to encourage a more critical use of physical models of diffusion rather than empirical approaches to extend the applications where migration modeling can be used for decision making (Brandsch et al., 2002; Arvanitoyannis and Bosnea, 2004; Vergnaud and Rosca, 2006; Vitrac and Hayert, 2007a ; Gillet et al., 2009b). Such contributions could be also thought to be used to assess consumer exposure to arbitrary substances whatever the availability of contamination data and to develop safe materials. In particular, the concepts of homologies which enable to extrapolate the diffusion coefficient of from one molecule to a close one or from a polymer to another one are detailed in depth beyond early attempts by Reynier et al. (2001a), Reynier et al. (2001b) and Vitrac et al. (2006).
The concepts of “generally recognized diffusion models” in legal US and EU 2.1.3
systems
US and EU manage the risk of contamination of food by packaging substances by two closely related concepts but with different application modalities: “food contact substance notifications” under the US law and “inert food contact materials” principles in EU regulations.
According to US law, only the regulatory status of the components of a food contact material is tested and not the whole material itself. Under section 409(h)(2)(C) of the Federal Food, Drug, and Cosmetic Act (CFR, 2011) , a “food contact substance” is defined as a special (i.e., indirect (Till et al., 1987)) food additive “intended for use as a component of materials used in manufacturing, packing, packaging, transporting, or holding food if such use is not intended to have any technical effect in such food”. Coatings, plastics, paper, adhesives, as well as