TH `
ESE
TH `
ESE
En vue de l’obtention du
DOCTORAT DE L’UNIVERSIT´
E DE TOULOUSE
D´elivr´e par :
l’Universit´e Toulouse 3 Paul Sabatier (UT3 Paul Sabatier) Cotutelle internationale avec :
University of Science and Technology of China
Pr´esent´ee et soutenue par :
Yi WANG
le lundi 6 mars 2017 Titre :
Imagerie haute r´esolution des structures lithosph´eriques par inversion de formes d’ondes P t´el´esismiques courte p´eriode
´
Ecole doctorale et discipline ou sp´ecialit´e :
SDU2E : Sciences de la Terre et des Plan`etes Solides
Unit´e de Recherche :
G´eosciences Environnement Toulouse (UMR 5563)
Directeur/trice(s) de Th`ese :
S´ebastien CHEVROT Sidao NI
Jury :
Anne PAUL DR,CNRS-ISTerre, Grenoble Rapporteur
Li ZHAO Senior scientist,IES, Taipei Rapporteur
Fr´ed´eric MOUTHEREAU Professeur UPS, Toulouse Examinateur
Gy¨orgy HET ´ENYI Professeur UNIL, Lausanne Examinateur
S´ebastien CHEVROT DR,CNRS-GET, Toulouse Directeur de Th`ese
Sidao NI Professeur USTC, Hefei Codirecteur de Th`ese
Dimitri KOMATITSCH DR,CNRS-LMA, Marseille Invit´e
Résumé
La tomographie sismique permet d’imager l’intérieur de la Terre à partir de l’observation des ondes sismiques faite à la surface. L’inversion de forme d’ondes complètes est une méth-ode tomographique qui permet d’imager les structures lithosphériques de petite échelle. Cette approche demande des méthodes numériques efficaces et précises pour résoudre l’équation des ondes dans des milieux hétérogènes complexes. En théorie, la limite de résolution que l’on peut atteindre avec cette technique est de l’ordre de grandeur de la plus petite longueur d’onde présente dans le champ d’onde utilisé. Du fait de son coût élevé en temps de calcul, l’inversion de formes d’ondes complètes constituait encore récemment un formidable défi pour le sismo-logue. Cependant, cette situation est en train d’évoluer rapidement du fait des progrès récents à la fois des moyens de calcul haute performance ainsi que des méthodes numériques, mais aussi des déploiements de réseaux denses à l’échelle régionale.
Dans cette thèse, nous nous sommes intéressés à l’imagerie haute résolution des structures lithosphériques sous la chaine des Pyrénées par inversion de formes d’ondes P télésismiques courte période. L’objectif principal est d’apporter des contraintes nouvelles sur le taux de rac-courcissement subi par cette chaine de montagnes pendant la convergence alpine. Nous utilisons une méthode de modélisation hybride qui couple une méthode de propagation d’onde globale 1D à une méthode d’éléments spectraux 3D à l’échelle régionale. Cette méthode hybride permet de coupler les champs globaux et régionaux sur les bords du domaine régional 3D. Elle limite les calculs 3D qui sont extrêmement couteux à l’intérieur du domaine régional, ce qui permet de réduire considérablement le temps de calcul. La méthode hybride permet ainsi de modéliser des sismogrammes synthétiques jusqu’à des périodes de l’ordre de la seconde, en prenant en compte toutes les complexités qui peuvent affecter la propagation des ondes dans le domaine régional 3D. A l’aide de cette méthode, il est également possible de calculer par la méthode de l’adjoint les dérivées de Fréchet qui relient les perturbations des formes d’onde observées aux perturbations des paramètres élastiques et de la densité dans le milieu. Ces noyaux de sensibilité sont utilisés pour formuler un problème inverse résolu par un algorithme itératif de type L-BFGS. Nous inversons les données de 5 sources télésismiques enregistrées par deux transects denses déployés au niveau des Pyrénées occidentales et centrales pendant l’expérience PYROPE. Nous avons ainsi obtenu les premières sections haute résolution de vitesses des ondes P et S au travers d’une chaine de montagnes. Les modèles tomographiques apportent des évi-dences claires en faveur d’un sous charriage de la plaque ibérique sous la plaque européenne. Ils montrent également l’importance de l’héritage et en particulier des structures liées à l’épisode de rifting crétacé dans la structuration de la chaine.
Les mots-clés: L’inversion de forme d’ondes, La tomographie sismique, Imagerie par
Seismic tomography allows us to image the Earth’s interior based on surface observations of seismic waves. The full waveform inversion (FWI) method has the potential to improve tomo-graphic images for the fine scale structures of the lithosphere. For this reason it receives a lot of attention of seismologists. FWI requires an efficient and precise numerical techniques to solve the elastic wave equation in 3D heterogeneous media. Its resolution potential is limited by the shortest wavelength in the seismic wavefield and the wavefield sampling density. Because of the high computational cost of modeling the propagation of seismic waves in heterogeneous media, FWI remains challenging. However, owing to the progress in high performance computational resources and numerical simulation techniques, as well as the deployment of permanent and temporary broadband arrays in the last two decades, this situation has changed dramatically.
In this thesis, we focus on the high resolution imaging of lithospheric structure beneath the Pyrenean range by FWI, to quantify the highly controversial amount of convergence that occurred during the formation of this mountain range. In order to obtain finely resolved tomo-graphic images, we exploit short period teleseismic P waves recorded by dense transects. We use a hybrid method that couples a global wave propagation method in a 1D Earth model to a 3D spectral-element method in a regional domain. A boundary coupling approach is used to match the global and regional wavefields on the boundaries of the regional domain. This hybrid method restricts the costly 3D computations inside the regional domain, which dramatically decreases the computational cost. The hybrid method can model teleseismic wavefields down to 1s period, accounting for all the complexities that may affect the propagation of seismic waves in the 3D regional domain. By using this hybrid method, the sensitivity kernels of the least square waveform misfit function with respect to elastic and density perturbations in the re-gional domain are computed with the adjoint state method. These waveform sensitivity kernels are used in an iterative L-BFGS algorithm to invert broad-band waveform data recorded by two dense transects deployed during the temporary PYROPE experiment across the Pyrenees mountains. We obtain the first high resolution lithospheric sections of compressional and shear velocities across the Pyrenean orogenic belt. The tomographic models provide clear evidence for the underthrust of the thinned Iberian crust beneath the European plate and for the important role of rift-inherited mantle structures during the formation of the Pyrenees.
Keywords: Waveform inversion, Seismic tomography, Regional array imaging, Teleseismic
Introduction générale
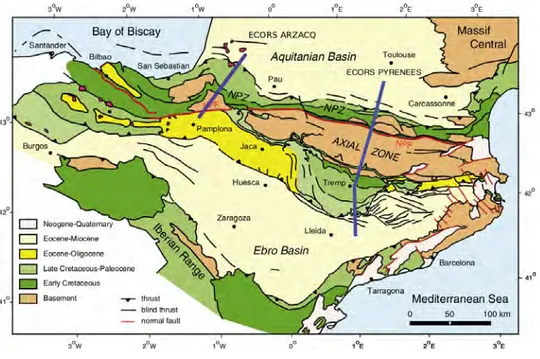
Exploiter les données sismologiques pour caractériser l’intérieur de notre planète reste un enjeu majeur de la sismologie moderne. Bien que des progrès importants ont été accomplis, de nombreuses questions restent ouvertes, en particulier à l’échelle régionale. Dans cette thèse, nous nous sommes intéressés à l’imagerie des structures lithosphériques sous la chaine des Pyrénées. Les Pyrénées, qui constituent la partie la plus jeune de la chaine Alpine, résultent de la convergence des plaque Ibérie et Europe pendant le Cénozoïque. C’est un orogène orienté E-O qui est bordé par deux bassins flexuraux: le bassin de l’Ebre au sud et la bassin aquitain au nord. Les structures lithosphériques sous les Pyrénées, qui sont la clé pour comprendre le support dynamique de la topographie et pour la reconstruction cinématique de cette marge convergente, restent très mal connues. Deux grands profils de sismique active ont été acquis pendant le programme ECORS au cours des années 80 afin d’imager l’architecture profonde de cette chaine de montagnes: les profils ECORS-Pyrenees et ECORS-Arzacq. Différentes interprétations des sections obtenues ont été proposées dans la littérature. Cependant, du fait de la difficulté d’illuminer les réflecteurs profonds et de l’ambigüité de leur migration en profondeur, de larges pans de l’architecture profonde des Pyrénées restent controversés. Par exemple les structures dans la croûte supérieure ou la géométrie du Moho restent très incertains. Deux expériences temporaires, PYROPE et IBERARRAY, ont ainsi été déployées pour tenter d’apporter des contraintes nouvelles sur l’architecture profonde des Pyrénées. Ces ex-périences ont ouvert de nouvelles perspectives pour imager les structures lithosphériques avec des approches d’imagerie passive. Pour compléter ce dispositif, deux transects denses ont égale-ment été déployés au travers des Pyrénées centrales et occidentales d’octobre 2011 à octobre 2013. Ces deux profils suivaient approximativement le tracé des deux lignes ECORS.
Cependant, l’imagerie fine des structures lithosphériques sous cette chaine de montagnes restait un défi, qui a demandé de faire évoluer les méthodes d’imagerie classiques reposant encore largement sur des théories asymptotiques vers des méthodes exploitant les formes d’ondes complètes. Ces méthodes d’inversion de formes d’ondes ont une limite potentielle de résolution spatiale de l’ordre de la moitié de la plus petite longueur d’onde présente dans le champ d’onde. Cependant, ces méthodes nécessitent d’utiliser des méthodes numériques précises qui sont très couteuses en temps de calcul. Grâce aux progrès à la fois théoriques et méthodologiques récents, ces calculs sont dorénavant à la portée des sismologues. Dans cette thèse, nous avons utilisé une méthode hybride qui couple une méthode de propagation d’onde dans une Terre globale de symétrie sphérique, à une méthode d’éléments spectraux 3D dans un domaine régional. Cette méthode hybride permet de calculer des sismogrammes synthétiques jusqu’à des périodes de l’ordre de la seconde, en prenant en compte toutes les complexités qui pourraient affecter la propagation des ondes sismiques dans le domaine régional: topographie de la surface libre et des discontinuités internes, variations latérales de vitesses isotropes et anisotropes, atténuation,
aux perturbations des paramètres élastiques dans le domaine régional à l’aide de la méthode de l’adjoint. Ces noyaux de sensibilité ou dérivées de Fréchet ont permis d’inverser de façon itérative les composantes radiales et verticales des formes d’ondes P télésismiques à courte période enregistrées par les deux transects pyrénéens. L’inversion repose sur un algorithme itératif L-BFGS de type Gauss-Newton. Les images tomographiques obtenues nous ont permis d’apporter de nouvelles contraines sur le taux de raccourcissement dans les Pyrénées centrales et occidentales.
Dans le premier chapitre, nous passons en revue les principales questions encore ouvertes portant sur la formation et l’évolution des Pyrénées. L’inversion de forme d’ondes complètes, la méthode de l’adjoint, et les méthodes hybrides sont également revues.
Dans le chapitre 2 nous présentons les trois ingrédients nécessaires pour résoudre le problème direct: la méthode hybride, la construction du maillage 3D des 2 domaines pyrénéens, ainsi que l’estimation des ondelettes source.
Dans le chapitre 3 nous présentons la méthode de calcul des dérivées de Fréchet ainsi que l’algorithme itératif d’inversion de formes d’ondes complètes.
Dans le chapitre 4, nous présentons la méthode de traitement et de sélection des données sismologiques.
Dans le chapitre 5, nous montrons les résultats de la première application de notre méthode d’inversion de formes d’ondes aux données récoltées le long du transect déployé à l’ouest des Pyrénées. Le modèle tomographique obtenu est décrit et interprété.
Dans le chapitre 6, nous appliquons la même méthode aux données du transect central. Du fait d’un niveau de bruit plus élévé, nous avons du envisager différentes stratégies d’inversion, qui ont été testées sur des jeux de données synthétiques calculés dans des modèles en damiers. Nous présentons un modèle et quelques interprétations pour ce transect, qui restent encore préliminaires.
General introduction
Using seismological data to characterize the internal structure of our planet is one of the key tasks of modern seismology. Even though many progresses in our understanding of the Earth’s interior have been accomplished, there are still many open questions, especially at the regional scale. In this thesis, we will focus on the imaging of lithospheric structures beneath the Pyrenean orogenic belt.
The Pyrenees mountains, which are the youngest part of the Alpine-Himalayan collisional orogenic belt, was produced by the convergence between the Iberian and European plates dur-ing the Cenozoic. It is an east-west, bivergent orogen between two foreland basins, the Ebro basin in the south and the Aquitaine basin in the north. The lithospheric structures beneath the Pyrenees, which are key to understanding the support of topography and for kinematic reconstructions at this convergent plate boundary, are still poorly known. In order to image the architecture of the Pyrenees, two active source seismic experiments were carried out during the ECORS program: the ECORS-Pyrenees and ECORS-Arzacq profiles. Different geological interpretations of these deep reflection surveys have been proposed. However, because of the difficulty in illuminating the deep structures with active source experiments and the inherent ambiguity of deep reflector migration, many parts of the Pyrenees architecture remained contro-versial. For instance, the structures of the upper crust and the geometry of the Moho interface remain uncertain.
To get further insight into the deep architecture of the Pyrenees, the temporary PYROPE and IBERARRAY experiments have been deployed in the Pyrenees, opening new opportunities to image lithospheric structures with passive imaging approaches. In addition, two dense tran-sects were deployed across the Pyrenees between 2011 and 2013, approximately following the previous ECORS profiles, in order to better constrain the geometry of this collisional orogen.
However, obtaining finely resolved tomographic images of lithospheric structures beneath this orogen belt remained a challenge, which involved moving from simplified tomographic methods relying on asymptotic descriptions of the wavefield to waveform inversion methods exploiting the complete wavefield. Full waveform inversion has a theoretical resolution limit of the order of half of the shortest wavelength in the seismic wavefield, but it requires accu-rate numerical techniques to simulate the propagation of seismic waves in 3D heterogeneous media, which is still computationally demanding. Owing to recent theoretical and numerical developments, this problem can now be tackled by seismologists. In this thesis, we have used a hybrid method that couples a global wave propagation method in a spherically symmetric Earth model to a 3D spectral-element method in a regional domain. This allows us to com-pute synthetic seismograms down to 1 s period, accounting for all the complexities that may affect the propagation of seismic waves in the regional domain: the topography of free surface and of internal discontinuities, lateral variations of isotropic and anisotropic elastic properties,
to elastic and density perturbations in the regional domain based on the adjoint state method. These sensitivity kernels are then used to invert the vertical and radial short period teleseismic P waveforms recorded by dense regional arrays. The inversion relies on an iterative quasi-Newton L-BFGS algorithm. Compared to general gradient-based algorithms, the L-BFGS algorithm which has a faster convergence rate significantly reduce the computational cost for the non-linear waveform inversion. The obtained tomographic images allow us to quantify the highly controversial amount of convergence in the western and central Pyrenees.
In Chapter 1 we review the main open questions regarding the formation and evolution of the Pyrenees. The full waveform inversion, the adjoint state method, and the hybrid approaches are also reviewed.
In Chapter 2 we give an overview of the three main ingredients involved in the forward problem: the DSM/SEM hybrid method, the construction of the 3D regional mesh for the Pyrenean domains, and the source wavelet estimation.
In Chapter 3 we present the computation of the sensitivity kernels using the adjoint state method and the full waveform inversion algorithm.
In Chapter 4 we discuss our data processing method and perform the checkerboard resolution tests for the western Pyrenees.
In Chapter 5 we apply our full waveform inversion algorithm to the real data from the western Pyrenees. The new tomographic model for the western Pyrenees is described and interpreted.
In Chapter 6 we invert the real data from the central Pyrenees. Since the data of the central Pyrenees have lower S/N ratio compared to the western Pyrenees, we discuss the inversion strategies based on checkerboard resolution tests. A preliminary model and interpretation for the central Pyrenees transect are also presented.
Acknowledgments
As time goes by, I have spent more than a quarter o my adult life in France. My PhD study is coming to an end. Many people have contributed in a direct or an indirect way to this thesis. First, I owe a special thanks to my Chinese supervisor, Sidao Ni, who brought me into the wonderful field of seismology, offered me this precious opportunity to study in Toulouse, and gives me constant support over these years.
My deepest gratitude goes to my French supervisor, Sébastien Chevrot, for his constant patience and guidance. He teaches me how to explore the seismic waveforms as a seismologist and provide full support for my work. He has walked me through all the stages of the writing of this thesis. Without his consistent and illuminating instruction, this thesis could never have been finished.
It is my honour to be supervised by these two excellent scholars. The most important thing they taught me is not the knowledge of seismology, but methodology and scientific attitude that are the true wealth of the lifetime.
I have also collaborated with many experts in the lab, in particular Dr. Dimitri Komatitsch, Vadim Monteiller and Roland Martin. Many results in this thesis are based on their remarkable works. I would like to give my sincerity appreciation and great respect to them.
The friends I met in Toulouse are warm, funny and helpful. I would like to thank Yu Chen, Xiaojun Feng, Rui Xue, Yu Zhao, Yingning He, Jing Ye, Hongmei Xu, Chuxian Li, Youcun Liu, Xing Huang, Le Yao, Buyun Du, Wei Yuan and Qingyuan Qu for enduring my weird personality. I appreciate collaborations and friendships with my classmates in USTC, Xiaohui He, Xiaoli Wang, Wenbo Wu, Jun Xie and others, who have been always kind to me. I also would like to thank IRAP/GET/USTC staff members, who make my work environment well and my life easier.
Finally, my deep thanks would go to my parents for their unconditional support and love. To my parents-in-law, for their patience and waiting. To my dear Penny for her unselfish love and endless support, especially during the stressful and tough times. This thesis is also dedicated to my lovely naughty son, Ruiqian. Dad really wish you can sleep tight.
Contents
1 Introduction 1
1.1 The open problems in the Pyrenees . . . 1
1.1.1 Overview of the study region: the Pyrenees . . . 2
1.1.2 The open problems regarding the formation and evolution of the Pyrenees 4 1.1.3 Previous geophysical studies . . . 6
1.1.4 The PYROPE and IBERARRAY experiments. . . 12
1.1.5 New results from the data of the PYROPE and IBERARRAY experiments 13 1.1.6 Discussion and directions for further improvements . . . 17
1.2 Towards full waveform inversion of short period teleseismic body waves . . . 19
1.2.1 A review of FWI approaches . . . 20
1.2.2 The hybrid forward modeling technique . . . 26
2 Forward modeling: The Hybrid method and wavelet estimation 29 2.1 The 3D forward hybrid modeling technique . . . 29
2.2 Construction of the 3D regional mesh and computational demands . . . 31
2.2.1 Overview of SPECFEM3D Cartesian package for regional mesh generation 32 2.2.2 The consideration in regional SEM mesh generation . . . 33
2.2.3 Designing regional SEM meshes for the Pyrenees . . . 37
2.2.4 Parallel implementation and partitioning . . . 44
2.2.5 The computational requirements for forward modeling . . . 46
2.3 The source excitation and wavelet estimation . . . 48
2.3.1 The effects of source excitation and propagation on teleseismic waveforms 48 2.3.2 The principle of wavelet estimation . . . 48
2.3.3 Data preparation and Green’s functions computation . . . 50
2.3.4 Wavelet estimation by deconvolution . . . 52
2.3.5 Determination and further applications of source wavelets . . . 55
3 The strategy of Full waveform inversion 71 3.1 General formulation of the FWI problem . . . 71
3.1.1 The gradient and Hessian of the cost function . . . 71
3.1.2 The choice of misfit function . . . 73
3.2 Computation of the gradient based on the adjoint method . . . 74
3.3 The regularization and grids projection . . . 77
3.4 FWI with L-BFGS algorithm . . . 78
3.4.2 Calculation of the step length . . . 81
3.5 Test of the method on a checkerboard model. . . 82
4 Applications of Full waveform inversion to the western Pyrenees transect 85 4.1 Data selection and preparation . . . 85
4.1.1 Initial data inspection . . . 85
4.1.2 Selection of the frequency band . . . 87
4.2 Resolution analysis of FWI for the western Pyrenees: checkerboard test . . . . 98
4.3 FWI results for the western transect . . . 116
4.3.1 Waveform inversion. . . 116
4.3.2 Comparison between different inversion strategies . . . 141
5 The deep roots of the western Pyrenees revealed by full waveform inversion of teleseismic P waves 161 5.1 Abstract . . . 161
5.2 Introduction . . . 162
5.3 Data and waveform inversion method . . . 163
5.4 Tomographic model. . . 163
5.5 Geological interpretation . . . 165
5.6 Discussion and Conclusions . . . 167
5.7 Acknowledgments . . . 168
5.8 GSA Data Repository . . . 169
5.8.1 Dataset . . . 169
5.8.2 Forward modeling . . . 169
5.8.3 Full waveform inversion method . . . 169
5.8.4 Resolution test . . . 170
5.8.5 Modeling of Bouguer gravity anomalies. . . 171
6 Applications of Full waveform inversion to the central Pyrenees transect 175 6.1 Data selection . . . 175
6.2 Resolution analysis . . . 180
6.3 FWI results and the preliminary interpretations . . . 204
7 Discussion and Conclusion 223 7.1 Discussion et conclusion (FR) . . . 224
Introduction
Contents
1.1 The open problems in the Pyrenees . . . 1
1.1.1 Overview of the study region: the Pyrenees . . . 2
1.1.2 The open problems regarding the formation and evolution of the Pyrenees 4
1.1.3 Previous geophysical studies. . . 6
1.1.4 The PYROPE and IBERARRAY experiments . . . 12
1.1.5 New results from the data of the PYROPE and IBERARRAY experiments 13
1.1.6 Discussion and directions for further improvements . . . 17
1.2 Towards full waveform inversion of short period teleseismic body waves 19
1.2.1 A review of FWI approaches . . . 20
1.2.2 The hybrid forward modeling technique . . . 26
1.1
The open problems in the Pyrenees
The development of Earth science has experienced a long history. In 1912, German geologist Wegener proposed the hypothesis of continental drift, opening the prelude to the modern rev-olution of plate tectonics. In the beginning, Wegener’s theory was widely questioned on both geophysical and geological grounds. After the World War II, this situation changed dramati-cally. The notion of seafloor spreading was first proposed by American marine geologist Hess (1962) and marine geophysicist Dietz (1961), who put forward that new seafloor is created at mid-ocean ridges, spreads away, and is subducted in subduction zones.
Building on Wegener’s hypothesis and Hess and Dietz’s contributions, Canadian geophysicist Wilson (1965) developed the theory of plate tectonics and transform faults. Plate tectonics show that the rigid outer layers of the Earth (the crust and part of the upper mantle), also called the lithosphere, decompose into several pieces or "plates". These plates float on the top of an underlying weaker rock layer called the asthenosphere. Rocks are at high temperatures and pressures so that they behave similar to the viscous liquid in the asthenosphere. Wilson conjectured there are three types of plate boundaries: mid-ocean ridges (where ocean crust is created), trenches (where the ocean plates are subducted) and large fractures in the seafloor
called transform faults (where two plates move horizontally from each other). This periodic cycle theory of ocean basins’ opening and closing, is named Wilson cycle. The oceanographic evidence for seafloor spreading (Vine & Wilson, 1965) and development of plate tectonics have validated Wegener’s basic hypothesis that modern continents are drifted fragments of Pangaea, a supercontinent that incorporated almost all the landmasses on Earth and existed during the late Paleozoic and early Mesozoic.
The most important point of view in plate tectonics theory is that the Earth’s surface con-sists of oceanic and continental lithospheres which are divided into plates of varying sizes. The relative motions of these plates occur in three types of plate boundaries(convergent, divergent, or transform). Earthquakes, volcanoes, mountain belts and rifts can develop along these bound-aries. Plate tectonics provide a unifying theory to explain the fundamental processes that shape the Earth’s surface.
However, since the late 20th century, geologists started to recognize that the concepts of plate tectonics often could not apply to describe the deformation of continents which can occur on the much broader region than simply along the plate boundaries. Among the problems of continental dynamics, the formation of continental orogenic belts is of particular importance. Orogenic belts are generally regarded as resulting from the convergent motion of tectonic plates. In general, continental orogenic belts are mainly caused by the thickening of lithosphere after shortening and bending.
Continental orogens are key for understanding the formation and evolution of continental lithosphere. However, the formation of many complex orogenic belts is still poorly understood. Cawood et al. (2009) classified continental orogens into three modes: (1) accretionary orogens with oceanic-type subduction; (2) collisional orogens with continental-type subduction; (3) intra-continental orogens, away from an active plate margin. According to the definitions of Cawood, the oceanic circum-Pacific subduction system is an accretionary orogen, which involves subduction of oceanic lithosphere. A representative example of a collisional orogen is the Alpine-Himalayan system, which formed by subduction and collision between the African, Indian and
Eurasian plates. It is characterized by a deep subduction. The intra-continental orogens,
broadly distributed in continent interiors, are usually considered as the distant effects of the forces acting on the plate boundaries.
1.1.1 Overview of the study region: the Pyrenees
The Pyrenees are the youngest part of the Alpine-Himalayan collisional orogenic belt, the formation of which is closely related to the Tethyan evolution. The Pyrenees are a 453 km long (from west to east), but relatively narrow (150 km wide from north to south) continental collisional orogen located between France in the north and Spain in the south which extend from the northern Iberian margin in the west to the Mediterranean Sea in the east. The average
elevation of the Pyrenees is about 1800 m.
The general structure of the Pyrenees is an asymmetrical double-wedge with a larger exten-sion to the South than to the North (Souriau et al., 2008). The Pyrenees can be divided into
five structural units that are bounded by some major faults (Figure1.1), which are from south
to north (Sibuet et al., 2004; Vergés & Fernàndez, 2012):
1. The Aquitaine foreland basin, filled with early Cretaceous and early Neogene clastic rocks.
2. The north-directed North Pyrenean thrust system, in which Cretaceous flysch deposits are locally highly strained and metamorphosed.
3. The Axial Zone (AZ) made of Hercynian metamorphic and Mesozoic sedimentary rocks. It includes the highest summit, with an elevation higher than 3000 m.
4. The larger South Pyrenean thrust system (Mesozoic and paleozoic series) which is trans-lated southward and overthrust.
5. the Ebro foreland basin in the south, linked to the southern Pyrenean wedge.
NPF NPF NPFT SPFT −4˚ −4˚ −3˚ −3˚ −2˚ −2˚ −1˚ −1˚ 0˚ 0˚ 1˚ 1˚ 2˚ 2˚ 3˚ 3˚ 41˚ 41˚ 42˚ 42˚ 43˚ 43˚ 44˚ 44˚ Ebro Basin Aquitaine Basin Axial Zone NPZ SPZ Bay of Biscay Mediterranean Sea
Figure 1.1:Main geological and structural units of the Pyrenees region. NPF: North Pyrenean Fault, NPFT: North Pyrenean Front Thrust, SPFT: South Pyrenean Front Thrust, NPZ: North Pyrenean Zone, and SPZ: South Pyrenean Zone.
During the Pyrenean orogeny, the flexure of the Iberian and the European plates led to the development of the foreland basins on both sides of the Pyrenees (Brunet, 1986). The North Pyrenean Fault (NPF) is regarded as the suture between the two plates (Souriau et al., 2008). Recent GPS studies indicate that there is no deformation detected across and within the Pyrenees. The relative motion across the Pyrenees has an upper bound of only 0.2 mm/year (Nocquet, 2012). This implies that the convergence between the Iberian and the European
Plates is nowadays inactive.
1.1.2 The open problems regarding the formation and evolution of the
Pyre-nees
Many important aspects of the creation of the Pyrenees still remain controversial. In the
following, we will expose briefly the main open questions regarding the Pyrenees.
1.1.2.1 The problem of plate kinematic reconstruction
The opening of the Bay of Biscay and the formation of the Pyrenees are continuing events tightly linked to the relative displacement of Iberia with respect to Eurasia (Choukroune, 1992). The opening of the Bay of Biscay corresponds to the preorogenic stages of the Pyrenean domain. Three contradictory models for the kinematics of Iberia have been proposed for this opening process (Figure1.2):
(1) A scissors-type opening of the bay with a pole of rotation located in the southeastern Bay of Biscay corner (Sibuet et al., 2004; Vissers & Meijer, 2012).
(2) An opening following a left-lateral strike-slip motion along the NPF, with a pole of rotation located in northern France (Pichon & Sibuet, 1971).
(3) An opening along a transtensional type Iberia-Eurasia plate boundary until the earliest Albian, followed by the beginning of orthogonal extension between Iberia and Eurasia until the
onset of compression at C34 (85 Ma) (Jammes et al., 2009; Choukroune & Mattauer, 1978).
The total rotation of the Iberian plate with respect to the European plate in the first two
models is about 35◦, in good agreement with the paleomagnetic data (van der Voo, 1969).
The second kinematics model (Sibuet & Pichon, 1971; Pichon & Sibuet, 1971) infers that the NPF was a former transform plate boundary. The transtensional pull-apart basins developed along the NPF during the preorogenic period. But according to recent study of plate kinematic reconstructions, it is found that the scissors-type opening of the Bay of Biscay shows a
substan-tially better consistency with the magnetic anomaly M0 (120 Ma) (Sibuet et al., 2004). This
reconstruction implies that there was an opening of a broad oceanic domain (up to 300 km) between Iberia and Eurasia before the Aptian (113-126 Ma). During the Aptian, It gradually closed as a result of the convergence between Iberia and Eurasia. In the meantime, the Bay of Biscay was opening. This inference means that the closure of this oceanic domain should have left a suture located beneath the northernmost part of the Ebro basin, but none has ever been recognized (Sibuet et al., 2004).
Figure 1.2:Three different kinematic reconstruction models of Iberia with respect to a fixed Eurasia at chron M0 (from Barnett-Moore et al., 2016). The light grey contours represent relative plate motions of Iberia in 10
M yr increments until C34. The red triangles represent M0 along the west Iberian margin; the blue circles
represent M0along the Newfoundland margin. The model A presents a scissor-type opening of the Bay of
Biscay. The model B argues a dominant left-lateral strike-slip motion along the NPF. The model C proposes a transtensional motion along the Iberia-Eurasia plate boundary by the earliest Albian. Since this model does not consider the seafloor magnetic anomalies as important kinematic constraints, it shows a large mismatch
between M0 along the west Iberian margin and the Newfoundland margin.
The third plate model is supported by three constraints: (1) the analysis of preserved inverted rift structures along the Pyrenees (Barnett-Moore et al., 2016); (2) a major plate reor-ganization of Iberia occurred during the Aptian; (3) the transtensional motion should accom-modate between 300 and 400 km of continental breakup along the Iberia-Newfoundland margin
in late Aptian to early Albian (Tucholke et al., 2007). However, if the magnetic anomaly M0 is
considered as an isochron, this model shows a large mismatch between the west Iberian margin and the Newfoundland margin, because it does not take into account the seafloor magnetic anomalies which are important kinematic constraints (Barnett-Moore et al., 2016). To recon-cile the kinematic model with geological data, Vissers and Meijer (2012) proposed a new model with the subduction of a Neotethys oceanic domain beneath the Pyrenees. During the Aptian, this subducted slab became gravitationally unstable, detached and sank into the mantle. As a result, asthenospheric mantle rose to form the high temperature metamorphism exposed in the NPZ nowadays. However, because of the absence of intermediate stages between the seafloor
et al., 2011, 2012; Tucholke & Sibuet, 2012). Therefore, the state of the relative displacement between Iberia and Eurasia is still highly questionable.
1.1.2.2 The nature of the Pyrenean domain and the amount of convergence
The nature of the Pyrenean domain during the Mesozoic has direct relation to the Iberian plate kinematic problem previously mentioned, which is still controversial. Early studies pro-posed that during the Cretaceous several asymmetrical pull-apart basins opened along the plate boundary between Iberia and Eurasia. This opening responded to the eastward sinistral strike-slip motion of Iberia along the NPF (Daignières, 1978; Choukroune & Mattauer, 1978). In this model, the NPF played an important role and was regarded as the former plate boundary be-tween Iberia and Eurasia. This model has been challenged, because of the geological structures is continuous across the Pyrenees. This structural continuity excludes any evident left-lateral movement of Iberia with respect to Eurasia after the Early Cretaceous (Souquet & Mediavilla, 1976).
On the other hand, the amount of north-south convergence that occurred during the forma-tion of the Pyrenees is a key indicator to quantify the relative movement between the Iberian and the European plates and to understand the evolution of the Pyrenean orogenic belt. This convergence gave rise to compressional deformation during the Late Cretaceous and Pyrenean orogeny. However, the precise amount of convergence accommodated in the Pyrenees is still highly debated. Shortenings between 50 km and 400 km, varying from east to west, have been proposed (Teixell, 1998; Roure et al., 1989; Muñoz, 1992). Accordingly, different mechanisms have been proposed for this shortening: homogeneous crustal thickening (Teixell, 1998), crustal stacking (Roure et al., 1989), or continental subduction (Muñoz, 1992).
1.1.3 Previous geophysical studies
1.1.3.1 The seismic exploration results
In order to better constrain the Pyrenean deep structure, some active source seismic experiments are performed in the Pyrenees. In 1978, an extensive seismic refraction survey was carried out along two east-west lines, deployed in the axial zone and the NPZ (Pyrenees, 1980). The experiment involved several shots at sea and on land, recorded by two dense profiles. This study showed that the Moho is offset vertically across the NPF by approximately 15 km in the central Pyrenees (Daignières et al., 1982). This Moho step reduces east towards the Mediterranean Sea. The magnitude of this Moho step reaches about 5 km beneath the eastern Pyrenees until it is not observed beneath the Mediterranean Sea any more (Gallart et al., 1980). This Moho step is approximately coincident with the trace of the NPF at the surface. The NPF was thus considered as the plate boundary between Iberia and Eurasia. The thick crustal roots beneath the axial zone evidenced by the refraction survey also provides an interpretation for the evident
east-west negative Bouguer anomaly observed along most of the Pyrenees, towards its eastern termination close to the Mediterranean Sea (Daignières et al., 1982). On the other hand, the strong positive Bouguer anomalies observed in the Labourd and Saint Gaudens regions could be ascribed to the existence of dense materials at shallow depth (Daignieres et al., 1989), but their origin remains uncertain.
From 1985 to 1986, a 250 km long deep seismic reflection profile was performed across the central Pyrenees by the French-Spanish ECORS (Etude Continentale et Océanique par Réflexion et Réfraction Sismique) group. It was the first deep reflection survey covering the whole orogenic belt (ECORS Pyrenees Team, 1988). The profile was deployed across the central
Pyrenees from the Aquitaine basin in the north to the Ebro basin in the south (Figure 1.3).
Figure1.4ashows the line drawing of the ECORS-Pyrenees profile, extracted from unmigrated
reflection data. The clear reflectors in the upper crust obtained from the reflection survey confirmed the fan-like cross-section geometry in the central part of the belt (Choukroune, 1989). This survey also showed that the Iberian crust seems to be 2 s two-way travel time (TWT) thicker than the European crust, with a thickness of approximately 50 km to the south of the NPF. Both the Iberian and European lower crusts show a strong layering above the Moho, with a series of north and south-dipping reflectors explained as Hercynian thrusts (Choukroune et al., 1990). The deep reflectors beneath the NPF show that the Iberian crust lies beneath the southern edge of the European crust beneath the axial zone (Choukroune, 1989). In the external domains, the reflectors near the surface precisely define the locations of major thrusts and crustal structures which have an important influence on the Mesozoic and Cenozoic cover of the Pyrenees (Choukroune, 1992).
Figure 1.3:Previous active source seismic experiments deployed across the central and western Pyrenees: two ECORS deep seismic reflection profiles are shown with darkblue line (modified from Vissers & Meijer, 2012).
As a part of the ECORS project, a wide-angle experiment along the vertical reflection profile was also performed. The wide-angle reflectivity pattern shows the widespread occurrence of north-dipping impedance contrasts embedded in the middle and lower crust (Suriñach et al., 1993). Reconstructions of balanced cross-sections for the central Pyrenees along the ECORS-Pyrenees profile presented an evident discrepancy between the top of the Iberian Palaeozoic basement and the layered Iberian lower crust (Roure et al., 1989). Although the reflectors in the upper crust are well-defined, the deep structure of the central Pyrenees were still poorly constrained. The precise amount of convergence indicated by different geological interpretation is rather controversial, with values ranging from 100 km (Roure et al., 1989) to 147 km (Muñoz, 1992).These differences are mainly derived from the different hypotheses about the location of the missing Iberian lower crust. In the first hypothesis suggested by Muñoz (1992), the Iberian lower crust subducts beneath the European Plate. But the modeling of gravity anomalies and wide-angle seismic experiments suggest that the extension of the Iberian lower crust is less than 20 km beneath the NPZ (Daignieres et al., 1989; Torné et al., 1989). However, this light subducted crustal material has probably been eclogitized, thus possesses density and seismic
velocities similar to those of the surrounding mantle material. Therefore, its detection by
geophysical survey is rather difficult (Roure & Choukroune, 1998). The second hypothesis is that the missing Iberian lower crust is currently stacked beneath the axial zone, leading to the thick crustal root confirmed by ECORS reflection survey (Roure et al., 1989). In this model, the sharp Moho step beneath the NPF suggests that the NPF was a subvertical transform plate boundary. This model implies that the Albian basins were formed as pull-apart basins along the North Pyrenean fault system. These two extreme models are both compatible with the observations of ECORS profile beneath the axial zone since the deeper seismic reflectors in the lithosphere are not resolved well. Therefore, although the ECORS-Pyrenees profile put considerable first order constraints on the crustal structures in the central Pyrenees, it was still insufficient to end the controversies on the deep architecture of the Pyrenees. The illustrations
(a) Unmigrated reflection data from ECORS-Pyrenees profile.
(c) Interpretations of the ECORS-Pyrenees profile.
Figure 1.4:Line drawing of the unmigrated reflection data (from Roure et al., 1989) and two main interpretations of the ECORS-Pyrenees profile (from Chevrot et al., 2015). (A) Model with subduction of Iberian lower crust, as proposed in Muñoz (1992). (B) Model with stacking of the Iberian crust beneath the axial Zone, as proposed in Roure et al. (1989).
In the late eighties, another 100 km long seismic reflection profile was deployed in the
western Pyrenees (Figure 1.3), at the limit between the Arzacq Basin and the Mendibelza
Massif (Daignières et al., 1994). In the western Pyrenees, the middle and lower crust of the NPZ appears to be highly heterogeneous with high compressional wave velocity (Daignières et al., 1994). The previous refraction surveys show that the thickness of the crust is 45 km to the south of the Mendibelza Massif, but less than 30 km beneath the Mauléon basin (Daignières et al., 1994). Based on unmigrated seismic reflection data from the ECORS-Arzacq deployment
(Daignières et al., 1994), figure1.5a shows the line drawing of this vertical reflection profile.
(a) Unmigrated reflection data from ECORS-Arzacq profile.
(b) Crustal section of the west Pyrenees.
Figure 1.5:Reflection data and interpretation of the ECORS-Arzacq profile (from Teixell, 1998). (a) Line drawing of the unmigrated ECORS-Arzacq vertical reflection profile, from the published data given by
Daignières et al. (1994). The evident subhorizontal reflections at 9 to 10 s two-way time along the entire profile are identified as the European Moho. The dipping reflections at 14 to 18 s TWT in the southern part of the profile display the underthrusting of the Iberian lower crust. (b) Teixell’s crustal section of the western Pyrenees. The cross-section shows the stacked tectonic wedges at different crustal levels, formed by deep indentation of the Iberian crust by the European crust. The structures of the crustal root and the European crust are imaged by the ECORS-Arzacq profile shown with the red frame. The dotted pattern indicates Tertiary rocks. The dashed line in the northern Pyrenees displays the top of Jurassic.
From the northern Axial Zone to the southern edge of the Mauléon basin, the ECORS-Arzacq profile imaged a series of north-dipping reflections at 14 to 18 s two-way time, which is identified as the Iberian Moho (Daignières et al., 1994). This dipping reflection Moho is more clearly visible beneath the Mendibelza Massif. From the reflection profile, we can see that a set of shallow reflections at 0 to 4 s TWT towards the north of the Mendibelza Massif put some constraints on the geometry of the North Pyrenean thrust belt and the Aquitanian foreland basin. Daignières et al. (1994) identified this TWT of 4 to 4.5 s (indicating the depths from 9 to 10 km) as the top of the Jurassic basement beneath the Arzacq basin. From the Arzacq
basin southward, these reflectors showing the top of basement shallow gradually. In addition to the north-dipping Iberian Moho, the European Moho is identified by a series of relatively flat reflections at an approximately constant two-way time of 9 to 10 s (corresponding to a depth of about 28 to 30 km ) along the entire profile. The European Moho that is identified towards the southern end of the profile shows the implication of a duplication of the lower crust, along with the north-dipping Iberian Moho underthrusting the European plate. Based on the observations from ECORS-Arzacq reflection profile and other available geophysical data as well as the geometric inferences from the near-surface structures, Teixell (1998) later proposed a model for the deep indentation of the Iberian crust by the European crust which produces a
double wedge beneath the axial zone (Figure1.5b). However, the ECORS-Arzacq profile did not
extend to the south sufficiently to image this possible indentation structure. In order to balance the budget of crustal material, Teixell (1998) estimated that the Iberian lower crust must be underthrusted to a depth of no less than 85 km. The shortening along the ECORS-Arzacq profile is only about 75 to 80 km, less than that of the central Pyrenees.
1.1.3.2 Regional body wave tomography
The regional body wave tomography is a powerful and conceptually simple approach to image the crust and mantle structure. Following the development of the instrumental and increasing number of deployed seismographic stations, the resolution of tomographic images has improved dramatically over the last decades, revealing more details of the lithospheric structures. An earlier tomographic study of the Pyrenees was performed by Souriau and Granet (1995) by analyzing teleseismic P waves records at Pyrenean stations. Their P wave model in the crust showed two high P wave velocity and high density bodies in the central and western parts of the NPZ. The S wave model in the crust and P wave model in the upper mantle were also derived. Similar to the P wave model, the S wave model also detected these high velocity anomalies in the crust. These anomalies were later interpreted as lower crustal material uplifted through the upper crust during the extension period before the collision (Vacher & Souriau, 2001). However, this early tomographic study suffered from the great heterogeneity, insufficient coverage of seismographic stations, a lack of stations in the center and at the western end of the Pyrenees, the fairly small number of records, and the poor quality of phase readings at some old analogue stations.
Owing to the redeployment of permanent digital stations in 1996-97 with a more even dis-tribution on both sides of the Pyrenees, Souriau et al. (2008) conducted a new tomographic study for P wave velocity based on this improvement in ray coverage. In this study, intro-ducing crustal corrections computed in a model derived from previous refraction and reflection experiments removed the strong contamination of the crust down to 100 km depth. Indeed, with crustal corrections, the large low velocity anomaly that was observed down to about 100
km depth in Souriau and Granet (1995), and interpreted as subducted Iberian crust (Souriau & Granet, 1995; Vacher & Souriau, 2001), completely disappeared. However, because of the overall poor quality of the manual phase readings and the very limited north-south aperture of the seismological array, the resolution in the deep parts of the tomographic model is still limited, which led to uncertain results for the deep structures beneath the Pyrenees. Another remarkable result of this study was the absence of any continuous deep high velocity anomaly all along the range, which suggested that the opening of seafloor between Iberia and Eurasia was rather limited if not absent before the collision.
1.1.4 The PYROPE and IBERARRAY experiments
Classical imaging methods are limited by either insufficient coverage (e.g. regional body wave tomography), or by a relatively poor illumination of deep reflectors (e.g. active seismic explo-ration experiment). The temporary PYROPE and IBERARRAY experiments have recently improved the distribution and density of seismological stations in the Pyrenees, providing a new and special opportunity to image the deep structures beneath the Pyrenean orogenic belt with very high resolution.
Following the spirit of the USArray from Earthscope, the IBERARRAY network was de-signed to cover the entire Iberian Peninsula in three successive footprints from south to north, each lasting for about 18 months. It officially started in 2007 with an interstation spacing of approximately 60 km. After the starting of IBERARRAY project, the French seismological community decided to grasp this particular opportunity to deploy a temporary array consisting of broad-band stations in the south of France, and around the Bay of Biscay, that would be synchronized with the launching of the third IBERARRAY deployment (Chevrot et al., 2014). This project, named PYROPE, officially set off in September 2009 and lasted for 4 years. The 2D array of the PYROPE and IBERARRAY experiments comprises 130 broad-band stations, providing dense and uniform coverage over a broad area around the Pyrenees.
In addition, in order to obtain finely resolved images for the deep architecture of the Pyrenees beneath the two ECORS profiles, two dense transects of temporary stations with broad-band seismometers were deployed across the Pyrenees from 2011 to 2013, during the PYROPE exper-iment (Chevrot et al., 2015). The first transect for the central Pyrenees, including 37 stations installed from October 2011 to October 2012, approximately followed strike of the previous ECORS-Pyrenees profile. The second transect for the western Pyrenees, including 29 stations installed from October 2012 to October 2013, followed a line ranging from Pamplona to Mont-de-Marsan. The interstation spacings of each transect are between 4 and 7 km. Both transects have a denser coverage in the axial zone to better constrain the complicated crustal structures there. The western transect is further extended towards the south to cover the region where the deep indentation of the Iberian crust by the European crust may occur. The map of
sta-tions of these two dense transects is shown in Figure1.6. Except for precisely constraining the deep structures of the Pyrenean orogenic belt, the other motivation of the deployment of dense transects along previous ECORS profiles was to compare the potential of passive and active imaging approaches and discuss their complementarity (Chevrot et al., 2014, 2015).
NPF NPF NPFT SPFT −3˚ −3˚ −2˚ −2˚ −1˚ −1˚ 0˚ 0˚ 1˚ 1˚ 2˚ 2˚ 3˚ 3˚ 41˚ 41˚ 42˚ 42˚ 43˚ 43˚ 44˚ 44˚ 45˚ 45˚ Ebro Basin Aquitaine Basin Axial Zone NPZ SPZ Bay of Biscay Mediterranean Sea
Figure 1.6:Map of the seismological stations in the Pyrenees. The temporary stations deployed along the two dense transects (red triangles) were complemented by the temporary IBERARRAY and PYROPE broad-band stations and permanent stations (green circles). The thick darkgreen lines show the strikes of the ECORS-Pyrenees and ECORS-Arzacq profiles.
1.1.5 New results from the data of the PYROPE and IBERARRAY
exper-iments
The first tomographic study exploiting the data of the PYROPE and IBERARRAY experiments imaged the deep structures beneath the Pyrenees (Chevrot et al., 2014). Compared to previous tomographic studies (Souriau & Granet, 1995; Souriau et al., 2008), this study relied on absolute and relative travel time measurements obtained by nonlinear simulated annealing waveform fit (Chevrot, 2002) and on accurate crustal corrections computed in a detailed crustal model
of the Pyrenean region. Figure 1.7 shows the map views and vertical cross-sections of this
lithospheric structures beneath the Pyrenees. Although the P wave velocities of European lithosphere are generally faster than those of Iberian lithosphere at lithospheric depth (125 to 150 km), the limit separating the fast and slow lithospheres does not exactly follow the NPF. This limit is towards the north of the NPF in the western Pyrenees and towards the south in the eastern Pyrenees, showing a NE-SW segmentation of lithospheric structures mainly by two major faults (the Toulouse fault (TF) and the Pamplona fault (PF) drawn with black dashed lines in top right panel of figure1.7). These inherited Hercynian faults are identified as the main segmentation of a rift that affected the formation of the Pyrenees, which would suggest that the E-W left-lateral movement of Iberia relative to Europe before the rifting episode (Jammes et al., 2009).
Figure 1.7:Top panels: Map views of the P velocity tomographic model obtained after crustal corrections at
50 and 125 km depth. Bottom panels: N-S vertical cross-sections along longitudes (left) 1.0◦W and (right)
1.5◦E. The surface strikes of the two cross-sections are shown in top left panel. The color scale is in percents
with respect to the ak135 reference Earth model for all the plots (from Chevrot et al., 2014).
(vertical section A-A’ of figure1.7). This fast anomaly almost disappears below 80 km depth and
spatially coincides with the pronounced Labourd positive Bouguer anomaly shown in figure1.8.
It can also be explained as a shallow isolated block of mantle material (Casas et al., 1997) due to the strong velocity gradients observed in the tomographic model. The more significant fast velocity anomaly is beneath the eastern Pyrenees between 50 and 200 km depth shown in vertical
section B-B’ of figure1.7, which shows a good consistency with the previous tomographic result
(Souriau et al., 2008). This deep fast anomaly may be attributed to a thermal origin located in the deeper European lithospheric mantle. In addition to these prominent velocity anomalies, the absence of a deep evident fast velocity anomaly in the upper mantle and transition zone along the entire Pyrenean domain seems to exclude the presence of a detached oceanic lithosphere beneath the European plate, which precludes the subduction of oceanic lithosphere beneath the Pyrenees during the convergence.
Figure 1.8:Map of Bouguer anomaly (in mGal) in the Pyrenean domain, showing the Labourd (L) and Saint Gaudens (SG) positive anomalies (from Chevrot et al., 2014).
To conclude, the new tomographic model suggested the subduction of a segmented Iberian lithosphere beneath the European plate, further supporting the inference that the formation of the Pyrenees is caused by the tectonic inversion of a segmented rift that was buried by subduction beneath the European Plate. This interpretation indicates that some fragments of the Iberian lithosphere should have subducted beneath the European Plate, which would prefer
the model proposed by Muñoz (1992) for the ECORS-Pyrenees profile and the kinematic model of Jammes et al. (2009).
Thanks to the broader frequency content and larger amplitude of teleseismic waves that can better illuminate lithospheric structures from below, passive teleseismic imaging extracting more information from the waveform data has a greater potential to locate deep seismic interfaces than active source imaging. Chevrot et al. (2015) exploited the teleseismic P waves recorded by the two dense PYROPE transects to obtain a detailed 2D cross-section of seismic interfaces from the migration of P-to-S conversions. Abundant new details of the deep architectures of Iberian and European Moho are revealed in the new images obtained by migrating the radial
receiver functions with a common conversion point (CCP) stacking technique (Figure1.9).
Figure 1.9:Topography (top panels) and Bouguer anomalies (middle panels) along the central (left panels) and western (right panels) transects. Bottom panels: CCP stack section for the two transects. The Moho, which corresponds to a positive downward velocity jump, appears in red while the top of the subducted Iberian crust appears in blue. The Iberian and European Moho are represented as black dashed lines and the top of the subducting Iberian crust as a grey dashed line (from Chevrot et al., 2015).
The migrated sections of both profiles show strong evidence for the Iberian crust subducting down to at least 65 km depth beneath both the central and western Pyrenees. This subduction of the Iberian lithosphere results in reconsidering the amount of convergence between Iberia and Eurasia during the Cenozoic. The images also show that the subducted Iberian crust is much thinner than a typical continental crust, from 15 km in the western Pyrenees to 25 km in the central Pyrenees. The different and more remarkable western crustal thinning suggests that
the Albian extension in the Pyrenean domain was more pronounced to the west. The image for the central profile shows a clearly disconnection between the Iberian and European Moho. This disconnection is related to a strong Moho offset, which approximately corresponds to the position of the North Pyrenean Fault. The image for the western profile also detects a similar Moho offset beneath the NPZ. A ’crocodile’ pattern can be observed at crustal level beneath the western Pyrenees clearly support the interpretation of the ECORS-Arzacq reflection profile proposed by Teixell (1998), which shows the Iberian lower crust plunging into the European mantle down to a depth of 60 km. All these results have significant implications for the present architecture of the Pyrenean lithosphere.
Except for the seismic observations, the Bouguer gravity anomalies also show important
indications of lithospheric structures. The Labourd and Saint Gaudens positive anomalies
observed in the Pyrenees (figure1.8) could be attributed to the presence of dense materials at
shallow depth. For both transects, the variations of Bouguer anomalies show simple patterns that can directly correspond to the structures shown in the migrated sections. In the central Pyrenees, the Bouguer anomalies in South Pyrenean Zone decrease towards the north may reflect the gradually deepening of the Iberian lower crust. Beneath the Axial Zone, the Bouguer anomalies increase to reach a peak value around the NPF, which may be interpreted as uplifted European lower crust or mantle material. For the western transect, the evident Labourd positive anomaly coincides spatially with the crustal structure showing the indentation of the Iberian crust by the European crust. In addition to this, we can observe a 50 km shift between possible deep crustal root and topographic highs which is departure from local (Airy) isostasy. At this point, the further geological interpretations of these observations will require 3D images of density and velocity structures with a much finer resolution than in current images.
1.1.6 Discussion and directions for further improvements
1.1.6.1 The discussion of the model coming from regional body wave tomography
The first tomographic study brought new insights into deep lithospheric structures beneath the Pyrenees, but also revealed the limitations of classical passive imaging approaches.
The crustal model used to compute crustal corrections in the regional tomography was ob-tained from analysis of receiver functions (RF). In general, it is extremely difficult to locate the Moho depth below the stations deployed in sedimentary basin, owing to strong reverberations inside shallow unconsolidated sedimentary layers that masked conversions on deeper seismic interfaces. In addition, constraining the crustal thickness can be also problematic in stations deployed in the axial zone, due to their receiver functions usually showing very complex signa-tures. Except for the considerations mentioned above, the crustal model constructed based on RF had a much coarser resolution in the Pyrenean domain, especially for the mountain ranges where the highest resolution is generally required. The density of PYROPE and IBERARRAY
deployments is still insufficient in the Pyrenees, where crustal structure is rather heterogeneous and can vary significantly over very short distances.
One critical and general conclusion from this regional P wave travel time tomography study is that the lateral resolution at 100 km depth is about 25 km, but the vertical resolution is much poorer due to the effect of vertical smearing in teleseismic tomography. Chevrot et al. (2014) also showed that the vertical resolution is of the order of 80 to 100 km at lithospheric depths, with a quick deterioration at greater depth. Such a resolution is enough to map major structural units, but it is insufficient to provide sharp interfaces and details of lithospheric architecture. One reason for this poor vertical resolution in regional tomography is the subvertical incidence of teleseismic body waves and the fact that the sensitivity of travel time with respect to seismic velocities is broadly distributed around the geometrical ray path. These fundamental limitations of travel time tomography are inevitable, even if finite frequency effects are considered.
1.1.6.2 The comparison between active and passive imaging
Regarding the results of RF migration, the comparison of active and passive internal disconti-nuity imaging is insightful. The advantages of passive imaging technique over active imaging techniques are:
1. Passive imaging brings additional important information that could not be inverted by active imaging, especially for the deep seismic interfaces that are hard to illuminate by using active experiments due to power limitations of man-made seismic sources.
2. Passive imaging approach based on phase conversions other than detection of deep
reflectors in seismic reflection experiment can characterize the sign of the velocity jumps on internal discontinuities, which provides significant guidelines for geological interpretation.
On the other hand, the disadvantages of passive imaging are:
1. Passive approach is difficult to image the structure of upper crust in details, because it is hard to isolate the P-to-S conversions on shallow seismic discontinuities from the direct P wave. By contrast, the higher frequency content of seismic reflection data allows accurate characterization of reflectors at shallow depth, which are usually correlated to well logs data for precisely determining the nature and composition of the main crustal units.
2. The strong reverberations appearing in shallow sedimentary layers, which often mask conversions on deep seismic interfaces, is a fundamental limitation of passive imaging performed in the region including basins. Because the foreland basins usually surround the mountain ranges, this problem often happens in practice. A possible remedy is to exploit S-to-P (Sp) conversions, which arrive earlier than the direct S phase and are not contaminated by such later arriving reverberations (Hansen et al., 2009).
The comparisons show that passive and active imaging technique have both merits and limitations. Sometimes they can complement each other. The ideal situation is that we can
utilize both sources of information, as in the study of the Pyrenees, which offers us a unique opportunity to improve our understanding of the formation of the orogenic belt.
1.1.6.3 The limitations of receiver function migration and directions for further
improvemens
In addition to important results already obtained (Chevrot et al., 2014, 2015), a large part of PYROPE and IBERARRAY data has not been fully explored yet. CCP stack technique suffers from several limitations:
1. The migration is performed in a 1D background model. Neglecting the strong lateral variations of seismic velocities will more or less result in distortions in the recovered depth and geometry of seismic interfaces.
2. An implicit assumption of CCP stacks is that the phase conversions occur on the subhor-izontal discontinuities. Although this algorithm can still detect dipping interfaces, the apparent dip will be biased. Schneider et al. (2013) performed synthetic experiments to test the validity of CCP stack of receiver functions by assuming horizontal and dipping converters for target models with different dipping interfaces. Their results showed that the migrated dipping in-terfaces tends to be shifted to a shallower position when horizontal converters are assumed. The bias between migrated and target inclined interface increases with the dip angle. These artifacts could be reduced by 3D Kirchhoff migration technique (Bostock et al., 2001).
To summarize, migration approach is very efficient in imaging small-scale structural hetero-geneities, such as velocity discontinuities. However, compared to classical travel time tomogra-phy, it can not retrieve the velocity structures. Considering the shortcomings of above imaging approaches and the requirement of 3D high resolution images of density and velocities struc-tures for geologic interpretations, the next stage will be to move from simplified migration and tomographic methods relying on asymptotic descriptions of the wavefield towards full waveform inversion methods exploiting the complete wavefield (Liu & Gu, 2012).
1.2
Towards full waveform inversion of short period teleseismic
body waves
Obtaining 3D tomographic images of the internal structures of orogenic belts with a sufficiently fine resolution to characterize their detailed lithospheric architecture is very challenging. It requires a method that can take full advantage of the information contained in seismic records. The full waveform inversion (FWI) which exploits as much information contained in seismo-grams as is physically reasonable, is a very promising selection. Indeed, It has a theoretical resolution limit of the order of half of the shortest wavelength in the seismic wavefield (Virieux & Operto, 2009), superior to any other traditional tomographic techniques. Therefore, imaging
the lithosphere with a resolution of the order of a few kilometres will require inverting waveform records in the period range 1 to 10 s.
In general, the incident seismic waves excited by either distant or local earthquakes can be used to image lithospheric structure. However, considering the purpose of our study and the size of our target regions, the teleseismic waves originate from distant sources are chosen here mainly by the following reasons. First, the direct primary phase and its coda are well isolated from other primary phases since the temporal spacing between specific phases tends to increases with distance. Second, the ray coverage of teleseismic waves can provide more constraints on the deep structure of the target region. Third, the teleseismic waves are less affected by errors of sources location than incident waves excited by local earthquakes. Finally, if the size of the regional domain is of the order of several hundreds of kilometers, the incident teleseismic waves recorded by regional array have almost the same incidence angles. They are thus insensitive to possible heterogeneities outside the regional domain.
Based on these considerations, we will perform full waveform inversion on short period body waves records excited by distant earthquakes. This is a natural extension of previous studies in the Pyrenees (Chevrot et al., 2014, 2015).
FWI searches for a model that can predict all the wiggles in observed seismograms. It is particularly advantageous because it allows for the direct analysis of strongly interfering signals caused by heterogeneity in the model, without the need to identify complex seismic phases. FWI updates the model in an iterative way that accounts for the non-linear relationship between model parameters and synthetic waveforms. The resolution and precision of the FWI critically rely on the forward modeling technique. A good forward modeling technique is a key ingredient for a successful and efficient FWI. In the following, we review the development of FWI and of forward modeling techniques to identify the methods that are best suitable for our goals.
1.2.1 A review of FWI approaches
In this section, we review the different aspects involved for the implementation of full waveform
inversion. The first part gives an overview of the historical development of full waveform
inversion, including its applications both in the time and frequency domains. In the second part, the computation of sensitivity kernel in heterogeneous model by the beautiful adjoint state method and the recent developments of adjoint tomography are introduced.
1.2.1.1 Historical development of full waveform inversions
Full waveform inversion methods have been introduced in exploration seismology at the begin-ning of the eighties (Tarantola & Valette, 1982; Lailly, 1983; Tarantola, 1984). Early studies focused on 2D acoustic problems. They formulated an inverse problem which consists in search-ing for the best model that minimize the sum of generalized least square differences between
observed seismograms d(xr, t) and synthetic seismograms s(xr, m, t), at the receiver positions
xr. The scattered wavefield is generated by the interaction of the incident wavefield with the
heterogeneous perturbations of the background velocity model. Based on a first order scattering approximation, the gradient of the waveform misfit function with respect to model parameters is computed by correlating the forward propagating wavefield from the actual source with the backward propagating secondary wavefield generated by weighted time-reversed data residuals at the receiver, which represent as fictitious sources in the current model.
Tarantola & Valette (1982) showed that the first iteration of the time domain waveform inversion is equivalent to pre-stack migration techniques based on Claerbout’s imaging princi-ple (Claerbout, 1971). Pre-stack migration can be treated as a partial inversion, but obtains the reflectivity images without visual physical interpretation. In contrast to traditional migra-tion techniques, the nonlinear waveform inversions update the model parameters by successive iterations.
Following this pioneering work by Tarantola, many studies investigated nonlinear waveform inversion approaches in the time domain. Gauthier et al. (1986) carried out the first 2D numer-ical nonlinear waveform inversion in the acoustnumer-ical case. Their test proved that the nonlinear inversion of seismic waveforms is feasible with a steepest descent gradient based inversion al-gorithm, combined with accurate numerical waveform modeling technique. This numerical test also pointed out that if the initial model is far enough from the true model (errors of up to 10%), the gradient based waveform inversion will be trapped inside a secondary minimum.
The acoustic case was later generalized to the elastic (Tarantola, 1986) and anelastic (Taran-tola, 1988) cases. Tarantola indicated that an adequate choice of model parameterization is critical as long period waveforms are mainly sensitive to seismic velocities while short period waveforms are significantly affected by model impedance contrasts in exploration scale prob-lems.
Further numerical synthetic tests of elastic waveform inversion for multi-component reflec-tion data (Mora, 1987) and transmission data (Mora, 1988) showed that surface reflected data (shot gathers) mainly resolve the high frequency content of the model. Adding transmitted VSP data improves the resolution of the low frequency content of the model. Mora also derived a matrix formulation of the inversion problem and suggested that the best preconditioner is the inverse Hessian matrix of the waveform misfit function with respect to model parameters. He also concluded that an iterative elastic waveform inversion algorithm could resolve all the frequency contents of the model parameters when the following two conditions are satisfied: 1) The starting model is close to the true model in the sense that the first order Born ap-proximation holds and 2) the heterogeneities are illuminated from various directions either by transmitted or reflected waves. The waveform inversion can be regarded as a combination of iterative migration and reflection tomography approaches.