• Aucun résultat trouvé

Le niveau de la mer actuel : variations globales et régionales

N/A
N/A
Protected

Academic year: 2021

Partager "Le niveau de la mer actuel : variations globales et régionales"

Copied!
312
0
0

Texte intégral

Loading

Figure

Figure 1.2: number of the tide gauge measurements available since 1807. Brown colour corresponds to  the  mean  sea  level  data  available  from  Northern  Hemisphere  and  blue  colour  corresponds  to  the  limited  number  of  mean  sea  level  data  a
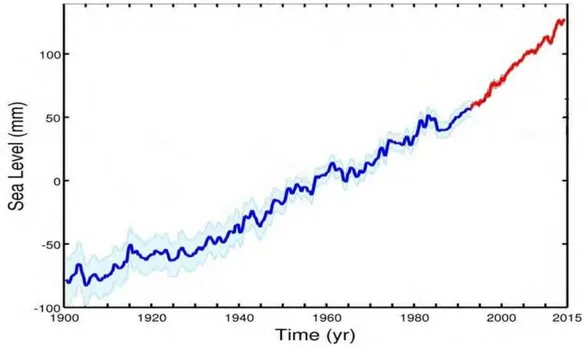
Figure 1.3: 20 th  century sea level curve (in blue) from tide gauge based past sea level reconstruction of  Church  and  White,  2011and  altimetry-based  sea  level  curve  (in  red)  between  1993  and  2015  from  AVISO
Figure 2.2: Evolution of orbital and instrumental errors in satellite altimetry (Source: AVISO-CNES)
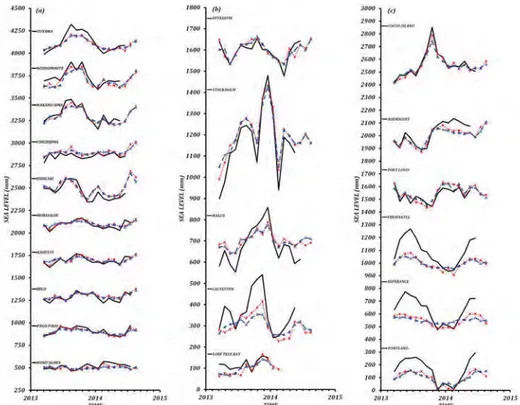
Figure 3. Comparison of sea level time series between tide gauge records (black line), SARAL/AltiKa (red dotted line with stars) and Jason-2 (blue dashed line with triangles) in the (a) Pacific, (b) Atlantic, and (c) Indian and Southern Oceans.
+7

Références

Documents relatifs

Une hypothèse de digestibilité est donc appliquée dans le modèle pour estimer le besoin en calcium total, qui devra être actualisée (de même que le calcul du besoin