THÈSE
Présentée et soutenue par
Qi GAO
Le 30 juillet 2019
Estimation des ressources en eau sur les surfaces continentales par
télédétection micro-onde multi-capteurs
Ecole doctorale : SDU2E - Sciences de l'Univers, de l'Environnement et de
l'Espace
Spécialité : Surfaces et interfaces continentales, Hydrologie
Unité de recherche :
CESBIO - Centre d'Etudes Spatiales de la Biosphère
Thèse dirigée par
Mehrez ZRIBI, Maria José ESCORIHUELA et Pere QUINTANA SEGUI
Jury
Mme Simonetta PALOSCIA, Rapporteure
Mme Catherine OTTLE, Rapporteure
M. Joaquim BELLVERT, Examinateur
M. Mehrez ZRIBI, Directeur de thèse
Contents
ACKNOWLEDGEMENTS v ABSTRACT vii RESUME ix RESUMEN xi RESUM xiii 1 Introduction 1 1.1 Context . . . 11.1.1 Climate change and interaction with water resources . . . 2
1.1.2 Water resources in global scale . . . 4
1.1.3 Water resources in regional scale . . . 5
1.1.4 Water cycle and anthropogenic interventions . . . 6
1.2 Water resources estimation . . . 7
1.2.1 Hydrological models and land surface models . . . 8
1.2.2 Measurements and remote sensing techniques . . . 9
1.2.3 Challenges . . . 9
1.3 About the thesis . . . 10
1.3.1 Objectives . . . 10
1.3.2 Structure of the thesis . . . 11
2 Remote Sensing Principles 15 2.1 Introduction . . . 15
2.1.1 Electromagnetic waves . . . 15
2.1.2 Characteristics of electromagnetic waves . . . 16
2.2 Microwave remote sensing . . . 17
2.2.1 Radar . . . 18
2.2.2 Synthetic Aperture Radar . . . 20
2.2.3 Imaging systems . . . 21
2.2.3.1 Scattering mechanisms . . . 22
2.2.3.2 Topographic effects . . . 23
2.2.3.3 Speckle effect . . . 24
2.2.3.4 Soil moisture principle . . . 24
2.2.4 Ranging system and principle of altimetry . . . 25
2.2.4.1 Trackers and Retrackers . . . 26
2.2.4.2 Pulse-limited altimetry . . . 26 i
2.2.4.3 SAR/Delay-Doppler altimetry . . . 27
2.3 Conclusion . . . 28
3 Study Area and Datasets 29 3.1 Study area . . . 29
3.1.1 Ebro basin . . . 29
3.1.2 Urgell site . . . 31
3.2 Remote sensing dataset . . . 32
3.2.1 Sentinel data . . . 32
3.2.2 MODIS data . . . 37
3.2.3 DEM data . . . 37
3.2.4 SMOS data . . . 37
3.3 In situ data . . . 37
3.3.1 Ground soil moisture measurements . . . 37
3.3.2 Meteorological data . . . 39
3.3.3 SIGPAC . . . 39
3.3.4 SAIH Ebro . . . 40
3.4 Conclusion . . . 40
4 Soil Moisture Retrieval 43 4.1 Introduction . . . 43
4.2 Methodologies . . . 45
4.2.1 Backscatter difference with the driest date . . . 45
4.2.2 Backscatter difference between two consecutive dates . . . 46
4.3 Soil moisture at 1 km resolution . . . 47
4.4 Soil moisture at 100 m resolution . . . 49
4.5 Published paper . . . 49
4.6 Summary and Conclusions . . . 71
5 Irrigation Mapping 73 5.1 Introduction . . . 73
5.2 Methodology . . . 74
5.3 Published paper . . . 75
5.4 Summary and Conclusions . . . 94
6 Water Level Retrieval 95 6.1 Introduction . . . 95
6.2 Methodologies . . . 96
6.3 Published paper . . . 98
6.4 Summary and Conclusions . . . 124
7 Dam Simulation 125 7.1 Introduction . . . 125
7.2 Models . . . 126
7.2.1 SURFEX land surface model . . . 126
7.2.2 SAFRAN meteorological analysis system . . . 126
7.2.3 SASER hydrological model . . . 127
7.3 Methodology . . . 127
7.3.1 Forcing model . . . 127
CONTENTS iii
7.4 Results . . . 128
7.4.1 Simulation . . . 128
7.4.2 Satellite data forcing . . . 132
7.5 Conclusion . . . 133
8 Conclusions and Perspectives 135 8.1 Main conclusions . . . 135
8.2 Future research lines . . . 136
Acronyms 139
List of Figures 143
List of Tables 145
ACKNOWLEDGEMENTS
First of all, I would like to express my sincere gratitude to my supervisors, Maria Jose Escorihuela, Mehrez Zribi and Pere Quintana Segu´ı for their guidance and suggestions throughout all my PhD study. I would specially thank Maria Jose, who offered me an internship opportunity after my master study followed by the PhD opportunity and who offered generous support and encouragement in my study. Also, I especially thank Mehrez, who dedicated a lot of time in guiding my study with invaluable ideas and showed me the way to do scientific research. I would like to thank Pere as well for his support and patience to take me as his first PhD student.
Furthermore, I would like to acknowledge the jury members and the members of my thesis committee, who offered valuable suggestions and help for my PhD study.
I would also like to acknowledge with much appreciation the isardSAT team with whom I have been working with more than three years. I am very thankful for the opportunity isardSAT offered me to be a part of the company and the financial support which makes my PhD study possible. A special thanks to Eduard Makhoul who generously offered his knowledge to help me in the altimetry research. Another special thanks to Merc`e Natividad who saved me from countless administrative processes.
I also thank the CESBIO staff, who offered me a very friendly and helpful working environ-ment during my stay in Toulouse and the Observatori de l’Ebre team and Universitat Ramon Llull team who offered great support during my study, particularly Ana¨ıs Barella, who helped me with the SASER model.
I also sincerely appreciate the funding source I received apart from isardSAT offered, including the grant DI-15-08105 from the Spanish Education Ministry (MICINN), with the support of the Secretariat of Universities and Research of the Business and Knowledge Department of the Government of Catalonia (DI-2016-078), and the grant No. 645642 from European Commission Horizon 2020 Programme for Research and Innovation (H2020) in the context of the Marie Sk lodowska-Curie Research and Innovation Staff Exchange (RISE) action, which gives me the opportunity to experience a very international PhD study.
Again, a great thanks to all my friends both in Europe and in China, who gave me numerous support and encouragement both in life and study.
Last but not least, I would like to take this opportunity to thank my family, for all their support and love, especially my parents, who never said a no to my dreams.
Thank you.
ABSTRACT
The estimation of the water resources of the continental surfaces at a regional and global scale is fundamental for good water resources management. This estimation covers a wide range of topics and fields, including the characterisation of soils and water resources at the basin scale, hydrological modelling and flood prediction and mapping. In this context, the characterisation of the states of the continental surface, to obtain better input parameters for hydrological models, is essential to improve the precision in the simulation of flows, droughts, and floods. The estimation of the water content in the system, including the different water bodies and the free water in the soil, is especially necessary for a precise description of the hydrological processes and, in general, of the water cycle on the continental surfaces. To better characterise hydrological processes, human interventions cannot be neglected. Humans influence the water cycle, mainly through irrigation and the construction of reservoirs, which must be correctly quantified.
The objective of the thesis is the improvement of the remote estimation of water resources, including the quantification of human factors, using several sensors recently launched, taking advantage of recent developments in remote sensing technology. With the arrival of the Sentinel constellations (Sentinel-1, 2, 3), we have better tools to estimate water resources, including human impacts, with greater precision and coverage.
This thesis consists mainly of two parts where human interventions in the water cycle are con-sidered: irrigation cartography (as an application of soil moisture), and the forcing of reservoirs in hydrological simulations (as an application of altimetry).
Firstly, soil moisture is estimated from the statistical analysis of Sentinel-1 SAR data. Two methodologies are developed to obtain soil moisture with a spatial resolution of 100 m based on the interpretation of Sentinel-1 data collected with the VV polarization (vertical-vertical), which is combined with optical data of Sentinel-2 for the analysis of the effects of vegetation.
Secondly, irrigation is mapped under various meteorological conditions, including high spatial and temporal resolution. A methodology for irrigation mapping is proposed using SAR data obtained in VV (vertical-vertical) and VH (vertical-horizontal) polarizations. With Sentinel-1 time series, different statistics and metrics are analysed, including the mean value, the variance of the signal, the correlation length and the fractal dimension, based on which the classification of irrigated trees, irrigated crops, and non-irrigated crops are derived.
Finally, the level of the reservoirs is estimated from the Sentinel-3 altimetry data, with the SAR altimeter (SRAL), based on different algorithms to improve the accuracy. This study presents three specialised algorithms or retrackers designed to obtain the level of the surface of the studied inland bodies of water, minimising the contamination of the waveforms due to the surrounding soil. The performance of the selection method of the proposed wave portion is compared with three retrackers, that is, the centre of gravity retracker (OCOG) and the two-step physical-based retracker. Temporal series of the water level of reservoirs located in the basin of the Ebro River (Spain) are obtained.
As an application, the level series of the reservoirs obtained are used to force the reservoirs in hydrological simulations.
Keywords: Water resources, remote sensing, synthetic aperture radar (SAR), soil moisture, altimetry, Sentinel
RESUME
L’estimation et le suivi des ressources en eau des surfaces continentales aux niveaux r´egional et global est essentielle pour la gestion du bilan hydrique, particuli`erement dans le contexte des changements climatiques et anthropiques. Ils couvrent un large ´eventail de th`emes et de domaines, incluant la caract´erisation des ressources en eau `a l’´echelle du bassin, la mod´elisa-tion hydrologique ainsi que la pr´evision et la cartographie des inondamod´elisa-tions. Dans ce contexte, la caract´erisation des ´etats de surface, en tant que param`etres d’entr´ee dans les mod`eles hy-drologiques, est essentielle pour obtenir une meilleure pr´ecision de la simulation, qui est li´ee `a la pr´ecision pr´evisionnelle des d´ebits des cours d’eau et le suivi des s´echeresses et des inondations. L’estimation de la teneur en eau des surfaces continentales, incluant l’´etat hydrique du sol et les niveaux des surfaces couvertes d’eau, est particuli`erement n´ecessaire pour une description pr´ecise des processus hydrologiques et plus g´en´eralement du cycle de l’eau sur les surfaces continentales. Afin de mieux comprendre les processus hydrologiques, l’influence humaine (l’effet anthropique) sur le cycle de l’eau n´ecessite une ´evaluation fine. Elle est particuli`erement li´ee `a la gestion de l’irrigation et la construction de barrages.
L’objectif de la th`ese ´etait d’am´eliorer l’estimation des ressources en eau et une meilleure caract´erisation des interventions anthropiques `a travers l’utilisation de nouveaux capteurs satel-litaires multi-configurations du programme europ´een Copernicus. Avec le d´eveloppement de la technologie de t´el´ed´etection spatiale, et plus particuli`erement avec l’arriv´ee des constellations Sentinel (Sentinel-1, 2, 3) `a haute r´esolution spatiale et temporelle, il existe un meilleur outil pour estimer les ´etats des surfaces continentales. Ce travail de th`ese comprend principalement deux priorit´es li´ees `a des interventions humaines dans le cycle hydrologique:la cartographie de l’irrigation en tant que action humaine li´ee directement `a l’humidit´e du sol et le for¸cage des barrages dans un mod`ele de simulation de rivi`ere en tant qu’application li´ee `a l’estimation du niveau de l’eau libre.
Un premier axe de recherche a ´et´e bas´e sur une analyse statistique des donn´ees SAR Sentinel-1 pour caract´eriser l’´etat hydrique du sol. Deux m´ethodes ont ´et´e d´evelopp´ees pour estimer ce param`etre avec une r´esolution spatiale de 100 m. Elles sont bas´ees sur des approches de d´etection de changement `a partir des donn´ees Sentinel-1 acquises en polarisation VV (verticale-verticale), combin´ees aux donn´ees optiques Sentinel-2 pour corriger les effets de la v´eg´etation.
L’application consistait `a cartographier l’irrigation, avec des r´esolutions spatiale et temporelle ´elev´ees. Une m´ethodologie de cartographie de l’irrigation utilisant des donn´ees SAR Sentinel-1 a ´et´e propos´ee. Elle estbas´ee sur les acquisitions en polarisations VV (vertical-vertical) et VH (vertical-horizontal). A partir de la s´erie temporelle des mesures Sentinel-1, des param`etres statistiques tel que la valeur moyenne, la variance du signal, la longueur de corr´elation temporelle et la dimension fractale, sont analys´ees, en fonction du type de culture; cultures annuelles ir-rigu´ees, arbres irrigu´es et cultures pluviales. Des classifications supervis´ees utilisant les approches Random Forest et SVM sont test´ees.
En deuxi`eme axe, l’estimation de la hauteur de la surface de l’eau `a partir des donn´ees altim´etriques de Sentinel-3 avec l’altim`etre SAR (SRAL) a ´et´e r´ealis´ee `a l’aide de diff´erents
algorithmes afin d’am´eliorer la pr´ecision sur des petites surfaces. Cette ´etude pr´esente trois algorithmes sp´ecialis´es (ou retrackers) d´edi´ees `a la minimisation de la contamination des sols par les formes d’ondes permettant de r´ecup´erer les niveaux d’eau `a partir de donn´ees altim´etriques SAR sur des masses d’eaux int´erieures. Les performances de la m´ethode de s´election de portion de forme d’onde propos´ee avec trois retrackers, `a savoir, le retracker `a seuil, le retracker `a centre de gravit´e d´ecal´e (OCOG) et le retracker `a base physique `a 2 ´etapes, sont compar´ees. Des s´eries chronologiques de niveaux d’eau sont extraites pour les masses d’eau du bassin de l’`Ebre (Espagne).
Une application des produits altim´etriques est propos´ee. Le produit de niveau d’eau a ´et´e utilis´e comme param`etre d’entr´ee pour analyser l’effet tampon des barrages dans les simulations de d´ebits fluviaux.
Mots-cl´es: ressources en eau, t´el´ed´etection, Radar d’ouverture synth´etique (SAR), humidit´e du sol, hauteur de surface d’eau, altim´etrie, Sentinel
RESUMEN
La estimaci´on de los recursos h´ıdricos de las superficies continentales a escala regional y global es fundamental para una buena gesti´on de los recursos h´ıdricos. Esta estimaci´on cubre una amplia gama de temas y campos, incluyendo la caracterizaci´on de los suelos y de los recursos h´ıdricos a escala de cuenca, la modelizaci´on hidrol´ogica y la predicci´on y la cartograf´ıa de inundaciones. En este contexto, la caracterizaci´on de los estados de la superficie continental, para obtener mejores par´ametros de entrada para los modelos hidrol´ogicos, es esencial para mejorar la precisi´on en la simulaci´on de caudales, sequ´ıas e inundaciones. La estimaci´on del contenido de agua en el sistema, incluidas las diferentes masas de agua y el agua libre en el suelo, es especialmente necesaria para una descripci´on precisa de los procesos hidrol´ogicos y, en general, del ciclo del agua en las superficies continentales. Una caracterizaci´on precisa de los procesos hidrol´ogicos requiere no descuidar las intervenciones humanas. El hombre influye en el ciclo del agua, principalmente mediante el riego y la construcci´on de embalses, lo que se debe cuantificar correctamente.
El objetivo de la tesis es la mejora de la estimaci´on remota de los recursos h´ıdricos, incluyendo la cuantificaci´on de los factores humanos, mediante el uso de varios sensores lanzados reciente-mente, aprovechando recientes desarrollos en la tecnolog´ıa de teledetecci´on. Con la llegada de las constelaciones Sentinel (Sentinel-1, 2, 3), disponemos de mejores herramientas para estimar los recursos h´ıdricos, incluyendo los impactos humanos, con una mayor precisi´on y cobertura.
Este trabajo de tesis consta principalmente en dos ejes de investigaci´on donde se estiman las intervenciones humanas en el ciclo hidrol´ogico: la cartograf´ıa del riego (como aplicaci´on en humedad del suelo), y el forzamiento de embalses en simulaciones hidrol´ogicas (como aplicaci´on de la altimetr´ıa).
En relaci´on al primer eje, se estima la humedad del suelo a partir del an´alisis estad´ıstico de los datos SAR de Sentinel-1. Se desarrollan dos metodolog´ıas para obtener la humedad del suelo con una resoluci´on espacial de 100 m bas´andose en la interpretaci´on de los datos de Sentinel-1 obtenidas con la polarizaci´on VV (vertical-vertical), que se combina con datos ´opticas Sentinel-2 para el an´alisis de los efectos de la vegetaci´on.
Como aplicaci´on de la humedad del suelo, se cartograf´ıa el riego en diversas condiciones meteorol´ogicas, y con una alta resoluci´on espacial y temporal. Se propone una metodolog´ıa para la cartograf´ıa del riego mediante datos SAR obtenidos en polarizaciones VV (vertical-vertical) y VH (vertical-horizontal). A partir de la serie temporal Sentinel-1, se analizan diferentes estad´ısticas y m´etricas, incluyendo el valor medio, la varianza de la se˜nal, la longitud de la correlaci´on y la dimensi´on fractal, a partir de los cuales se clasifican los ´arboles irrigados, los cultivos irrigados y los cultivos no irrigados.
En el segundo eje, se estima el nivel de los embalses a partir de los datos de altimetr´ıa de Sentinel-3, con el alt´ımetro SAR (SRAL), bas´andose en diferentes algoritmos para mejorar la precisi´on. Este estudio presenta tres algoritmos especializados o retrackers destinados a obtener el nivel de la superficie de los cuerpos de agua estudiados, minimizando la contaminaci´on de las formas de onda debido al suelo que los rodea. Se compara el rendimiento del m´etodo propuesto de selecci´on de la porci´on de onda con tres retrackers, es decir, un retracker de umbral, el retracker
del centro de gravedad (OCOG) y un retracker de base f´ısica de dos pasos. Se obtienen series temporales del nivel de la l´amina de agua de embalses situados en la cuenca del r´ıo Ebro (Espa˜na). Como aplicaci´on, las series de nivel de los embalses obtenidas se utilizan para forzar los em-balses en simulaciones hidrol´ogicas.
Palabras clave: Recursos h´ıdricos, teledetecci´on, radar de apertura sint´etica (SAR), humedad del suelo, altimetr´ıa
RESUM
L’estimaci´o dels recursos h´ıdrics de les superf´ıcies continentals a escala regional i global ´es fonamental per a una bona gesti´o dels recursos h´ıdrics. Aquesta estimaci´o cobreix una `am-plia gamma de temes i camps, incloent-hi la caracteritzaci´o dels s`ols i dels recursos h´ıdrics a l’escala de la conca, la modelitzaci´o hidrol`ogica i la predicci´o i la cartografia d’inundacions. En aquest context, la caracteritzaci´o dels estats de la superf´ıcie continental, per a obtenir millors par`ametres d’entrada als models hidrol`ogics, ´es essencial per millorar la precisi´o en la simulaci´o de cabals, sequeres i inundacions. L’estimaci´o del contingut d’aigua en el sistema, incloses les diferents masses d’aigua i l’aigua lliure en el s`ol, ´es especialment necess`aria per a una descripci´o precisa dels processos hidrol`ogics i, en general, del cicle de l’aigua a les superf´ıcies continentals. Per caracteritzar millor els processos hidrol`ogics, les intervencions antropog`eniques no es poden negligir. L’home influeix en el cicle de l’aigua, principalment mitjan¸cant el reg i la construcci´o de preses, fet que s’ha de quantificar correctament.
L’objectiu de la tesi ´es la millora de l’estimaci´o remota dels recursos h´ıdrics, incloent-hi la quantificaci´o dels factors antr`opics, mitjan¸cant l’´us de diversos sensors llan¸cats recentment, aprofitant recents desenvolupaments en la tecnologia de teledetecci´o. Amb l’arribada de les constel·lacions Sentinel (Sentinel-1, 2, 3), disposem de millors eines per estimar els recursos h´ıdrics, incloent-hi els impactes humans, amb una major precisi´o i cobertura.
Aquest treball de tesi consta principalment de dues l´ınies de recerca on s’estimen les interven-cions humanes en el cicle hidrol`ogic: la cartografia del reg (com a aplicaci´o en humitat del s`ol), i el for¸cament d’embassaments en simulacions hidrol`ogiques (com a aplicaci´o de l’altimetria).
En la primera linia s’estima la humitat del s`ol a partir de l’an`alisi estad´ıstica de les dades SAR de Sentinel-1. Es desenvolupen dues metodologies per obtenir la humitat del s`ol amb una resoluci´o espacial de 100 m basant-se en la interpretaci´o de les dades de Sentinel-1 obtingudes amb la polaritzaci´o VV (vertical-vertical), que es combina amb dades `optiques Sentinel-2 per a l’an`alisi dels efectes de la vegetaci´o.
Com aplicaci´o de la humitat del s`ol, es cartografia el reg en diverses condicions meteo-rol`ogiques, i amb una alta resoluci´o espacial i temporal. Es proposa una metodologia per a la cartografia del reg mitjan¸cant dades SAR obtingudes en polaritzacions VV (vertical-vertical) i VH (vertical-horitzontal). A partir de la s`erie temporal Sentinel-1, s’analitzen diferents estad´ıs-tiques i m`etriques, incloent-hi el valor mitj`a, la vari`ancia del senyal, la longitud de la correlaci´o i la dimensi´o fractal, a partir dels quals es classifiquen els arbres irrigats, els cultius irrigats i els cultius no irrigats.
En la segona l´ınia, s’estima el nivell dels embassaments a partir de les dades d’altimetria de Sentinel-3, amb l’alt´ımetre SAR (SRAL), basant-se en diferents algorismes per millorar la precisi´o. Aquest estudi presenta tres algorismes especialitzats o retrackers destinats a obtenir el nivell de la superf´ıcie dels cossos d’aigua estudiats, minimitzant la contaminaci´o de les formes d’ona degut al s`ol que els envolta. Es compara el rendiment del m`etode proposat de selecci´o de la porci´o d’ona amb tres retrackers, ´es a dir, un retracker de llindar, el retracker del centre de gravetat (OCOG) i un retracker de base f´ısica de dos passos. S’obtenen s`eries temporals del
nivell de la l`amina d’aigua d’embassaments situats a la conca del riu Ebre (Espanya).
Com aplicaci´o, les s`eries de nivell dels embassaments obtingudes s’utilitzen per a for¸car els embassaments en simulacions hidrol`ogiques.
Paraules clau: Recursos h´ıdrics, teledetecci´o, radar d’obertura sint`etica (SAR), humitat del s`ol, altimetria
Chapter 1
Introduction
Contents
1.1 Context . . . 1
1.1.1 Climate change and interaction with water resources . . . 2
1.1.2 Water resources in global scale . . . 4
1.1.3 Water resources in regional scale . . . 5
1.1.4 Water cycle and anthropogenic interventions . . . 6
1.2 Water resources estimation . . . 7
1.2.1 Hydrological models and land surface models . . . 8
1.2.2 Measurements and remote sensing techniques . . . 9
1.2.3 Challenges . . . 9
1.3 About the thesis . . . 10
1.3.1 Objectives . . . 10
1.3.2 Structure of the thesis . . . 11
1.1
Context
Water is one of the most common substances on Earth (Thompson et al., 2010). It exists in the oceans, on the surface, below the ground, and in the atmosphere. Water resources are defined as “Water available or capable of being made available for use, in sufficient quantity and adequate quality” (WMO, 2012). Therefore, water resources normally refer to freshwater that mostly exists in rivers, lakes, surfaces, and underground.
Although water needs are generally associated with access to drinking water for the popu-lation, it is also essential for many industrial and agricultural sectors. Agriculture, which uses water for crop irrigation, accounts for 3/4 of the world’s current demand (Postel , 1992; Shik-lomanov, 2000; Cai and Rosegrant, 2002; Wisser et al., 2008; Sauer et al., 2010; Siebert et al., 2005). This high demand for water is due to the expansion and intensification of agriculture to cope with the increase in the world’s population and thus the need for food. Food and Agricul-ture Organization (FAO) of the United Nations estimated that the global demand for food, feed and fibre will grow by 70 percent in the first half of this century (FAO, 2009). In addition to this growing demand, climate change, which is already being felt in different parts of the world, is impacting water resources (V¨or¨osmarty et al., 2000).
1.1.1 Climate change and interaction with water resources
Climate change, as a scientific consensus, is undergoing and is primarily due to human activi-ties (Cook et al., 2013). The Earth is globally warmer by 0.85◦C on average since the beginning of the industrial era, according to the 5th report of the Intergovernmental Panel on Climate Change (IPCC) (Pachauri and Meyer , 2014). Also, the global surface temperature is projected to rise by the end of the 21st century (2081–2100) to about 0.3◦C to 1.7◦C under RCP2.6 (Representative Concentration Pathway with radiative forcing of 2.6 W/m2) and 2.6◦C to 4.8◦C under RCP8.5,
with reference to 1986–2005 as shown in Figure 1.1 (a) (Pachauri and Meyer , 2014). It is very likely that heat waves will occur more often and last longer, and extreme precipitation events, as well as drought events, will become more intense and frequent in many regions (Easterling et al., 2000). The high latitudes and the equatorial Pacific are likely to experience an increase in annual mean precipitation, while many mid-latitude and dry subtropical regions will likely suffer from drought as shown in Figure 1.1 (b) (Pachauri and Meyer , 2014).
Figure 1.1: Change in average surface temperature (a) and change in average precipitation (b) based on multi-model mean projections for 2081–2100 relative to 1986–2005 under the RCP2.6 (left) and RCP8.5 (right) scenarios. RCP is short for Representative Concentration Pathway, which is a greenhouse gas concentration (not emissions) trajectory adopted by the IPCC for its fifth Assessment Report in 2014 (Pachauri and Meyer , 2014).
The impact of climate change is still uncertain in many areas of the world. To have knowledge of the climate change impact over different regions, a Regional Climate Change Index (RCCI) is developed based on regional mean precipitation change, mean surface air temperature change
1.1. CONTEXT 3
Figure 1.2: Regional Climate Change Index (RCCI) over 26 land regions of the world calculated from 20 coupled Atmospheric-Ocean General Circulation Models and 3 IPCC emission scenarios (A1B, A2, B1) (Giorgi , 2006; PAGES , 2018).
and change in precipitation and temperature interannual variability by Giorgi (2006). The RCCI identifies the most responsive regions to climate change or Hot-Spots. As shown in Figure 1.2, the Mediterranean and North Eastern European regions emerge as the primary Hot-Spots, followed by high latitude northern hemisphere regions and by Central America (Giorgi , 2006).
Global warming will lead to increased evaporation, leading to an intensification (or accel-eration) of the water cycle. The intensification of the global water cycle could affect water availability and may increase the frequency and intensity of tropical storms, floods, and droughts (Huntington, 2006). In humid climates, increased evaporation will likely result in more precip-itations and increase the risk of flooding. Over arid areas, increased evaporation will reduce water availability, prolong dry periods and aggravate droughts. In some regions, mean annual precipitation will increase, but the number of events will be reduced, which could lead to longer dry seasons and a higher risk of floods.
Furthermore, the increase evapotranspiration (ET) will decrease the effective precipitation in many areas of the world even with the precipitation increases, affecting water resources and agri-culture. In a regional perspective of view, the uncertainty of the regional climate, the diversity of the hydrology, and the human activities could all affect the regional water resources. Climate change is projected to reduce renewable surface water and groundwater resources in most dry semitropical regions (Pachauri and Meyer , 2014). Extreme challenges for the sustainable man-agement of water resources exist at all levels from the local to the global scale (Trenberth and Asrar, 2014). Therefore, the water resources context and problems need to be known both in the global and regional scale.
1.1.2 Water resources in global scale
Freshwater is a renewable resource, yet large regions of the world faces the problem of water scarcity with its patterns varying in time and space. From the perspective of the entire water cycle, water resources are significantly affected by global climate change and human activities. Climate change or global warming increases the uncertainty associated with the future avail-ability and variavail-ability of freshwater resources, and may even lead to permanent desertification of certain regions of the world (UNESCO, 2011). Extreme weather happens more often than before including droughts and floods, bringing more challenges in water resources management. More than two billion people are affected by water scarcity worldwide (Oki and Kanae, 2006), and a total of 2.7 billion have water scarcity for at least one month of the year (Hoekstra et al., 2012). In less than 25 years, two-thirds of the world’s population will be living in water-stressed countries (UNESCO, 2011).
Water scarcity is exacerbating in many parts of the world due to climate change. In the meanwhile, the demand for water resources is increasing due to population growth and economic development.
Population density and per-capita resource use have increased dramatically over the past few decades. The United Nations predictions estimate that the world population will reach 9 billion people in 2050. This exponential growth in population – a major driver of energy consumption and anthropogenic climate change – is also the key driver behind the hydrologic change and its impacts (UNESCO, 2011).
Urbanisation with a large number of people moving from the countryside to cities aggravates the impact of population growth. More than half of the world’s population currently lives in cities, and this number will reach 70 percent by 2050 (UNESCO, 2011). With the increase of the population density in cities, the water demand is significantly increasing making water stress more severe for cities.
The demand for agricultural products from the food we eat, to the cotton we wear, is increas-ing with the rapid population growth. More than 40% of global food and agricultural commodity output (Shiklomanov , 1996; WMO, 1997; V¨or¨osmarty and Sahagian, 2000) depends on irrigation, which requires a large amount of water. Up to 70% of water is currently withdrawn for agri-cultural use (Hamdy et al., 2003; Wolfe et al., 2004), yet both irrigated and rainfed agriculture are exposed to water risk. Intensification of agriculture is presently contributing to deforestation and desertification, which in turn reduces the holding water capacity of the soil and increases the water scarcity (Johnson, 2016; Keys and McConnell , 2005).
As the global population continues to increase, authorities are finding ways to secure water supplies through dam construction and water transfer. The number of dams and water transfer systems has risen dramatically in the last century to deal with the uneven distribution of water in space and season. According to Lehner et al., 2011 (Lehner et al., 2011), there are approximately 40 000 registered large dams in the world, with most of them being used for irrigation, followed by the use for hydropower, water supply, and flood control.
Arid and semi-arid areas are facing the most significant challenges of water stress, while many densely populated parts of the humid tropics and temperate zones are also affected by water stress. Water stress is transcending national boundaries and is increasingly leading to competition for water at local, regional, and international levels.
On the other hand, floods which occur periodically in many parts of the world put a significant threat to crops, settlements, infrastructure, and most importantly life. From 1980 to 2009, floods caused more than 500 000 deaths and affected more than 2.8 billion people worldwide. (Doocy et al., 2013). It is essential to monitor and manage the water resources in order to provide early-warning alerts for flood predictions.
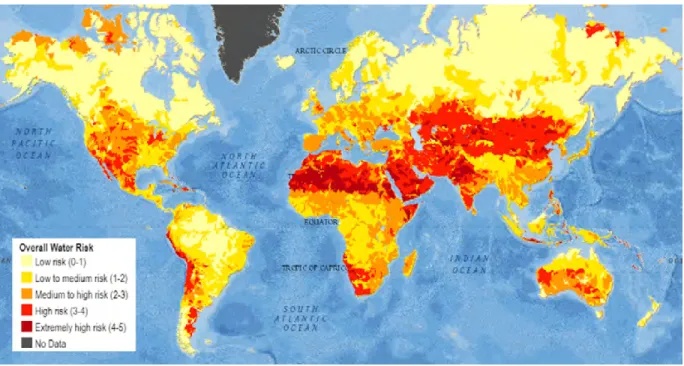
1.1. CONTEXT 5 Water risk, which comes both from the water stress and the risk of flooding, is a global issue as shown in Figure 1.3 (Gassert et al., 2015). The impacts of floods and droughts in many areas will have to be managed more frequently than before, and few areas of the world are not affected (Kundzewicz et al., 2002; Sadoff and Muller , 2015). As problems related to water spatio-temporal variability manifest themselves at smaller scales, a significant challenge in freshwater assessments is how to handle this on different geographical scales (Sophocleous, 2004a). Water resources in regional scale are the priority concern for local government to make policy decisions and for scientists to learn the mechanism of the water cycle.
Figure 1.3: The global map of water risk index considering both water stress and flood risk (Gassert et al., 2015).
1.1.3 Water resources in regional scale
At the regional scale, water resources are often considered within a river basin, within which the water budget can be closed (groundwater permitting). Humans directly change the dynamics of the water cycle through dams that are constructed for water storage or hydropower, and through water withdrawals for industrial, agricultural, or domestic purposes (Haddeland et al., 2014). Everything we do affects the river basin, while in reverse, water resources in the river basin affect humans by determining the food yield, the diversity of animal species, the speed of economic growth, and the number of people and livestock that can be sustainably supported. Among all the human activities, agriculture is the dominant component of human water use. Hence, many of the solutions to water-related food and environmental security problems come from the increasing of the efficiency of water use for the productivity of agriculture (Sophocleous, 2004b).
River basins in arid and semi-arid areas face a more significant threat to water shortage and a bigger challenge of water resources management when encountering the need to support a large amount of population. In a semi-arid environment, the water cycle has particular characteris-tics. Precipitation and many planetary boundary layer processes are affected by soil moisture variability and, precisely in these areas, soil moisture is very variable in space and time, making
the areas very vulnerable to climate change with consequences that may have serious social and environmental effects (UNESCO, 2011). The water resources in semi-arid regions, with their vulnerability to climate change, need to be analysed, and the impact of climate change needs to be assessed.
The Mediterranean, as mentioned before, is one of the primary Hot-Spots of climate change. The precipitation is predicted to decrease as shown in Figure 1.1 (b), and droughts will occur more frequently. The Mediterranean region is often cited as an example of the extreme tension on water resources: 180 million inhabitants have less than 1000 m3/year per capita of renewable water resources (425 in Tunisia and 750 in Morocco), and 80 million will have less than 500 m3/year in 2025 (UNEP/MAP , 2009; EASAC , 2010). In most Mediterranean countries, overexploitation of water resources is already observed, and this situation is bound to deteriorate further. The water management is then, with its corollary of food security, the critical issue of the Mediterranean in the 21st century.
1.1.4 Water cycle and anthropogenic interventions
Water is not a stationary substance on Earth. It is moving all the time. To study the water resources, which form water cycle, their movements need to be known first. The water cycle is the movement of water between the oceans, the atmosphere, the surface, and the fresh water. It consists of several processes including precipitation, evaporation, transpiration, infiltration, and runoff, as shown in Figure 1.4 (Green, 2000).
Figure 1.4: Processes and pathways of the water cycle (The Drainage Basin Hydrological Cycle, 2018).
Humans influence the water cycle mainly by influencing evapotranspiration (evaporation + transpiration) through irrigation for agriculture or land use change and runoff through damming for water storage, hydro powers or flood control. The other processes are subsequently influ-enced. Anthropogenic influences have affected the global water cycle since the beginning of
1.2. WATER RESOURCES ESTIMATION 7 agriculture, and the impact has increased dramatically since the 1960s, as dams were built ex-tensively (Pachauri and Meyer , 2014).
With the construction of dams, reservoirs are usually formed from the water accumulating above them. Proper management of dams is of great importance since it relates not only to food production but also to floods, droughts, and energy. Moreover, the severe mismanaging of the dams may cause droughts in the downstream of the river or increase the risk of catastrophic floods. Several studies (Li et al., 2016; Haddeland et al., 2014; Gao et al., 2013; Guo et al., 2012) found that the construction of dams reduces river flows and changes the stream flow seasonally, which influences the water cycle significantly. The impacts of reservoirs are most profound in Asia, Europe, and Africa, where in some months the total flux of fresh water into the ocean is 10% less compared to a naturalised situation (Biemans et al., 2011). Therefore, in addition to the satisfaction of the irrigation or energy purpose, the impact and role of dams in the water cycle need to be accounted for.
Equally important as dam construction, but still related to the dams, irrigation is another an-thropogenic intervention of the water cycle. To fulfil the increasing global food demand, irrigation is increasing, making more contributions to evaporation as an important step in the water cycle. Irrigation creates an anthropogenic change of the soil moisture, and can ultimately influence the planetary boundary layer, local circulation, clouds and precipitation through evaporation from soil and transpiration from thriving vegetation. Several studies (Tuinenburg et al., 2014; Puma and Cook, 2010; Lee et al., 2011; Douglas et al., 2009) found that irrigation increased evaporation both regionally and globally, and decreased temperature in the local area. Lo et al. (Lo and Famiglietti , 2013) identified that irrigation in the Central Valley (California, United States) increased summer precipitation by 15%, causing correspondingly the increase in Colorado River stream flow of about 30%. Boucher et al., 2004 (Boucher et al., 2004) estimated a global mean radiative forcing in the range of 0.03 to +0.1 W/m2 due to the increase in water vapour
from irrigation, and a massive surface cooling of up to 0.8 K over irrigated land areas. Climate change with rising temperature globally increases atmospheric evaporation demand, and also, evaporation caused by irrigation influences the climate. The water cycle involves the exchange of energy, which leads to temperature changes. The heat exchanges from water evaporation and condensation influence climate and the impact need to be studied and involved in the water cycle process. Also, as the primary purpose of reservoirs, irrigation has been found to decrease the river discharge to the oceans both on a continental and global scale (Gerten et al., 2008; Biemans et al., 2011).
Land use changes also influence the water cycle by changing the evapotranspiration. Land use changes may have many situations including agriculture to buildings, agriculture type changes, etc. With the complexity, it is difficult to quantify the influences of land use change, and thus, out of the scope of this thesis.
1.2
Water resources estimation
To deal with droughts, water shortages, and scarcity in many areas of the world, effective water management is needed to provide some of society’s most basic needs from agricultural crops to electricity. Monitoring the state of water resources and their change over time is integral to the development of effective strategies for sustainable water resources management. Water shortage or flood events forecast is essential for minimising the effects of disasters and planning the water allocation for irrigation and industrial usage, yet the forecast depends on the knowledge of the current status of the water resources and the historical changing patterns.
lakes and rivers is the most in need of monitoring and management since it is often the direct source of irrigation, hydropower and flood. The reservoirs and lakes work as a buffer to the river flow and storage to water which can be further used for irrigation. Soil moisture is also a valuable water resource for agriculture, especially for rainfed fields. It is the direct water sources for the crops and decides the amount of water needed for irrigation.
1.2.1 Hydrological models and land surface models
In response to water-related challenges, many hydrological models have been developed to analyse, understand, and explore solutions for sustainable water management in the basin scale, to support decision makers and operational water managers. Hydrological models are mainly used for understanding hydrological processes, estimating the water resources, and predicting system behaviour. They have evolved from empirical rainfall-runoff models (Mulvany, 1851; Sherman, 1932; Horton, 1935) to conceptual models (Linsley and Crawford , 1960; Crawford and Linsley, 1966; Dawdy and O’Donnell , 1965; Sugawara, 1969; Burnash et al., 1973; Burnash, 1995; Arnold et al., 1998; Ma and Cheng, 1998), and to physically based models (Abbott et al., 1986a,b; Beven and Kirkby, 1976, 1979; Beven et al., 1987; Grayson et al., 1992; Fortin et al., 2001a,b; Qu, 2004; Qu and Duffy, 2007; Kumar , 2009; Shi et al., 2013; Todini , 2007). The recent physical models use parameters to characterise the unique aspects of the system being studied (Nepal et al., 2017). However, the parameters may differ in different catchments due to physical and hydrological differences (Bl¨oschl and Zehe, 2005).
In addition to hydrological models, Land Surface Models (LSMs) are equally important to learn the regional land surface status with more complexity since it is physical with the simulation of the energy balance. The LSMs are the components of Global Climate Models (GCMs) that simulate land surface processes, such as the absorption and partitioning of radiation, moisture, and carbon (Abramowitz et al., 2008). The LSMs model the surface energy balance, surface water balance and carbon balance. They are typically provided with meteorological conditions as inputs (from a boundary layer atmospheric model or reanalysis data) and produce outputs that include the surface runoff, latent and sensible heat fluxes, CO2 fluxes, deep soil drainage, soil moisture, etc. LSMs are essential to assess the impact of climate change.
A model is a simplified representation of real-world system (Sharma et al., 2008), with the best one giving results close to reality with the use of least parameters and model complexity (Devia et al., 2015). However, most of the current models do not incorporate (or very little) human intervention in the water cycle, bringing more uncertainties into the assessment, analysis and forecasting. The uncertainties are even more significant in semi-arid areas since models are not accurately developed, and the impact of irrigation and reservoir operation may be amplified (Zhou et al., 2016).
Incorporating anthropogenic intervention in the models helps to understand the hydrological processes and the climate change better, yet long-term and consistent records that focus on water management and human interventions on the water cycle are not widely available (Zhou et al., 2016). The modelling requires better accuracy, both in time and spatial scale, for which researchers are still working on.
To solve water-related challenges and to assess the impact of climate change, better char-acterised hydrological models and LSMs are needed. For that, the anthropogenic intervention needs to be introduced in the water cycle and models. Involving anthropogenic intervention in the water cycle needs to be done by introducing the irrigation status and the water availability in rivers and reservoirs considering the effects of dams.
LSMs can benefit from reliable soil moisture data for model validation and data assimila-tion. Soil moisture, which is directly linked with evaporation and decides the irrigation strategy,
1.2. WATER RESOURCES ESTIMATION 9 needs be to mapped with better efficiency to obtain a higher spatial and temporal resolution. Also, LSMs need a good mapping of irrigation, in order to have realistic covers and explicitly simulate irrigation, which is needed for cropland irrigation management (Ambika et al., 2016). The amount of irrigation surfaces, which is of great importance to water resources management, is still unclear. Therefore, to optimise the models, surfaces of irrigated and non-irrigated fields need to be mapped.
Furthermore, now that LSMs have started to include dams, they need dam level/volume data, which is often difficult to obtain. Temporal continuous water availability in rivers and reservoirs needs to be known to assess the effects of dams in hydrological processes. Precise water levels over reservoirs should be monitored to evaluate the available water amount for irrigations. The buffering effects of dams should be included and assessed in the models for optimisation.
1.2.2 Measurements and remote sensing techniques
The irrigation status is traditionally measured by field campaign, which is time-consuming and more importantly impossible to be done for all areas. Soil moisture is traditionally measured with in situ measurements either by taking soil samples or by the soil moisture probe. However, in situ networks represent single point locations and usually cover relatively short periods of observation (Pratola et al., 2015).
Considering the aspect of water levels, the traditional way of monitoring is using the gauging station or stream gauge, which is a location used by hydrologists to monitor the terrestrial bodies of water. Unfortunately, in situ gauging stations are not always available in many parts of the world, or they are otherwise not publicly available and are maintained by local authorities. Furthermore, over the last few decades, in situ observations of hydrologic variables have generally been in decline (Trenberth et al., 2018).
The access to both data sources is critical, and moreover, continuous temporal data is needed for the monitoring, assessing, modelling and predicting. Yet data are sparse in developing coun-tries both in spatial and in temporal dimensions. Even where such data have been collected, they are rarely shared across ministries or institutions, while thousands of freshwater bodies are the shared resource of several countries.
At the same time, new observation methods that use satellite sensors have thrived over the past few decades. Thanks to the remote sensing technology, we now possess a powerful tool for monitoring the water resources both within inland water systems where no in situ data are available and within transboundary river basins. Wherever satellite data are available, the surface soil moisture, the status of irrigation, and the surface water levels can be assessed and monitored at both regional and global scales.
1.2.3 Challenges
The remote sensing technology used for hydrology has been developed for a few decades to overcome the limitation of lacking data on the time evolution and spatial structure, yet challenges remain to achieve the spatial and temporal resolution needed for hydrological studies.
Satellite systems, both passive and active, have already demonstrated their capability to pro-vide reliable soil moisture measurements (Lacava et al., 2012). The passive satellite Soil Moisture and Ocean Salinity (SMOS) launched November 2nd, 2009 (Kerr et al., 2010) and the Soil Mois-ture Active Passive (SMAP) launched January, 31st 2015 (Entekhabi et al., 2010) provide a global mapping of surface soil moisture based on radiometric measurements at L-band (21 cm, 1.4 GHz). Alternative satellite-based soil moisture products, including products generated by the Advanced Microwave Scanning Radiometer for the Earth observing system (AMSR-E) onboard
the Aqua satellite (Njoku et al., 2003) and the Advanced SCATterometer (ASCAT) onboard the MetOp (Meteorological Operational) satellite (Wagner et al., 2013). However, the soil moisture retrieved from these instruments has a low spatial resolution. SMOS and SMAP data have a spatial resolution of about 40 km (El Hajj et al., 2018), while AMSR-E and ASCAT data have a spatial resolution of about 60 km and 50 km, respectively.
Currently, ASCAT, which is a real-aperture radar instrument, provides the only active global soil moisture dataset. It was designed to observe wind speed and direction over the oceans, but has been shown to be useful to measure large-scale soil moisture (Wagner et al., 2013). Although backscatter data from active sensors have the potential to monitor soil moisture, there is currently no operational soil moisture product from SAR active microwave (Escorihuela and Quintana-Segu´ı, 2016). SAR imagery has been shown to be advantageous for the estimation of soil surface characteristics, in particular surface roughness and soil moisture (Aubert et al., 2011; Baghdadi et al., 2002, 2012; Srivastava et al., 2009; Zribi et al., 2007; Zribi and Dechambre, 2003; Zribi et al., 2005; El Hajj et al., 2014). SAR data in the C-band sensor has demonstrated its ability to retrieve soil characteristics over vegetation-covered surfaces (Prevot et al., 1993; De Roo et al., 2001; Sikdar and Cumming, 2001; Gherboudj et al., 2011; Wang et al., 2011; Yu and Zhao, 2011; Zribi et al., 2011; Yang et al., 2012). However, almost five years after Sentinel-1 satellite (carries a C-band SAR instrument with a spatial resolution about 10 m) was launched, there is still no operational soil moisture product available. Soil moisture retrieval under dense vegetation cover (irrigated crop fields) is still needs to be studied further.
The similar problem exists for irrigation mapping. Studies using remote sensing to map irrigated fields remain relatively rare (Ozdogan et al., 2010). There are only a few studies which identify irrigated areas globally (Salmon et al., 2015; Siebert et al., 2005; Thenkabail et al., 2009; Meier et al., 2018). The global irrigated area mapping (GIAM) undertaken by Thenkabail et al. (2009) uses the combination of meteorological data, land use classification information (forest) and remote sensing data from multiple satellite sensors, and gives spatial resolution about 10 km. Salmon et al. (Salmon et al., 2015) combined national surveys, climate and remote sensing data. However, all these studies are not able to depict individual farm fields. With the diverse range of irrigated field size and scattered distribution, it is difficult to map irrigation fields by satellite remote sensing because of its relatively coarse spatial resolution in comparison to field scale.
For the studying of water levels, satellite altimeters were designed to monitor homogeneous surfaces such as oceans or ice sheets, resulting in poor performance over small inland water bodies due to the contribution from land contamination in the returned waveforms. The advent of SAR altimetry with its improved along-track spatial resolution has enabled the measurement of inland water levels with better accuracy and an increased spatial resolution. However, many previous studies focused on relatively large water bodies, and most studies used low-resolution mode (LRM) altimeters onboard Envisat and ERS. The performance of SAR altimeter over middle-sized and small-sized water bodies still needs to be explored, especially over water bodies with challenging environments.
1.3
About the thesis
1.3.1 Objectives
Within the context of water scarcity and anthropological influence, the objective of this PhD study is trying to better estimate the water resources by involving the human interventions in the hydrological process by using remote sensing data. Considering the two main human interventions, irrigation and dam construction, this PhD study tries to contribute to both parts
1.3. ABOUT THE THESIS 11 to provide parameters with higher accuracies for LSMs or hydrological models.
First, the irrigation is studied by mapping irrigated areas to better support water resources management, droughts and floods forecasts and agricultural development. In the meantime, the soil moisture will be monitored to evaluate the status of the field along with the health of the crops. Soil moisture in itself is an essential part of the regional water resources, and needs to be quantified more precisely. Therefore, the objective of this part is to provide soil moisture product and irrigation maps with satellite data at better spatial accuracy. SAR data provides the possibility of monitoring land surface under any weather conditions and with vegetation cover. Therefore, this PhD study used the recent SAR product from Sentinel-1 mission to develop methodologies of soil moisture retrieval and irrigation mapping at a field scale.
The second aspect considered is the influence of dam constructions for the river basin. Dams constructed aim not just for hydropower, but more importantly for irrigation purpose. To study the influence of dams, a river flow simulation model is considered with which the buffering effects of dams should be included. The water volumes within reservoirs, which is directly linked to the water levels, will be estimated both for analysing the dam effects in the river model and for irrigation activities, whose water withdraw depends on the storage of water in reservoirs. To retrieve the water levels of the reservoirs, the recent SAR altimetry product from the Sentinel-3 mission is considered, since it provides possibilities of water level retrieval over middle-sized and small-sized water bodies.
To conclude, this PhD thesis is to improve the regional water resource estimation by improving both soil moisture and water level products. It will involve the human interventions in each part for a better assessment, including the irrigation study and involving of the dam levels in river flow simulation model.
1.3.2 Structure of the thesis
As a first step, soil moisture retrieval has been done by two change detection methodolo-gies, without field calibrations, and validated over an area characterised by a dense vegetation cover (irrigated crop fields). The soil moisture is retrieved from the synergetic interpretation of Sentinel-1 and Sentinel-2 data. The mean soil moisture is computed at a resolution of 100 m, which is compatible with agricultural applications. Before the 100 m study, soil moisture was also retrieved at 1 km resolution as a test of the methodologies. Despite Sentinel-1 spatial resolution being around 10 m, the soil moisture is estimated a lower resolution (100 m) in order to decrease uncertainties caused by different types of heterogeneities in agricultural fields such as local changes in roughness, heterogeneities in vegetation cover, etc.
For the second step, the irrigation mapping method has been developed using SAR data time series at a field scale. Four metrics, including the mean temporal value, the signal variance, the correlation length, and the fractal dimension were analysed for the mapping. The classification was done with the Support Vector Machine (SVM).
In the third step, water level retrieval has been improved by three specialised algorithms or retrackers to retrieve water levels from SAR altimeter data over inland water bodies dedicated to minimising land contamination from the waveforms. Three different retrackers were modelled, namely, the threshold retracker, the Offset Centre of Gravity (OCOG) retracker, and the 2-step physical-based retracker; the parameters of these retrackers were adjusted for inland water bodies. Additionally, the digital elevation model (DEM) information was included to limit land contamination within the received waveforms and to improve the accuracy for the monitoring of middle-sized and small-sized water bodies.
In the last step, the satellite-derived water levels were converted to water volumes and involved in a river flow model to see the buffering effect of dams in river flow simulations. The observed
levels were used to tell the model to try to be close to those levels, which is a technique to include observed information in the simulation.
The following manuscript is structured in 6 parts:
• Chapter 2, offering a detailed description of the remote sensing technology related to soil moisture and water level monitoring.
• Chapter 3, presenting the study area and database
• Chapter 4, that presents the improvements of soil moisture retrieval, and based partly on published article (Gao et al., 2017)
• Chapter 5, presenting the irrigation mapping methodology, based on published article (Gao et al., 2018)
• Chapter 6, demonstrating the improved water level retrieval, based on published article (Gao et al., 2019)
• Chapter 7, as an expansion of Chapter 6, showing the dam simulation that evaluates the buffering effect of dams in hydrological models
• Chapter 8, offering general conclusions and future perspectives
The three articles on which Chapter 4, 5, and 6 are based are listed below with details: • Gao, Q.; Zribi, M.; Escorihuela, M.J.; Baghdadi, N. Synergetic Use of Sentinel-1 and
Sentinel-2 Data for Soil Moisture Mapping at 100 m Resolution. Sensors 2017, 17, 1966. DOI: 10.3390/s17091966
Quartile / Impact factor of the journal: Q2 / 3.031 Citation (based on Google Scholar): 47
Author contributions: Qi Gao wrote the article text. The co-authors provided correc-tions and improvement to the text. Qi Gao designed and wrote the code to apply the method. Mehrez Zribi supervised the method. The satellite data was downloaded from Google Earth Engine (GEE) and processed by Qi Gao. The in situ data was provided by Lab-Ferrer.
• Gao, Q.; Zribi, M.; Escorihuela, M.J.; Baghdadi, N.; Quintana Segu´ı, P. Irrigation Map-ping Using Sentinel-1 Time Series at Field Scale. Remote Sens. 2018, 10, 1495. DOI: 10.3390/rs10091495
Quartile / Impact factor of the journal: Q1 / 4.118 Citation (based on Google Scholar): 9
Author contributions: Qi Gao wrote the article text. The co-authors provided correc-tions and improvement to the text. Qi Gao designed and wrote the code to apply the method. Mehrez Zribi supervised the method. The satellite data was downloaded from Google Earth Engine (GEE) and processed by Qi Gao. The in situ data was downloaded from SIGPAC (Geographic Information System for Agricultural Parcels) and processed by Qi Gao.
1.3. ABOUT THE THESIS 13 • Gao, Q.; Makhoul, E.; Escorihuela, M.J.; Zribi, M.; Quintana Segu´ı, P.; Garc´ıa, P.; Roca, M. Analysis of Retrackers’ Performances and Water Level Retrieval over the Ebro River Basin Using Sentinel-3. Remote Sen. 2019, 11, 718. DOI: 10.3390/rs11060718
Quartile / Impact factor of the journal: Q1 / 4.118 Citation (based on Google Scholar):
-Author contributions: Qi Gao wrote the article text. The co-authors provided correc-tions and improvement to the text. Qi Gao designed and wrote the code to apply the method based on the code of Eduard Makhoul. Maria Jose Escorihuela supervised the work. The satellite data was downloaded from Copernicus Open Access Hub and pro-cessed by Qi Gao. The in situ data was downloaded from SAIH (Sistema Autom´atico de Informaci´on Hidrol´ogica) Ebro and processed by Qi Gao.
Chapter 2
Remote Sensing Principles
Contents
2.1 Introduction . . . 15 2.1.1 Electromagnetic waves . . . 15 2.1.2 Characteristics of electromagnetic waves . . . 16 2.2 Microwave remote sensing . . . 17 2.2.1 Radar . . . 18 2.2.2 Synthetic Aperture Radar . . . 20 2.2.3 Imaging systems . . . 21 2.2.4 Ranging system and principle of altimetry . . . 25 2.3 Conclusion . . . 28
2.1
Introduction
According to Caloz and Collet (Caloz and Collet, 2001), remote sensing is defined as the technique of remote observation by the measurement and the analysis of the electromagnetic radiation emitted or reflected by the studied object to interpret the information about its nature, its properties and status. It is based on the use of sensors to record electromagnetic radiation and converting it into a digital output signal.
Satellite-based remote sensing has been rapidly developed after the first launch of an artificial satellite named Sputnik I in 1957 (Tatem et al., 2008). It is a valuable tool in many study areas including weather forecast, climate, hydrology, oceanography, and land use.
There are two types of remote sensing, namely passive and active (Gupta et al., 2013). Passive remote sensing needs an external energy source for objects to reflect or radiate, which in most cases is the sun. Active remote sensing system has its own energy source (Campbell and Wynne, 2011). The sensor onboard the satellite or aircraft emits a signal towards the target surface, and receives its reflection by the target object for further processing.
2.1.1 Electromagnetic waves
Electromagnetic (EM) waves are energy transported through space as a result of periodic disturbances of an electric field and a magnetic field (Rammer and Smith, 1986). Most sen-sors record information about the Earth’s surface by measuring the transmission of energy from the surface in different portions of the EM spectrum (Figure 2.1) (Aggarwal , 2003). The EM
spectrum can be divided into seven different regions: gamma rays (highest frequency and short-est wavelength), X-rays, ultraviolet, visible light, infrared, microwaves and radio waves (lowshort-est frequency and longest wavelength) (Wait, 1985).
Remote sensing technology uses different bands of electromagnetic spectrum for different purposes. The most common bands include visible spectrum, infrared and microwave with mi-crowave domain most sensitive to soil moisture and can be used to measure distance, which is the principle of altimetry. Data collected over a large number of wavelength bands is called multispectral or hyperspectral data.
Figure 2.1: The electromagnetic spectrum. Modified from GSP (2018).
2.1.2 Characteristics of electromagnetic waves
EM waves travel through space at the same speed, c = 2.99792458∗108m/s, commonly known
as the speed of light. Besides this, EM waves have certain characteristics, including amplitude, wavelength/frequency, phase and polarization.
Amplitude
Amplitude is the distance from the maximum vertical displacement of the wave to the middle of the wave. It measures the magnitude or intensity of the oscillation of a wave, with larger values corresponding to higher energy and lower values corresponding to lower energy.
Wavelength
Wavelength is the distance of one full cycle of the wave oscillation. Wavelength and frequency are related to the speed of light by the equation:
c = f ∗ λ (2.1)
where c is the speed of light, f is the frequency, and λ is the wavelength. Longer wavelength corresponds to lower frequency, which is proportional to energy, whilst shorter wavelength cor-responds to the higher frequency and higher energy.
Phase
Phase is the position of a point in time on a waveform cycle. Phase information can be used to correct Doppler effects, calculate time delay, and is an important parameter in interferometry for deformation monitoring.
Polarization
Polarization is a property of the transverse waves that specifies the geometrical orientation of the oscillations (Shipman et al., 2015). The EM wave consists of two fluctuating fields which are the electric field (E) and magnetic field (B). The two vectors are orthogonal to one another, and both are perpendicular to the direction of travel (Figure 2.2).
2.2. MICROWAVE REMOTE SENSING 17
Figure 2.2: The EM wave illustration. Modified from Jensen (2005).
The polarization of the electromagnetic waves refers to the orientation of E (Smith and Schurig, 2003). If both E and B remain in their respective planes, the radiation is called plane or linearly polarized (Sandwell , 2009). There are two types of polarization including vertically polarization with E parallel to the plane of incidence, and horizontal polarization with E per-pendicular to the plane of incidence. The plane of incidence is the plane defined by the vertical and the direction of propagation. Linear polarization is normally used by active remote sensing systems.
2.2
Microwave remote sensing
In particular, microwave remote sensing uses electromagnetic radiation with a wavelength be-tween 1 cm and 1 m (300 MHz to 30 GHz commonly referred to as microwaves) as a measurement tool.
While electromagnetic waves in the visible and infrared portions of the spectrum primarily characterised by wavelength, microwave portions of the spectrum are often referenced according to both wavelength and frequency (Natural Resources Canada, 2015). The microwave region of the spectrum is quite large, relative to the visible and infrared, and there are several wavelength ranges or bands commonly used which given code letters during World War II, and remained to today as listed in Table 2.1 (du Preez and Sinha, 2016).
Microwave remote sensing has many advantages compared to optical remote sensing. It has a day-and-night imaging capability, and ability to penetrate could cover, haze, fog, and to some extent, rain as shown in Figure 2.3. For lower frequencies at L- and P-band, the transmission rate is almost 100%. Moreover, microwave remote sensing is more sensitive to the dielectric constant of the medium and structural characteristics of the surface, such as roughness or canopy structure compared to optical sensors (Ulaby et al., 1986a; Dobson and Ulaby, 1981).
Table 2.1: The frequency range and wavelength range of microwave bands (du Preez and Sinha, 2016).
Band name Frequency range Wavelength range
P band 0.3 - 1 GHz 30 - 100 cm L band 1 - 2 GHz 15 - 30 cm S band 2 - 4 GHz 7.5 - 15 cm C band 4 - 8 GHz 3.8 - 7.5 cm X band 8 - 12.5 GHz 2.4 - 3.8 cm Ku band 12.5 - 18 GHz 1.7 - 2.4 cm K band 18 - 26.5 GHz 1.1 - 1.7 cm Ka band 26.5 - 40 GHz 0.75 - 1.1 cm
Figure 2.3: One-way transmission rate (%) of microwave through vapor clouds, ice clouds, and rain as a function of frequency (and wavelength) (Ouchi , 2013).
2.2.1 Radar
Similar to remote sensing systems, microwave remote sensing systems are also classified into two groups: passive and active. Passive systems collect the radiation in microwave bands that is naturally emitted by the target surface, and they are generally characterised by relatively low spatial resolutions.
On the contrary, active microwave systems emit their own waves in the microwave bandwidth from the transmitter towards the observed surface. The power of the backscattered signal can be used to discriminate different targets within the scene, while the time between the sent and the received signal is used to measure the distance of the target. A system that operates in this way is called radar (RAdio Detection And Ranging), and also can obtain a microwave image of the observed scene.
The fundamental relation between the characteristics of the radar, the target, and the received signal is called the radar equation (Ulaby et al., 1986b). The geometry of scattering from an isolated radar target (scatterer) is shown in Figure 2.4, along with the parameters that are
2.2. MICROWAVE REMOTE SENSING 19 involved in the radar equation. When a power Pt is transmitted by an antenna with gain Gt,
Figure 2.4: Geometry of radar equation (Ulaby et al., 1986b).
the power per unit solid angle in the direction of the scatterer is Pt∗ Gt. The power density at the scatterer Ss is:
Ss= (PtGt)( 1 4πR2
t
)Ars (2.2)
where Ars is the effective receiving area of the scatterer, and the spreading loss (4πR1 2
t
) is the reduction in power density associated with spreading of the power over a sphere of radius R surrounding the antenna.
Some of the power received by the scatterer is absorbed in losses in the scatterer, unless it is a perfect conductor or a perfect isolator; the rest is re-radiated in various directions (Ulaby et al., 1982). The fraction absorbed is Fa, so the fraction reradiated is 1 − Fa.
With the spreading factor for the re-radiation ( 1 4πR2
r), and the effective aperture of the
re-ceiving antenna Ar, the gain at the receiver can be expressed as:
Pr= (PtGt)( 1 4πR2 t )Ars(1 − fa)Gts( 1 4πR2 r )Ar = ( PtGtAr (4π)2R2 tRr2 )[Ats(1 − fa)Gts] (2.3)
The factors associated with the scatterer are combined in the square brackets, which are difficult to measure individually, and their relative contributions are irrelevant for the size of the received radar signal. Hence they are normally combined into one factor, the radar scattering cross section:
σ = Ats(1 − fa)Gts (2.4)
Therefore, the final form of the radar equation is obtained by rewriting equation 2.3:
Pr= (
PtGtAr (4π)2R2
tR2r
)σ (2.5)
Most radar sensors are designed to transmit microwave radiation either horizontally polarized (H) or vertically polarized (V). Similarly, the antenna receives either the horizontally or vertically polarized backscattered energy, or both. Thus, there can be four combinations considering the two polarization states for transmission and reception:
HH - for horizontal transmit and horizontal receive, VV - for vertical transmit and vertical receive, HV - for horizontal transmit and vertical receive, VH - for vertical transmit and horizontal receive.
Radar can measure amplitude, which is the strength of the reflected signal, and phase, which is the position of a point in time on a waveform cycle (Podest, 2017). Amplitude depends on the target properties such as structure and dielectric properties, while the phase is a function of the distance between the sensor and the target as well as target properties. Therefore, radar sensors are generally divided into two distinct categories: imaging and non-imaging.
2.2.2 Synthetic Aperture Radar
Similar to conventional radar, Synthetic Aperture Radar (SAR) sequentially transmits elec-tromagnetic waves towards the Earth surface. The microwave energy scattered back to the antenna is measured. The consecutive time of transmission and reception converts into different locations due to the platform movement (Moreira et al., 2013). An appropriate coherent combi-nation of the received signals makes it possible to construct a virtual aperture much longer than the physical antenna length (Skolnik , 2008).
Figure 2.5: SAR geometry (Moreira et al., 2013).
Figure 2.5 illustrates the typical SAR geometry, where the platform moves in the azimuth or along-track direction, and slant range is the direction perpendicular to the radar’s flight path. The swath width gives the ground-range extent of the radar scene, which depends on the measurement taken duration, i.e., how long the radar is turned on (Moreira et al., 2013). Compared to Real Aperture Radar (RAR), SAR synthetically increases the antenna’s size to