Early brainstem
[18F]
THK5351 uptake is linked to cortical
hyper-excitability in healthy aging
Maxime Van Egroo, … , Evelyne Balteau, Gilles Vandewalle
JCI Insight. 2020. https://doi.org/10.1172/jci.insight.142514. In-Press Preview
Background. Neuronal hyper-excitability characterizes the early stages of Alzheimer’s disease (AD). In animals, early misfolded tau and amyloid-beta (Aβ) protein accumulation, both central to AD neuropathology, promote cortical excitability and neuronal network dysfunction. In healthy humans, misfolded tau and Aβ aggregates are first detected, respectively, in the brainstem and frontomedial and temporobasal cortices, decades prior to the onset of AD cognitive symptoms.
Whether cortical excitability is related to early brainstem tau, and its associated neuroinflammation, and cortical Aβ aggregations remains unknown.
Methods. We probed frontal cortex excitability, using transcranial magnetic stimulation combined with
electroencephalography, in a sample of 64 healthy late middle-aged individuals (50-69 y; 45 women). We assessed whole-brain [18F]THK5351 positron emission tomography (PET) uptake as a proxy measure of tau/neuroinflammation, and whole-brain Aβ burden with [18F]Flutemetamol or [18F]Florbetapir radiotracers.
Results. We find that higher [18F]THK5351 uptake in a brainstem monoaminergic compartment is associated with increased cortical excitability (r = .29, p = .02). By contrast, [18F]THK5351 PET signal in the hippocampal formation, although strongly correlated with brainstem signal in whole-brain voxel-based quantification analyses (pFWE-corrected < .001), was not significantly associated with cortical excitability (r = .14, p = […]
Clinical Medicine Aging Neuroscience
Title: Early brainstem [18F]THK5351 uptake is linked to cortical hyper-excitability in healthy
aging
Authors and affiliations: Maxime Van Egroo1, Daphne Chylinski1, Justinas Narbutas1,2, Gabriel Besson1, Vincenzo Muto1,2, Christina Schmidt1,2, Davide Marzoli1, Paolo Cardone1, Nora Vandeleene1, Martin Grignard1, André Luxen1, Eric Salmon1,2,3, Christian Lambert4,
Christine Bastin1,2, Fabienne Collette1,2, Christophe Phillips1,5, Pierre Maquet1,3, Mohamed Ali Bahri1, Evelyne Balteau1, Gilles Vandewalle1*
1GIGA-Cyclotron Research Centre-In Vivo Imaging, University of Liège, Liège, 4000,
Belgium; 2Psychology and Cognitive Neuroscience Research Unit, University of Liège, Liège, 4000, Belgium; 3Department of Neurology, University Hospital of Liège, Liège, 4000, Belgium; 4Wellcome Centre for Human Neuroimaging, University College London Institute
of Neurology, London, UK; 5GIGA-In Silico Medicine, University of Liège, Liège, 4000, Belgium
*Correspondence to: Gilles Vandewalle, GIGA-Cyclotron Research Centre-In Vivo Imaging,
Bâtiment B30, Allée du 6 Août, 8, 4000 Liège, Belgium, +3243662316, [email protected]
Abstract
Background. Neuronal hyper-excitability characterizes the early stages of Alzheimer’s disease (AD). In animals, early misfolded tau and amyloid-beta (Aβ) protein accumulation, both central to AD neuropathology, promote cortical excitability and neuronal network dysfunction. In healthy humans, misfolded tau and Aβ aggregates are first detected, respectively, in the brainstem and frontomedial and temporobasal cortices, decades prior to the onset of AD cognitive symptoms. Whether cortical excitability is related to early brainstem tau, and its associated neuroinflammation, and cortical Aβ aggregations remains unknown.
Methods. We probed frontal cortex excitability, using transcranial magnetic stimulation combined with electroencephalography, in a sample of 64 healthy late middle-aged individuals (50-69 y; 45 women). We assessed whole-brain [18F]THK5351 positron emission tomography
(PET) uptake as a proxy measure of tau/neuroinflammation, and whole-brain Aβ burden with
[18F]Flutemetamol or [18F]Florbetapir radiotracers.
Results. We find that higher [18F]THK5351 uptake in a brainstem monoaminergic compartment is associated with increased cortical excitability (r = .29, p = .02). By contrast, [18F]THK5351 PET signal in the hippocampal formation, although strongly correlated with brainstem signal in whole-brain voxel-based quantification analyses (pFWE-corrected < .001), was not significantly
associated with cortical excitability (r = .14, p = .25). Importantly, no significant association was found between early Aβ cortical deposits and cortical excitability (r = -.20, p = .11). Conclusion. These findings reveal potential brain substrates for increased cortical excitability in preclinical AD and may constitute functional in vivo correlates of early brainstem tau accumulation and neuroinflammation in humans.
Funding. F.R.S.-FNRS Belgium, Wallonie-Bruxelles International, ULiège, Fondation Simone et Pierre Clerdent, European Regional Development Fund.
Introduction
Alzheimer’s disease (AD) is characterized by a pathogenesis that spreads over decades prior to the onset of cognitive symptoms (1). Tau neurofibrillary tangles (NFT) and amyloid-beta (Aβ) senile plaques play a central role in this process (2). Post-mortem studies showed that the accumulation of misfolded hyperphosphorylated tau protein, which eventually assembles into NFT, appears prior to any detectable Aβ lesion (3). By the age of 30, a vast majority of the population presents hyperphosphorylated tau aggregates in the brainstem locus coeruleus (LC), sometimes concomitantly to other brainstem nuclei such as the dorsal raphe (3–5). Tau aggregates and NFT then spread to the entorhinal and hippocampal regions, before following its stereotypical outward progression pattern in the cortex, with about half of the post-mortem samples showing some NFT by the sixth decade of life (3). By contrast, Aβ senile plaques are not found before the fifth decade of life while about 20% of the population present Aβ senile plaques between 50 and 60 years (6). Aβ senile plaques also follow a stereotyped progression pattern but it is distinct from tau NFT expansion. They are first found in the frontomedial and temporobasal areas, before reaching the rest of the neocortex, allocortical brain regions (e.g. entorhinal cortex and hippocampus) as well as nuclei from the basal forebrain, and ultimately encompass brainstem nuclei and the cerebellum (6, 7).
Growing evidence supports the idea that AD pathogenesis affects neuronal function well before producing neuronal loss and brain atrophy. Increase in neuronal excitability, which reflects neuron responsiveness and response selectivity, has been reported to temporarily take place before AD symptom onset (8, 9). Motor cortex hyper-excitability was reported in prodromal AD (Mild Cognitive Impairment - MCI) (10, 11), while cortical excitability decreases markedly in more advanced AD (12). Moreover, acetylcholinesterase inhibitor therapy was suggested to restore normal cortical excitability in AD patients (13). This temporary increase in cortical excitability has been proposed to represent a compensatory
mechanism to face the early brain Aβ or tau deposits (9). Monitoring cortical excitability could therefore enhance early/pre-symptomatic risk assessment and diagnosis, and help monitoring disease progression.
The release of both tau and Aβ in the extracellular space are regulated by neuronal activity (14, 15). Elevated interstitial and cerebrospinal (CSF) fluid tau and Aβ levels have been observed during periods of extended neuronal activity such as sleep deprivation (16, 17). In AD animal models, tau pretangles and their surrounding soluble hyperphosphorylated form, tau NFTs, Aβ oligomers as well as Aβ senile plaques are known to have a deleterious impact on neuronal function (8, 18). In addition, tau presence is associated with inflammatory reaction through increased microglial and astrocytic activation (19, 20), which further contribute to synaptic dysfunction (21–23). Interestingly though, several studies reported a direct relationship between early tau protein accumulation and increased neuronal excitability in rodents and drosophila models in distant areas (24–26). Likewise, transgenic AD rodent models overexpressing mutant human amyloid precursor protein (APP) revealed that Aβ pathology promotes hyperexcitation and hyperactivity of hippocampus and neocortex neurons (27).
Regional quantification of tau pretangles and soluble hyperphosphorylated forms as well as Aβ oligomers remain impossible in vivo in humans, so their direct impact on brain function is unknown. In vivo positron emission tomography (PET) imaging of Aβ senile plaques has been reliably available in humans for almost 2 decades so their correlates in cognitively normal individual and patients are relatively well established (28). In contrast, tau NFT in vivo imaging has only been possible over the past 5 years or so (29). In addition, most 1st and 2nd generation tau PET markers have different degrees of off-binding, including to monoamine oxidase-B (MAO-B), which prevents from isolating the specific consequence of tau NFT from, for instance, neuroinflammatory processes (30).
Here, our main goal was to assess whether, among late middle-aged cognitively normal individuals (50 to 69 y), cortical excitability was associated with early tau NFT and neuroinflammation burden and with early Aβ senile plaques. We directly measured cortical excitability using electroencephalogram (EEG) recordings of brain responses to transcranial magnetic stimulation (TMS), which mimics the active brain processing of external stimulation. We assessed whole-brain [18F]THK5351 PET uptake as a proxy of tau NFT/neuroinflammation
burden as well as whole-brain Aβ burden using [18F]Flutemetamol and [18F]Florbetapir PET imaging. Based on quantitative magnetic resonance imaging (MRI) data, we then extracted
[18F]THK5351 and Aβ radiotracer uptake values within their respective first sites of
accumulation, i.e. in a compartment of the brainstem including monoaminergic neurons for
[18F]THK5351 uptake, and in the medial prefrontal cortex and inferior temporal lobe for
Aβ-PET (Figure 1, Table 1). We hypothesized that both brainstem [18F]THK5351 and neocortical Aβ-PET uptake values would be associated with increased cortical excitability.
Results
Our analysis first focused on the link between cortical excitability, as assessed with TMS-EEG over the frontal cortex (TMS-evoked EEG potential – TEP), and [18F]THK5351 PET signal in the brainstem monoaminergic grey matter (bmGM). We found a significant and positive association between TEP slope and bmGM mean [18F]THK5351 standardized uptake value ratio (SUVR), both in a simple correlation and after adjusting for TMS-EEG stimulation parameters and demographic variables (Pearson’s correlation: r = .29, p = .02; GLMM: F1,57 = 4.76, p =
.03, R²β* = .08; Figure 2A, Table 2).
To address the specificity of the highlighted relationship, we then investigated the link between cortical excitability and average Aβ centiloid values in stage 1 regions of interest (ROI), i.e. in the earliest sites of senile plaques aggregation. We found no significant relationship between TEP slope and stage 1 ROI Aβ burden (Pearson’s correlation: r = -.20, p = .11; GLMM: F1,57 = 1.41, p = .24; Figure 2B, Table 2). Interestingly, including both bmGM [18F]THK5351 SUVR and stage 1 Aβ burden together in the same statistical model, i.e. taking
into account the variance they respectively explain, still revealed a significant main effect of bmGM [18F]THK5351 values (GLMM: F
1,56 = 5.78, p = .02, R²β* = .09) but not of stage 1 Aβ
burden (Table 2).
Our next step was to further address the regional specificity of the association between
[18F]THK5351 PET signal and cortical excitability. To do so, we first performed voxel-based
quantification (VBQ) analyses on standardized [18F]THK5351 SUVR maps to reveal brain regions for which [18F]THK5351 radiotracer uptake correlated with bmGM uptake. In line with our expectation based on the literature, we found a highly significant correlation with
[18F]THK5351 values within most of the medial temporal lobe (MTL, p
FWE-corrected < .001,
connecting the brainstem to the MTL, but also widespread projections towards the whole cortex (pFWE-corrected < .001; Figure 3B).
Therefore, we finally extracted mean [18F]THK5351 SUVR over the MTL to test
whether the positive association between cortical excitability and [18F]THK5351 PET signal was dependent on the affected region. Paired t-test analysis showed that mean [18F]THK5351 SUVR was significantly higher in the MTL compared to the bmGM region (t = 10.14, p < .0001; Figure 3C). Yet, we found no significant relationship between cortical excitability and mean [18F]THK5351 SUVR in the MTL (Pearson’s correlation: r = .14, p = .25; GLMM: F
1,57
= 1.89, p = .17; Figure 3D, Table 4). Importantly, the correlation value between mean bmGM
[18F]THK5351 SUVR and cortical excitability was significantly higher than the correlation
value between mean MTL [18F]THK5351 SUVR and cortical excitability (Fisher’s z = 2.20, p
Discussion
With this cross-sectional study, we show that [18F]THK5351 uptake in a compartment of the brainstem including monoaminergic neurons is associated with increased cortical excitability in cognitively normal individuals aged 50 to 69 years. We interpret this result with respect to tau NFT accumulation and neuroinflammation. By contrast, cortical excitability levels are not significantly linked to the presence of Aβ senile plaques measured in their typical earliest aggregation sites. We further find that brainstem [18F]THK5351 PET signal co-localizes with its uptake in the MTL, in line with human post-mortem studies on tau NFT progression (3). However, the association between cortical excitability and [18F]THK5351 uptake in the latter region is not significant. Altogether, these findings support that increased cortical excitability is specifically related to the presence of tau aggregates and neuroinflammation, potentially in a region-specific manner, with the most evident association observed among brainstem monoaminergic nuclei.
[18F]THK5351 is a first generation PET marker of tau NFT that was reported to bind
substantially to MAO-B associated with neuroinflammation in addition to binding to tau NFT (31). Antemortem PET studies of [18F]THK5351 SUVR and postmortem neuropathologic
studies in progressive supranuclear palsy (32) and AD (29), including ex vivo autoradiography with the selective reversible MAO-B inhibitor lazabemide (32), reported that [18F]THK5351
binding originates to a large extent (~50%) in reactive astrocytes that express increased levels of MAO-B (31). This unintended binding is, however, most pronounced over the basal ganglia, and is also found, although to a lesser extent, in second generation tau radiotracers (30). Neuroinflammation in astrocytes and microglial dysfunction have been proposed to result from tau-mediated neurodegeneration of LC neurons, potentially through norepinephrine depletion (20, 33, 34). In the rest of the discussion, we therefore interpret brainstem [18F]THK5351 as a marker of tau NFT accumulation and of (potentially tau-induced) neuroinflammation, bearing
in mind uncertainties and non-specificity of the binding. Future studies should employ radiotracers that are more specific to tau protein to further disentangle the respective roles of tau NFT, neuroinflammation, and their interaction in the relationship with increased cortical excitability. Such radiotracers may be available (35, 36) or are still under development (30, 37).
Increased cortical excitability was previously reported in MCI and AD patients, i.e. in the presence of cognitive symptoms (10, 11, 13). Our results show that increased cortical excitability can also be observed in healthy individuals, potentially during preclinical phases of AD, i.e. over the asymptomatic period during which AD-related pathophysiological processes evolve and may lead to subsequent symptomatic AD in some individuals. A rationale often proposed to account for the increased cortical excitability in MCI and first stages AD patients postulates that it represents a compensatory mechanisms to counteract synaptic dysfunction and tau NFT accumulation within neuronal networks (9). A computational model of neuronal dynamics in AD further reported that the most efficient intervention to counter AD-related network dysfunction and enhance its functional survivability was a selective increase in excitability of excitatory neurons (38). This compensatory phenomenon may in turn favor pathological progression as neuronal hyper-activity increases amyloid-beta and tau release (14, 15). Within this scenario, a vicious circle would therefore take place up to a point where Aβ, tau and neuroinflammation burden and neurodegeneration would be too important to sustain increased excitability (24, 39, 40). This would imply an inverted U-shape relationship between cortical excitability and network integrity over AD-related pathophysiological processes, with progressive increase in cortical excitability compensating tau-driven synaptic dysfunction early in the process, followed by decreased excitability in more advanced AD neuropathological stages.
The fact that cortical excitability was associated with tau/neuroinflammation PET measures in a brainstem region including monoaminergic neurons is compatible with the assumption that the association may arise, at least in part, from the LC or from nearby monoaminergic nuclei (e.g. raphe) that are part of the ascending reticular activating system. Tau NFT/neuroinflammation burden in these nuclei could alter their functioning and their impact on distant cortical neurons, e.g. in the prefrontal cortex where we assessed cortical excitability. Higher resolution PET and MRI data geared towards isolating brainstem nuclei, such as methods based on the neuromelanin-dependent signal of the LC (41), are, however, required to truly test this assumption.
Previous animal studies reported that cortical excitability increased as a function of tau burden in the hippocampal region or reported reduced cortical excitability following genetic manipulation reducing overall endogenous tau levels (24, 25, 42, 43). However, those studies did not specifically assess tau presence in the brainstem, even if the literature would suggest that tau accumulation within the LC/brainstem and hippocampal structure should be at least partially concomitant (4). Cortical excitability across the different steps of the stereotypical outward progression of tau NFTs will have to be monitored to resolve this issue. We nevertheless provide original in vivo functional correlates of tau-related PET measures in the brainstem in healthy individuals with tau spread limited to its earliest stages.
The absence of significant link between medial prefrontal cortex excitability and Aβ-PET marker uptake in the medial prefrontal cortex and inferior temporal lobe is somewhat unexpected given the previous links reported in rodents models (27, 44). Yet, Aβ oligomers and Aβ senile plaques have also been repeatedly associated with lower synaptic spine density, reduced long-term potentiation and increased long-term depression, as well as reduced neuronal excitability (45, 46). In addition, hyper-excitability was detected in young AD mutant mice suggesting that increased neuronal excitability was independent of Aβ plaque formation
(44). Likewise, efficient Aβ immunotherapy in mice failed to restore normal neuronal function (44). The relationship between AD pathophysiology and neuronal function is therefore complex. Overall, our results suggest that the link between frontal cortical excitability and brainstem tau NFT/neuroinflammation burden is more evident than a putative link with medial prefrontal and inferior temporal cortex Aβ senile plaques burden.
Given the cross-sectional nature of our study, we cannot infer about causality, and mechanisms underlying our findings remain elusive. In a first scenario, we propose that the progressive accumulation of misfolded tau protein in the brainstem, particularly over the LC and dorsal raphe nuclei (3), trigger increased cortical excitability as a compensatory mean to face tau NFT accumulation and its associated neuroinflammation. Whole-cell patch-clamp recordings in a mouse model of progressive tauopathy found that frontal cortical neurons exhibit electrophysiological alterations including a more depolarized resting membrane potential (47), which would result in increased cortical excitability. In addition, altered excitation/inhibition balance and subsequent hyper-excitability may be a consequence of tau accumulation through tau-dependent inhibitory interneurons depletion (48). Although these observations lend support to our first scenario, they were never focused on brainstem tau burden. One cannot exclude therefore a second scenario, where increased cortical excitability, which could constitute an endogenous response to environmental factors such as anxiety or lack of sleep, would favor tau production, release, and aggregation and neuroinflammation in the brainstem.
Aside from [18F]THK5351 unspecific binding to MAO, our experiment bears additional limitations. First, we measured cortical excitability exclusively over the frontal cortex. While this area allows for minimally artefacted data and covers the area of earliest Aβ deposit, probing cortical excitability over different parts of the cortex may reveal a broader relationship between early tau/neuroinflammation and alterations of neuronal function. Another limitation of our
study is that it only included healthy individuals with relatively limited tau NFT spread. Individuals with more advanced tau pathology, MCI, and early AD patients would have provided further characterization of the link between cortical excitability and AD pathophysiological progression, and especially tau pathology. Yet, individuals included in our study sample were thoroughly screened for their health and cognitive status, reducing the probability of biases arising from health conditions or AD-related comorbidities. In addition, individuals’ sleep-wake history was carefully controlled prior to TMS-EEG data acquisition, and cortical excitability measures were acquired in the morning under strictly controlled conditions, after a fixed duration of wakefulness to account for the known changes in cortical excitability with prior wakefulness duration and time-of-day (49–52). Furthermore, TMS-EEG allows to assess cortical excitability directly and reliably, while bypassing any potential age-related sensory biases. Finally, we used state-of-the-art brainstem segmentation methods based on quantitative multiparametric imaging to automatically and systematically isolate brainstem monoaminergic tissue.
In conclusion, the present results point to brainstem tau NFT and neuroinflammation as correlates of the increased excitability observed in the earliest stages of AD neuropathology. These findings bring new insights into the interplay between cortical function and the first signs of tau aggregation and its associated neuroinflammation in the brainstem. Furthermore, they suggest that cortical excitability could constitute a specific biomarker of early misfolded tau protein aggregates and neuroinflammation in the brainstem and potentially of increased risk for AD in cognitively normal healthy individuals.
Methods
Experimental design
Healthy older individuals aged 50-70 years were enrolled in a multi-modal cross-sectional study investigating the relationships between AD neuropathology, wake-dependent cortical excitability dynamics, and cognitive aging. In that context, we measured cortical excitability over the frontal cortex using TMS-EEG, and we performed whole-brain tau/neuroinflammation-PET and Aβ-PET imaging. All participants also underwent quantitative multiparametric MRI acquisitions for subsequent brainstem segmentation.
Participants
One hundred and one healthy older individuals (mean age = 59.4 ± 5.3 years; 68 women) took part in this research. Exclusion criteria for the study were: clinical symptoms of cognitive impairment (Dementia rating scale < 130 (53); Mini mental state examination < 27); Body Mass Index (BMI) ≤ 18 and ≥ 29; recent psychiatric history or severe brain trauma; addiction, chronic medication affecting the central nervous system; smoking, excessive alcohol (> 14 units/week) or caffeine (> 5 cups/day) consumption; shift work in the past 6 months; transmeridian travel in the past two months; high levels of anxiety, as measured by the 21-item self-rated Beck Anxiety Inventory (BAI ≥ 17) (54); high levels of depression, as assessed by the 21-item self-rated Beck Depression Inventory (BDI ≥ 17) (55). Participants with sleep apnea (apnea-hypopnea index ≥ 15/hour) were excluded based on an in-lab screening night of standard polysomnography.
A subsample of 65 participants who had data for both tau/neuroinflammation- and Aβ-PET assessments was considered for the present paper. One participant was further excluded from the study sample because of extreme outlier values on whole-brain [18F]THK5351 PET assessment (> 5 standard deviations from the mean). Demographic characteristics of the final sample (N = 64) are described in Table 1.
Experimental protocol
For 7 days prior to TMS-EEG protocol, participants followed a regular sleep-wake schedule (± 30 min), in agreement with their preferred bed and wake-up times. Compliance was verified using sleep diaries and wrist actigraphy (Actiwatch©, Cambridge Neurotechnology, UK). Aside from the fixed sleep-wake schedule, participants were also instructed to abstain from unusual physical exercise as well as caffeine and alcohol consumption for the last 3 days of fixed sleep-wake schedule. The day before the experiment, participants arrived to the laboratory 8 hours before their habitual bedtime and were kept in dim light (< 5 lux) for 6.5 hours preceding bedtime. Participants then slept a full night of sleep recorded with EEG.
TMS-EEG assessments were performed on the next day in the context of a 20h protocol of wakefulness extension in strictly controlled constant routine conditions, i.e. in-bed semi-recumbent position (except for scheduled bathroom opportunities), dim light < 5 lux, temperature ~19°C, regular isocaloric food intake, no time-of-day information, and sound-proofed rooms. The protocol schedule was adapted to individual sleep-wake time, and lasted up to the theoretical mid-sleep time (e.g. for an individual waking up at ca. 07:00 AM, the protocol ended at ca. 03:00 AM in the following night). Cortical excitability over the frontal cortex was measured 5 times throughout the protocol. For the present paper, we only considered the first assessment of cortical excitability recorded 3 hours after wake-up time (± 0.21 hours) to avoid any wake-dependent modulation of cortical excitability (51, 52). Other considerations related to repeated TMS-EEG sessions are reported elsewhere (51).
TMS-EEG signal acquisition and processing
Optimal stimulation parameters (i.e. location, orientation, and intensity) were determined during a separate TMS-EEG session carried out prior to the experimental protocol, and allowed for EEG recordings free of muscular and magnetic artefacts. As in previous experiments (49, 50, 52), the target location was in the superior frontal gyrus. For all TMS-EEG recordings,
pulses were generated by a Focal Bipulse 8-Coil (Nexstim, Helsinki, Finland). Interstimulus intervals were randomized between 1900 and 2200 ms. TMS-evoked responses were recorded with a 60-channel TMS-compatible EEG amplifier (Eximia, Helsinki, Finland), equipped with a proprietary sample-and-hold circuit which provides TMS artefact-free data from 5 ms post stimulation (56). Electrooculogram (EOG) was recorded with two additional bipolar electrodes. EEG signal was band-pass filtered between 0.1 and 500 Hz and sampled at 1450 Hz. Before each recording session, electrodes impedance was set below 5 kΩ. Each TMS-EEG session included ~250 trials. Auditory EEG potentials evoked by the TMS clicks and bone conductance were minimized by diffusing a continuous white noise through earphones and applying a thin foam layer between the EEG cap and the TMS coil.
TMS-EEG data were pre-processed as previously described (50, 52) in Statistical Parametric Mapping 12 (SPM12, http://www.fil.ion.ucl.ac.uk/spm/) implemented in MATLAB2013a (The Mathworks Inc., Natick, MA, USA). In brief, TMS-EEG data underwent semi-automatic artefacts rejection, low-pass filtering at 80 Hz, downsampling to 1000 Hz, high-pass filtering at 1 Hz, splitting into epochs spanning -101 and 300 ms around TMS pulses, baseline correcting (from -101 to -1 ms pre-TMS), and robust averaging. Cortical excitability was defined as the slope at the inflexion point of the first component (0-35 ms) of the TMS-evoked EEG potential (TEP) measured on the artefact-free electrode closest to the target stimulation location. Median position of the closest artefactfree recording electrode was [X: -34; Y: -3.7; Z: 85.9, mm, Montreal Neurological Institute (MNI) space].
Quantitative multi-parametric acquisition and processing
All MRI acquisitions were performed on a 3-T scanner (MAGNETOM Prisma, Siemens). Structural and quantitative maps of T1, T2*, proton density (PD) and magnetization transfer (MT) with 1 mm isotropic resolution were computed based on a multi-parameter protocol including 3D multi-echo fast low angle shot (FLASH) sequence (57). Three co-localized 3D
multi-echo FLASH data sets were acquired with predominantly proton density weighting (PDw: TR/FA=23.7 ms/6°), T1 weighting (T1w: TR/FA=18.7 ms/20°), and MT weighting (MTw: TR/FA=23.7 ms/6°; excitation preceded by an off-resonance Gaussian MT pulse of 5 ms duration, 220° nominal flip angle, 2 kHz frequency offset) in a total acquisition time of approx. 19 min, with a voxel size of 1 mm³ isotropic. Two calibration sequences were acquired to correct for inhomogeneities in the radio frequency transmit field.
Quantitative multi-parametric maps (MT, PD, R1, R2*) were generated with the hMRI toolbox (58) (http://hmri.info) implemented in MATLAB2013a. First, MT and PD maps were segmented into grey, white, and CSF tissue class maps using Unified Segmentation (US) within SPM12 (59). Whole-brain segmentation outputs were diffeomorphically registered to a study-specific template, compatible with the MNI space, created using Shoot toolbox in SPM12 (60) in order to generate deformation fields that were used to warp MT and PD maps into the Shoot common-average space. Brainstem segmentation was then performed using US with brainstem sub-regions tissue probability maps that were generated according to previously described methods based on a modified multivariate mixture of Gaussians (61). Out of the four brainstem tissue classes produced, we considered only tissue class 1 which encompassed monoaminergic grey matter, including LC and raphe nuclei. Brainstem monoaminergic grey matter (bmGM) tissue was then warped back to individual space, using inverse deformation fields. Finally, bmGM tissue was binarized and applied as a mask on coregistered PET [18F]THK5351 for signal extraction, as described below.
PET acquisition and pre-processing
Tau/neuroinflammation and Aβ PET imaging were performed on an ECAT EXACT+ HR scanner (Siemens, Erlangen, Germany), with a 2 mm isotropic resolution. Tau/neuroinflammation PET imaging was performed with radiotracer [18F]THK5351 for all subjects. Aβ-PET imaging was achieved with radiotracer [18F]Flutemetamol for 61 subjects and
with [18F]Florbetapir for 3 subjects. For all PET imaging, participants received a single dose of
the respective radiotracer in an antecubital vein (target dose ~185 MBq). For tau/neuroinflammation-PET, a 10-minute transmission scan was first acquired, and dynamic image acquisitions started immediately after injection, consisting in 32 frames with increasing time duration (total time spent in scanner ~100 min.). For Aβ-PET, image acquisitions started 85 minutes after injection, and 4 frames of 5 minutes were obtained. All PET images were reconstructed using filtered back-projection algorithm including corrections for measured attenuation, dead time, random events, and scatter using standard software (ECAT 7.1, Siemens/CTI, Knoxville, TN, USA). For each individual, an average PET image was created using all frames for Aβ-PET, and the 4 frames corresponding to the time window between 40 and 60 min for tau/neuroinflammation-PET (62). Averaged PET images were manually reoriented and automatically coregistered to the structural MT map.
Standardized uptake value ratio (SUVR) was calculated using the cerebellum grey matter as the reference region for tau/neuroinflammation-PET (32), and the whole cerebellum for Aβ-PET (63). Given that we used 2 different radiotracers for Aβ-PET imaging, Aβ SUVR values were further scaled to centiloid units ((63–65). Subject-space bmGM mask was applied on [18F]THK5351 SUVR maps to retrieve mean tau/neuroinflammation burden. A region of interest comprising the earliest Aβ accumulation sites (stage 1 ROI) (7) was built based on bilateral regions from the automated anatomical labelling 2 (AAL2) atlas (66), including superior medial frontal, fusiform, and inferior temporal cortices, and was applied on the standardized Aβ maps.
Mean [18F]THK5351 SUVR was 1.43 ± 0.11 over the whole brain, and 1.97 ± 0.20 in the brainstem monoaminergic grey matter. Mean whole-brain Aβ centiloid value was 2.47 ± 9.92, and -5.31± 8.20 in the stage 1 ROI. The negative centiloid values in these earliest Aβ
accumulation sites were expected, as our sample comprises only healthy participants in late middle-age who were thoroughly screened for absence of many comorbidity factors.
While first generation tau protein radiotracers, including [18F]THK5351, have been widely studied and proved to have high affinity and selectivity in vitro (31), criticisms were raised about their off-binding to MAO-B in vivo, particularly over the basal ganglia (67). However, as investigated in a recent comparative analysis of first and second generation radiotracers, this off-target binding may be common to all first generation radiotracers and, to a lesser extent, also to second generation radiotracers (30). We therefore consider that
[18F]THK5351 uptake arises from about equal proportion of binding to both tau NFT and
MAO-B (31), and constitutes a marker of both tau and neuroinflammation burden.
Tau co-localization analysis
Spatial processing of PET images for voxel-based quantification (VBQ) analyses was achieved with the ‘standard pipeline’ module in hMRI toolbox. Whole-brain [18F]THK5351 SUVR maps
were diffeomorphically registered to the study-specific template using individual deformation fields, warped into the MNI space and tissue-specific smoothing (full width at half-maximum of 6 mm isotropic, separately for grey and white matter) was applied. VBQ analyses were carried out on these images in SPM12 in order to highlight brain regions which correlate with tau/neuroinflammation burden in the bmGM tissue. Statistical modelling consisted in a multiple linear regression model including four regressors (i.e. demographic variables of age, sex, education, and bmGM mean [18F]THK5351 SUVR). One-tailed t tests were used to identify voxels displaying increased [18F]THK5351 SUVR associated with higher values in the bmGM compartment. Statistical threshold was set at p < 0.05 after family-wise error (FWE) correction for multiple comparisons (pFWE-corrected) voxel-wise for the whole-brain. Grey matter and white
matter tissue classes were analyzed separately using explicit masks defining voxels belonging to each tissue class. These masks were generated using the across-subjects average of smoothed
Jacobian-modulated tissue probability maps in MNI space, with a minimum probability threshold of 20%, and voxels were assigned to the tissue class for which the probability was maximal. For both VBQ analyses, bmGM area was further masked to avoid redundancy.
Statistics
Statistical analyses were performed using Pearson’s correlations and Generalized Linear Mixed Models (GLMMs) in SAS 9.4 (SAS Institute, Cary, NC, USA). Pearson’s correlations were used as an assessment of potential association before computing GLMM which accounted for possible biases and covariate influences. Dependent variable distribution was first determined using ‘allfitdist’ function (developped by Mike Sheppard) in MATLAB2013a and GLMMs were adjusted accordingly. TMS-EEG stimulation parameters of applied electric field and distance between hotspot and recording electrode were included as covariates in GLMM statistical models with cortical excitability measures as dependent variables. All GLMMs were adjusted for demographic variables of age, sex and education. Subject (intercept) was included as a random factor. Degrees of freedom were estimated using Kenward-Roger’s correction. Statistical significance was set at p < .05. Semi-partial R² (R²β*) values were computed to
estimate the effect sizes of significant fixed effects and statistical trends in all GLMMs (68).
Study approval
This study was approved by the Ethics Committee of the Faculty of Medicine at the University of Liège, Belgium. Participants gave their written informed consent prior to inclusion in the study and received a financial compensation.
Author contributions: E.S., C.B., F.C., C.P., P.M., and G.V. designed the study. All authors helped in data acquisition, analysis, and interpretation. E.S., A.L., P.M., and C.P. provided administrative, technical, or material support. M.V.E. and G.V. wrote the paper. All authors contributed to manuscript revision.
Acknowledgements: We thank M. Blanpain, M. Cerasuolo, E. Lambot, P. Ghaemmaghami, C. Hagelstein, S. Laloux, E. Balteau, A. Claes, C. Degueldre, B. Herbillon, P. Hawotte, B. Lauricella, A. Lesoine, X. Pepin, E. Tezel, and P. Villar González for their help in different steps of the study. This work was supported by Fonds National de la Recherche Scientifique (FRS-FNRS, FRSM 3.4516.11, Belgium), Actions de Recherche Concertées (ARC SLEEPDEM 17/27-09) of the Fédération Wallonie-Bruxelles, University of Liège (ULiège), Fondation Simone et Pierre Clerdent, European Regional Development Fund (ERDF, Radiomed Project). [18F]Flutemetamol doses were provided and cost covered by GE Healthcare
Ltd (Little Chalfont, UK) as part of an investigator sponsored study (ISS290) agreement. This agreement had no influence on the protocol and results of the study reported here. M.V.E., C.S., C.B., F.C., C.P., and G.V. are/were supported by the FNRS-Belgium. Data and materials supporting this paper are openly available at the following Open Science Framework repository: https://osf.io/cafsd/. Unprocessed PET data are available upon request to the corresponding author.
References
1. Jack CR et al. NIA-AA Research Framework: Toward a biological definition of Alzheimer’s disease. Alzheimer’s Dement. 2018;14(4):535–562.
2. Braak H, Tredici K Del. Neuroanatomy and Pathology of Sporadic Parkinson’s Disease. Berlin, Heidelberg: Springer Berlin Heidelberg; 2015:
3. Braak H, Thal DR, Ghebremedhin E, Del Tredici K. Stages of the pathologic process in alzheimer disease: Age categories from 1 to 100 years. J. Neuropathol. Exp. Neurol. 2011;70(11):960–969.
4. Braak H, Del Tredici K. The pathological process underlying Alzheimer’s disease in individuals under thirty. Acta Neuropathol. 2011;121(2):171–181.
5. Ehrenberg AJ et al. Quantifying the accretion of hyperphosphorylated tau in the locus coeruleus and dorsal raphe nucleus : the pathological building blocks of early Alzheimer ’ s disease2017;43:393–408.
6. Braak H, Del Tredici K. The preclinical phase of the pathological process underlying sporadic Alzheimer’s disease. Brain 2015;138(10):2814–2833.
7. Grothe MJ et al. In vivo staging of regional amyloid deposition. Neurology 2017;89(20):2031–2038.
8. Tracy TE, Gan L. Tau-mediated synaptic and neuronal dysfunction in neurodegenerative disease. Curr. Opin. Neurobiol. 2018;51:134–138.
9. D’Amelio M, Rossini PM. Brain excitability and connectivity of neuronal assemblies in Alzheimer’s disease: From animal models to human findings. Prog. Neurobiol.
2012;99(1):42–60.
10. Olazarán J, Prieto J, Cruz I, Esteban A. Cortical excitability in very mild Alzheimer’s disease: A long-term follow-up study. J. Neurol. 2010;257(12):2078–2085.
stimulation follow-up study. Neurosci. Lett. 2011;492(2):94–98.
12. Casarotto S et al. Transcranial magnetic stimulation-evoked EEG/cortical potentials in physiological and pathological aging. Neuroreport 2011;22(12):592–597.
13. Trebbastoni A et al. Altered cortical synaptic plasticity in response to 5-Hz repetitive transcranial magnetic stimulation as a new electrophysiological finding in amnestic mild cognitive impairment converting to Alzheimer’s disease: Results from a 4-year prospective cohort s. Front. Aging Neurosci. 2016;7(JAN):1–10.
14. Yamada K et al. Neuronal activity regulates extracellular tau in vivo. J. Exp. Med. 2014;211(3):387–393.
15. Bero AW et al. Neuronal activity regulates the regional vulnerability to amyloid-ß deposition. Nat. Neurosci. 2011;14(6):750–756.
16. Holth JK et al. The sleep-wake cycle regulates brain interstitial fluid tau in mice and CSF tau in humans. Science. [published online ahead of print: 2019];(10.1126/science. aav2546). doi:10.1126/science. aav2546
17. Ooms SJ et al. Effect of 1 night of total sleep deprivation on cerebrospinal fluid ß-amyloid 42 in healthy middle-aged men: A randomized clinical trial. JAMA Neurol. 2014;71(8):971–977.
18. Herring A et al. Amyloid-β dimers in the absence of plaque pathology impair learning and synaptic plasticity.. Brain 2015;139(2015):1–17.
19. Bellucci A et al. Induction of inflammatory mediators and microglial activation in mice transgenic for mutant human P301S tau protein. Am. J. Pathol. 2004;165(5):1643–1652. 20. Laurent C, Buée L, Blum D. Tau and neuroinflammation: What impact for Alzheimer’s Disease and Tauopathies?. Biomed. J. 2018;41(1):21–33.
21. De Calignon A et al. Propagation of Tau Pathology in a Model of Early Alzheimer’s Disease. Neuron 2012;73(4):685–697.
22. Asai H et al. Depletion of microglia and inhibition of exosome synthesis halt tau propagation. Nat. Neurosci. 2015;18(11):1584–1593.
23. Maphis N et al. Reactive microglia drive tau pathology and contribute to the spreading of pathological tau in the brain. Brain 2015;138(6):1738–1755.
24. Holth JK et al. Tau Loss Attenuates Neuronal Network Hyperexcitability in Mouse and Drosophila Genetic Models of Epilepsy. J. Neurosci. 2013;33(4):1651–1659.
25. Hall AM et al. Tau-Dependent Kv4.2 Depletion and Dendritic Hyperexcitability in a Mouse Model of Alzheimer’s Disease. J. Neurosci. 2015;35(15):6221–6230.
26. Schultz MK et al. Pharmacogenetic neuronal stimulation increases human tau pathology and trans-synaptic spread of tau to distal brain regions in mice. Neurobiol. Dis.
2018;118(June):161–176.
27. Pasquini L et al. Medial Temporal Lobe Disconnection and Hyperexcitability Across Alzheimer’s Disease Stages. J. Alzheimer’s Dis. Reports 2019;3(1):103–112.
28. Jagust W. Imaging the evolution and pathophysiology of Alzheimer disease. Nat. Rev.
Neurosci. 2018;19(11):687–700.
29. Harada R et al. Correlations of 18 F-THK5351 PET with post-mortem burden of tau and astrogliosis in Alzheimer’s disease. J. Nucl. Med. 2017;59(4):jnumed.117.197426.
30. Murugan NA et al. Cross-interaction of tau PET tracers with monoamine oxidase B: evidence from in silico modelling and in vivo imaging. Eur. J. Nucl. Med. Mol. Imaging 2019;1369–1382.
31. Lemoine L et al. Comparative binding properties of the tau PET tracers THK5117, THK5351, PBB3, and T807 in postmortem Alzheimer brains. Alzheimer’s Res. Ther. 2017;9(1):1–13.
32. Ishiki A et al. Neuroimaging-pathological correlations of [18F]THK5351 PET in progressive supranuclear palsy. Acta Neuropathol. Commun. 2018;6(1):53.
33. Heneka MT et al. Locus ceruleus controls Alzheimer’s disease pathology by modulating microglial functions through norepinephrine. Proc. Natl. Acad. Sci. U. S. A.
2010;107(13):6058–6063.
34. Satoh A, Iijima KM. Roles of tau pathology in the locus coeruleus (LC) in age-associated pathophysiology and Alzheimer’s disease pathogenesis: Potential strategies to protect the LC against aging. Brain Res. 2019;1702:17–28.
35. Mueller A et al. Tau PET imaging with 18F-PI-2620 in Patients with Alzheimer Disease and Healthy Controls: A First-in-Humans Study. J. Nucl. Med. 2020;61(6):911–919.
36. Leuzy A et al. Diagnostic Performance of RO948 F 18 Tau Positron Emission Tomography in the Differentiation of Alzheimer Disease from Other Neurodegenerative Disorders. JAMA Neurol. 2020;1–12.
37. Schöll M et al. Biomarkers for tau pathology. Mol. Cell. Neurosci. 2019;97(October 2018):18–33.
38. de Haan W, van Straaten ECW, Gouw AA, Stam CJ. Altering neuronal excitability to preserve network connectivity in a computational model of Alzheimer’s disease. PLoS
Comput. Biol. 2017;13(9):1–23.
39. Palop JJ, Mucke L. Amyloid-β–induced neuronal dysfunction in Alzheimer’s disease: from synapses toward neural networks. Nat. Neurosci. 2010;13(7):812–818.
40. Kellner V, Menkes-Caspi N, Beker S, Stern EA. Amyloid-β alters ongoing neuronal activity and excitability in the frontal cortex. Neurobiol. Aging 2014;35(9):1982–1991. 41. Clewett D V. et al. Neuromelanin marks the spot: identifying a locus coeruleus biomarker of cognitive reserve in healthy aging. Neurobiol. Aging 2016;37:117–126.
42. Roberson ED et al. Reducing endogenous tau ameliorates amyloid beta-induced deficits in an Alzheimer’s disease mouse model. Science. 2007;316(5825):750–754.
Neurosci. 2013;33(31):12887–12897.
44. Busche MA et al. Decreased amyloid-β and increased neuronal hyperactivity by immunotherapy in Alzheimer’s models. Nat. Neurosci. 2015;18(12):1725–1727.
45. Koffie RM, Hyman BT, Spires-Jones TL. Alzheimer’s disease: synapses gone cold.. Mol.
Neurodegener. 2011;6(1):63.
46. Mucke L, Selkoe DJ. Neurotoxicity of amyloid β-protein: synaptic and network dysfunction.. Cold Spring Harb. Perspect. Med. 2012;2(7):a006338.
47. Crimins JL, Rocher AB, Luebke JI. Electrophysiological changes precede morphological changes to frontal cortical pyramidal neurons in the rTg4510 mouse model of progressive tauopathy. Acta Neuropathol. 2012;124(6):777–795.
48. Andrews-Zwilling Y et al. Apolipoprotein E4 Causes Age- and Tau-Dependent
Impairment of GABAergic Interneurons, Leading to Learning and Memory Deficits in Mice.
J. Neurosci. 2010;30(41):13707–13717.
49. Huber R et al. Human cortical excitability increases with time awake. Cereb. Cortex 2013;23(2):332–338.
50. Ly JQM et al. Circadian regulation of human cortical excitability. Nat. Commun. 2016;7(May):11828.
51. Van Egroo M et al. Preserved wake-dependent cortical excitability dynamics predict cognitive fitness beyond age-related brain alterations. Commun. Biol. 2019;2(1):449.
52. Gaggioni G et al. Age-related decrease in cortical excitability circadian variations during sleep loss and its links with cognition. Neurobiol. Aging 2019;78:52–63.
53. Mattis S. Mental status examination for organic mental syndrome in the elderly patients. In: Bellak L, Karasu T eds. Geriatric psychiatry: A handbook for psychiatrists and primary
care physicians. New York: 1976:77–121
Psychometric properties.. J. Consult. Clin. Psychol. 1988;56(6):893–897.
55. Beck AT, Steer RA, G. GM. Psychometric Properties of the Beck Depression Inventory: Twenty-five years of evaluation. Clin. Psychol. Rev. 1988;8:77–100.
56. Virtanen J, Ruohonen J, Näätänen R, Ilmoniemi RJ. Instrumentation for the measurement of electric brain responses to transcranial magnetic stimulation. Med. Biol. Eng. Comput. 1999;37(3):322–326.
57. Weiskopf N, Helms G. Multi-parameter mapping of the human brain at 1mm resolution in less than 20 minutes. Proceeding Int. Soc. Magetic Reson. Med. 2008;16:2241.
58. Tabelow K et al. hMRI - A toolbox for quantitative MRI in neuroscience and clinical research.. Neuroimage 2019;194(September 2018):191–210.
59. Ashburner J, Friston KJ. Unified segmentation. Neuroimage 2005;26(3):839–851. 60. Ashburner J, Friston KJ. Diffeomorphic registration using geodesic shooting and Gauss-Newton optimisation. Neuroimage 2011;55(3):954–967.
61. Lambert C, Lutti A, Helms G, Frackowiak RSJ, Ashburner J. Multiparametric brainstem segmentation using a modified multivariate mixture of Gaussians. NeuroImage Clin.
2013;2(1):684–694.
62. Lockhart SN et al. Dynamic PET measures of tau accumulation in cognitively normal older adults and Alzheimer’s disease patients measured using [18F] THK-5351. PLoS One 2016;11(6):1–16.
63. Klunk WE et al. The Centiloid project: Standardizing quantitative amyloid plaque estimation by PET. Alzheimer’s Dement. 2015;11(1):1-15.e4.
64. Battle MR et al. Centiloid scaling for quantification of brain amyloid with
[18F]flutemetamol using multiple processing methods. EJNMMI Res. 2018;8(1):107. 65. Navitsky M et al. Standardization of amyloid quantitation with florbetapir standardized uptake value ratios to the Centiloid scale. Alzheimer’s Dement. 2018;14(12):1565–1571.
66. Tzourio-Mazoyer N et al. Automated anatomical labeling of activations in SPM using a macroscopic anatomical parcellation of the MNI MRI single-subject brain. Neuroimage 2002;15(1):273–289.
67. Chiotis K et al. Dual tracer tau PET imaging reveals different molecular targets for 11C-THK5351 and 11C-PBB3 in the Alzheimer brain. Eur. J. Nucl. Med. Mol. Imaging
2018;45(9):1605–1617.
68. Jaeger BC, Edwards LJ, Das K, Sen PK. An R2statistic for fixed effects in the generalized linear mixed model. J. Appl. Stat. 2017;44(6):1086–1105.
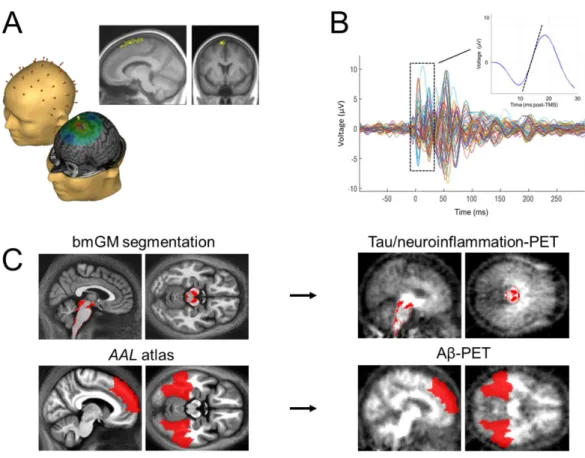
Figures and figure legends
Figure 1. Cortical excitability assessment and PET values extraction in early deposition sites. (A) Cortical excitability over the frontal cortex was assessed using neuronavigation-based TMS coupled to EEG. TMS-EEG target area was located in the superior frontal gyrus. Darker and brighter yellow areas represent the range of stimulation targets across participants projected onto the averaged normalized T1 structural volume and the median TMS-EEG stimulation hotspot over the sample, respectively. (B) Butterfly plot of TMS-evoked EEG response over the 60 electrodes (-100 ms pre-TMS to 300 ms post-TMS; average of ~250 trials). Cortical excitability was computed as the slope (µV/ms, dotted line on inset) of the first component of the TEP response at the electrode closest to the stimulation hotspot. (C) Automatic brainstem segmentation methods were used to extract [18F]THK5351 SUVR in the
brainstem monoaminergic grey matter (bmGM; top row). Aβ burden ([18F]Flutemetamol or [18F]Florbetapir centiloid units) was extracted in the earliest aggregation sites (7) using bilateral
Figure 2. Associations between cortical excitability and early [18F]THK5351 PET signal as
well as Aβ burden. (A) Significant and positive association between cortical excitability values and mean [18F]THK5351 standardized uptake value ratio (SUVR) in the brainstem monoaminergic grey matter (bmGM; Pearson’s correlation: r = .29, p = .02; GLMM: F1,57 =
4.76, p = .03, R²β* = 0.08). (B) No significant association between cortical excitability and mean [18F]Flutemetamol/[18F]Florbetapir (centiloid units) in a region-of-interest covering the earliest
Aβ aggregation sites (Pearson’s correlation: r = -.20; p = .11; GLMM: F1,57 = 1.41, p = .24).
Simple regressions are displayed and full GLMMs outputs are reported in Table 2. Dotted lines represent 95% confidence interval for these simple regressions.
Figure 3. [18F]THK5351 regional correlates of brainstem [18F]THK5351 uptake, and
association between cortical excitability and mean MTL [18F]THK5351 SUVR. (A) VBQ
analyses revealed that mean [18F]THK5351 SUVR in the brainstem monoaminergic grey matter (bmGM) region was positively correlated to grey matter [18F]THK5351 PET signal within most
of the medial temporal lobe (MTL, pFWE-corrected < .001). (B) VBQ analyses further showed that
mean [18F]THK5351 SUVR in the bmGM region was positively associated with [18F]THK5351 SUVR in the white matter tracts connecting the brainstem to the MTL, but also in widespread projections towards the whole cortex (pFWE-corrected < .001). (C) Paired t-test analysis showed
that mean [18F]THK5351 SUVR in the bmGM was significantly lower than in the MTL (t =
10.14, p < .0001). (D) Average [18F]THK5351 SUVR in the MTL was, however, not significantly associated with cortical excitability values (Pearson’s correlation: r = .14, p = .25; GLMM: F1,57 = 1.89, p = .17). Simple regression is displayed and full GLMM outputs are
Tables
Table 1. Sample characteristics (mean ± SD).
N = 64 Sex 45F/19M Age (years) 59.7 ± 5.5 Education (years) 15.3 ± 3.1 Right-handed (%) 97 Ethnicity Caucasian
Dementia Rating Scale 142.3 ± 2
Body mass index (Kg/m²) 24.5 ± 2.8
Whole-brain [18F]THK5351 (SUVR) 1.31 ± 0.09
Brainstem monoaminergic grey matter [18F]THK5351 (SUVR) 1.98 ± 0.20
Hippocampal/entorhinal cortex [18F]THK5351 (SUVR) 2.11 ± 0.18 Whole-brain [18F]Flutemetamol/[18F]Florbetapir (Centiloid value) 2.47 ± 9.92 Stage 1 region-of-interest [18F]Flutemetamol/[18F]Florbetapir (Centiloid value) -5.31± 8.20
TMS-evoked cortical excitability (µV/ms) 1.09 ± 0.48
TMS applied electric field (V/m²) 114.7 ± 15
Recording electrode distance from TMS hotspot (mm) 45.4 ± 10.5 F = female; M = male; SUVR= standardized uptake value ratio. Stage 1 refers to the earliest Aβ aggregation sites (7) (see methods).
Table 2. GLMM outputs of the associations between cortical excitability values and mean
[18F]THK5351 SUVR in the brainstem monoaminergic grey matter (bmGM, model 1),
mean Aβ in the stage 1 ROI (model 2), and both considered together (model 3).
In all models, TEP slope was used as the dependent variable as a measure of cortical excitability. R²β* values correspond to semi-partial R² in GLMMs, and are reported for all
significant associations.
Model 1 Model 2 Model 3
Mean bmGM [18F]THK5351 SUVR F1,57 = 4.76 p = 0.03 R²β* = 0.08 F1,56 = 5.78 p = 0.02 R²β* = 0.09
Mean stage 1 Aβ burden F1,57 = 1.41 p = 0.24 F1,56 = 2.43 p = 0.12 Age F1,57 = 2.59 p = 0.11 F1,58 = 1.62 p = 0.21 F1,56 = 1.27 p = 0.26 Sex F1,57 = 0.02 p = 0.88 F1,57 = 0.37 p = 0.54 F1,56 = 0.01 p = 0.94 Education F1,57 = 3.04 p = 0.09 F1,57 = 1.38 p = 0.25 F1,56 = 2.56 p = 0.11 Electric field F1,57 = 1.50 p = 0.23 F1,57 = 0.74 p = 0.39 F1,56 = 1.36 p = 0.25
Recording electrode distance F1,57 = 3.62
p = 0.06
F1,57 = 3.30 p = 0.07
F1,56 = 3.35 p = 0.07
Table 3. Statistical outputs of VBQ grey matter analysis seeking for correlation between brainstem monoaminergic grey matter region [18F]THK5351 uptake and [18F]THK5351
SUVR in the rest of the brain grey matter, after adjusting for age, sex, and education.
Voxel size = 2 mm³; Degrees of freedom = [1,59]. % Cluster refers to the proportion of cluster voxels that are assigned to the corresponding anatomical localization label. Given the extent of the first significant cluster, only the major localization labels are reported.
Cluster extent (voxels)
Peak coordinates (XYZ, mm)
pFWE-corrected
(cluster level) Localization label % Cluster
12743 2 -16 -16 < .001 Left hippocampus 6.27 Left thalamus 6.24 Right parahippocampus 5.85 Right hippocampus 5.75 Right thalamus 5.72 Right putamen 5.65 Left parahippocampus 4.87 Left putamen 3.37 Right caudate 3.23
151 2 20 22 < .001 Right anterior cingulum 60.26 Left anterior cingulum 39.74 104 -2 -26 30 < .001 Left posterior cingulum 30.77 Right posterior cingulum 16.35 Left middle cingulum 15.38 Right middle cingulum 13.46 89 -38 -36 18 < .001 Left Rolandic operculum 40.45 Left superior temporal 38.20
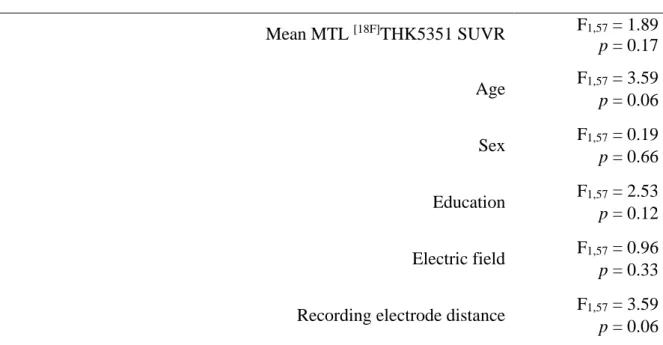
Table 4. GLMM outputs of the associations between cortical excitability values and mean
[18F]THK5351 SUVR in the medial temporal lobe (MTL).
TEP slope was used as the dependent variable as a measure of cortical excitability.
Mean MTL [18F]THK5351 SUVR F1,57 = 1.89 p = 0.17 Age F1,57 = 3.59 p = 0.06 Sex F1,57 = 0.19 p = 0.66 Education F1,57 = 2.53 p = 0.12 Electric field F1,57 = 0.96 p = 0.33
Recording electrode distance F1,57 = 3.59
![Figure 2. Associations between cortical excitability and early [18F] THK5351 PET signal as well as Aβ burden](https://thumb-eu.123doks.com/thumbv2/123doknet/6821735.189962/32.892.76.825.91.415/figure-associations-cortical-excitability-early-thk-signal-burden.webp)
![Figure 3. [18F] THK5351 regional correlates of brainstem [18F] THK5351 uptake, and association between cortical excitability and mean MTL [18F] THK5351 SUVR](https://thumb-eu.123doks.com/thumbv2/123doknet/6821735.189962/33.892.119.788.74.571/figure-regional-correlates-brainstem-uptake-association-cortical-excitability.webp)
![Table 3. Statistical outputs of VBQ grey matter analysis seeking for correlation between brainstem monoaminergic grey matter region [18F] THK5351 uptake and [18F] THK5351 SUVR in the rest of the brain grey matter, after adjusting for age, sex, an](https://thumb-eu.123doks.com/thumbv2/123doknet/6821735.189962/36.892.115.812.288.905/statistical-outputs-analysis-seeking-correlation-brainstem-monoaminergic-adjusting.webp)