Master Thesis
Are infrastructure assets experiencing a case of
overvaluation, and can the asset class as a whole
continue to deliver adequate risk-adjusted returns?
Analysis of the current valuation of infrastructure assets
Written by
Safaa BERKIA
Angelica (Ching) LOZEVIS
Grande Ecole – Majeure Finance
Under the supervision of
Patrick Legland
Affiliate Professor in Finance at HEC Paris
Table of Contents
Acknowledgements ... 7
Abstract ... 8
Introduction ... 9
Chapter I: Overview of the infrastructure industry ... 10
1. Infrastructure as an Asset Class ... 10
1.1 Defining Infrastructure ... 10
1.2 Asset Characteristics ... 10
1.3 Classification of Infrastructure... 11
2. Risk-return profiles of infrastructure investments ... 13
2.1 Risk-return spectrum ... 13
2.2 Target Returns ... 15
3. Infrastructure investments ... 16
3.1 Private Sector Involvement in Infrastructure ... 16
3.2 Infrastructure gap ... 17
3.3 Investment vehicles ... 18
4. Performance of infrastructure investments ... 20
4.1 Yield-driven versus IRR-driven investors ... 20
4.2 Lack of data for unlisted infrastructure ... 20
4.3 Structuring a benchmark ... 20
4.4 Listed versus unlisted infrastructure ... 22
Chapter II: Appetite for infrastructure assets ... 4
1. Deal flow within the infrastructure asset class ... 4
2. Evolution of the investors universe ... 7
2.1 Assets under Management (AuM) and Dry Powder ... 7
2.2 Investors’ allocations to Infrastructure ... 8
2.3 Access to the Infrastructure Market ... 11
2.4 Reasons for the increasing interest on infrastructure assets ... 11
3. Availability of funds ... 18
3.1 Fundraising ... 18
3.2 Infrastructure debt ... 20
Chapter III: Assessing the performance and valuation of infrastructure assets ... 23
1. Listed infrastructure performance ... 23
1.1 The performance of infrastructure stocks ... 23
1.2 Trading benchmark ... 26
2. Airports economics ... 29
2.1 Airports characteristics ... 29
2.2 Private Sector Involvement in airports transactions... 30
3. Valuation of airports ... 31
3.1 Overview of valuation practices in the sector ... 31
3.2 The increasing appetite for airports deals ... 33
3.3 Airports as trophy assets: Example of recent transactions ... 35
4. The drivers of airports’ valuation ... 36
4.1 Analytical consideration of the main value drivers... 36
4.2 Potential explanations for the current pricing (general to infrastructure assets) ... 44
Acronyms ... 51 References ... 52
Index
Figures
Figure 1.1: Risk & Return across the infrastructure spectrum
Figure 1.2: Value of privatization infrastructure transactions, 1990-2006 Figure 1.3: Matrix of most common forms of infrastructure investment
Figure 1.4: Historical Returns vs. Global Equities and Bonds (cumulative, USD) Figure 1.5: Rolling 12-month returns from listed and unlisted Australian infrastructure
Figure 2.1: Number and Aggregate Value of Infrastructure Deals Completed Globally, 2009-2016 Figure 2.2: Average Annual Infrastructure Deal Size, 2009-2016
Figure 2.3: Infrastructure Deals by Transaction Value, 2009-2016 Figure 2.4: Infrastructure Deals by Region, 2009-2016
Figure 2.5: Infrastructure Deals by Industry, 2009-2016
Figure 2.6: Number of Private Asset Transactions by Industry, All Time
Figure 2.7: Global Infrastructure Volumes by Project Stage, 2014 - 2016 (USDm) Figure 2.8: Unlisted infrastructure AuM (Dec, 2004-Jun, 2015)
Figure 2.9: Unlisted infrastructure dry-powder by primary geographic focus (Dec, 2003-Dec, 2015) Figure 2.10: Average allocation to infrastructure as % of AuM (Dec, 2011-Dec, 2015)
Figure 2.11: Average allocation to infrastructure by type of investor Figure 2.12: Breakdown of institutional investors by investor's type Figure 2.13: Favourite routes to infrastructure investments
Figure 2.14: Correlation of listed and unlisted infrastructure with the MSCI World (2002–2008) Figure 2.15: Resilience of infrastructure assets to economic cycles
Figure 2.16: Effect of infrastructure allocation on expected return & estimated Sharp ratio of a portfolio
Figure 2.17: Yield to maturity on 10-year treasuries Figure 2.18: Increase in core infrastructure values
Figure 2.19: Annual capital called & distributed by unlisted infrastructure funds Figure 2.20: Global annual unlisted infrastructure fundraising
Figure 2.21: Breakdown by primary geographic focus of unlisted infrastructure funds closed in 2015 Figure 2.22: Annual unlisted infrastructure debt fundraising
Figure 2.24: Liquidity premium of infrastructure debt
Figure 3.1: Share price performance for infrastructure sectors (2008-2017) Figure 3.2: Infrastructure index performance (2003-2015; Base= 2015) Figure 3.3: LTM EBITDA Multiples of major airports (2006-2016)
Figure 3.4: LTM EBITDA Multiples of major conglomerates in the infrastructure sector (2006-2016) Figure 3.5: European infrastructure dividend yield vs. blended 10-year sovereign yields (2011-2016) Figure 3.6: Listed infrastructure dividend growth per share vs. CPI (2006-2015)
Figure 3.7: Weighted average EV/EBITDA multiple post and pre-crisis (2005-2014) Figure 3.8: EBITDA Multiple for selected airports transactions (2010-2016)
Figure 3.9: Regression analysis, EV/EBITDA multiple vs. Passenger CAGR (2008-2016) Figure 3.10: EBITDA Multiple for selected airports transactions (2010-2016)
Figure 3.11: Representation value of lease extension
Figure 3.12: Regression analysis, EV/EBITDA vs. remaining concession life
Figure 3.13: Regression analysis, EV/EBITDA vs. CAGR of non-aeronautical revenues Figure 3.14: Regression analysis, EV/EBITDA vs. EBITDA margin
Figure 3.15: Sector leverage - ND/EBITDA
Figure 3.16: Evolution of historical WACC and Beta
Tables
Table 1.2: Illustrative Returns for Core Infrastructure Assets Table 1.3: Main infrastructure benchmarks
Table 1.4: Characteristics of listed and unlisted infrastructure Table 1.5: Return and volatility of listed vs. unlisted funds Table 2.1: Inter-asset correlation matrix (Q3-1995; Q2-2006) Table 2.2: Cross sector correlation matric (2000-2012)
Table 2.3: Infrastructure return correlation with other asset classes over 10 years Table 2.4: Infrastructure inter-asset correlation matrix (2001-2013)
Table 2.5: Impact of different allocations to an existing portfolio
Table 2.6: Illustration to returns and risks for some typical infrastructure assets Table 2.7: Notable unlisted infrastructure funds to close in 2016/Q1-2017
Table 3.1: Benchmark of the impact of macroeconomic environments on listed infrastructure stocks Table 3.2: Airports privatization models
Acknowledgements
We would like to acknowledge and thank Professor Legland for his aide in the development of our master thesis and for supervising our work. We would also like to extend our gratitude to our professors Aurelien Roelens and Richard Bruyère – both industry specialists, for contributing their expertise, resources and general guidance in the realization of this research.
Abstract
Emerging from privatization programs in the United Kingdom and Australia in the 1980s, infrastructure assets has gained significant prominence as an investment opportunity, with governments across the world turning towards infrastructure and private sector investment to increase productivity and growth of their respective economies. Investors who have allocated capital to infrastructure since the onset have done well, leading to strong traction sourced from institutional investors in search of low-risk investment opportunities in the current economic context. Valuations have, overall, continued to move upward, buoyed by capital inflows and historically low-interest rates, among other value drivers. However, continued increase in valuations begs the question: is infrastructure now overvalued (meaning that the IRR does not compensate for the risks embedded in the assets or in the financial structure) or justified? The aim of this research paper is to begin by understanding infrastructure as an asset class, in order to analyze the drivers behind their rising valuations, to ultimately determine whether infrastructure assets are currently in fact overvalued and moving into a bubble-like territory, or indeed their values are rationally justified.
Introduction
Infrastructure is key to economic growth as well as social development – however, there is strong evidence that an ‘infrastructure gap’ exists in both the developed and developing world. Politicians around the world have responded to this pressure by promising new major improvements – with the Trump administration pledging $1 trillion of investment in roads, bridges, schools, and hospitals – to be largely funded through tax-incentivized private capital. Such commitments are mirrored around the world, with Theresa May’s new UK administration sponsoring high-value investment into “infrastructure and innovation to boost productivity”, Angela Merkel pledging to raise spending on roads, railways, and broadband with “no new debts”, and the Chinese government setting aggressive targets to improve many key infrastructure sectors between now and 2020 (PwC).
This is coupled with a global desire to invest into infrastructure – significant amounts of capital have been made available by pension, insurance and sovereign wealth funds and, as a consequence, many owners of infrastructure assets – government and private alike – have taken advantage of the sharp rise in asset values by putting assets up for sale (PwC). As such, much of the world’s infrastructure increasingly now rests in the hands of specialist private investors who have inherited it through acquisitions from governments in the form of take-private transactions (PwC). This trend of high investor appetite for private infrastructure continues to lead to record high valuations in core infrastructure segments. Investors justify paying these high valuations by praising the quality of the underlying assets and the long-term nature of infrastructure investment, a compelling argument in the continuous, low-yield environment (Lowe). However, with EBITDA multiples and debt-to-EBITDA multiples in recent deals reaching new highs, it is clear that as a result of rampant demand, the infrastructure sector may be in danger of suffering from a dual curse of overvaluation and excessive leverage – the classic symptoms of an asset bubble similar to the dot-com era. Taking to heart the following famous saying: “those who cannot remember the past are condemned to repeat it”, we believe that understanding the performance and value drivers in infrastructure in the current macroeconomic context is essential to evaluate whether the infrastructure is overvalued or warranted. The paper is structured as follows: Chapter 1 provides an overview of infrastructure as an asset class and its classification. Given the wide spectrum of investment opportunities, this chapter will also touch on the different risk/return profiles within the asset class, as well as the types of investment vehicles used to gain exposure to infrastructure. Chapter 2 focuses on the investor’s standpoint, providing an overview of deal flow over the last few years, followed by an analysis on the appetite for infrastructure, from both a demand and supply perspective. Finally, Chapter 3 dives into the problematics of current infrastructure valuation, first by evaluating the performance of the asset class, followed by an analysis focused on airports, a sub-sector we deemed to be a prime target of overvaluation. This analysis with allow us to draw conclusions on our initial question: is infrastructure now overvalued or justified?
Chapter I: Overview of the infrastructure industry
1. Infrastructure as an Asset Class
Is infrastructure a type of financial asset? Over the past decade, infrastructure investments have been increasing in size and popularity, but this investment area remains relatively under-researched. While there is consensus that infrastructure is a relatively young industry compared with private equity and real estate, it is nevertheless possible to determine certain distinctive characteristics that establish its risk-return profile as an asset class and the corresponding attractiveness for investors.
1.1 Defining Infrastructure
The term ‘infrastructure’ typically refers to the structures that support a society, such as roads, bridges, water supply, sewers, electrical grids, telecommunications, and so forth, and can be defined as ‘the physical components of interrelated systems providing commodities and services essential to enable, sustain, or enhance societal living conditions’ (Fulmer). This remains a very broad and inclusive definition. From an investment standpoint, infrastructure can be defined as long-standing asset-based businesses that provide essential services, are generally costly and difficult to replace, that typically generate relatively stable cash flows that may be indexed to inflation, and incorporate many product types across geographic locations.
1.2 Asset Characteristics
As per its definition, infrastructure encompasses highly heterogeneous assets that can be categorized into several sub-sectors. However, the key factor for an investor is ultimately not the specific sector, but rather the asset’s risk-return profile. This largely depends on the distinctive characteristics of the investment opportunity in question; as such, infrastructure can also be defined through the following economic and financial characteristics which are believed to be inherent to the asset class:
● Public service: Infrastructure assets provide essential services that support the functioning of society and the economy, such as the provision of water, energy, mobility, communications, education, security, culture or healthcare, making them a basic prerequisite for economic growth, prosperity and quality of life (Weber, 11).
● Inelastic demand: Owing to its indispensable nature, infrastructure assets enjoy a demand pattern that is relatively independent of macroeconomic cycles, even when prices increase (e.g. owing to inflation adjustment regulations). The demand for their services tend to be stable (i.e. subject to low volatility), generally predictable (e.g. due to long-term contracts) and consequently resilient to economic fluctuations (Weber, 11).
investments which act as a strong barrier to entry that deters potential entrants from entering the market profitably. This generally translates into little or no competition. Thus, infrastructure assets enjoy a natural monopolistic or “quasi-monopolistic” market positioning (Deutsche).
● Regulation: Given its monopolistic advantage coupled with the essential nature of the underlying service, infrastructure assets can be subject to a high degree of regulation that inhibits them from exerting their monopoly power to charge users’ excessive prices (Deutsche).
● Inflation protection: Infrastructure assets may provide a natural hedge against inflation because its revenues are often linked with an inflation-adjustment mechanism, such as inflation-indexed user tariffs, guaranteed yields, or any other form of contractual guarantees. Project income generated via user charges (e.g. toll roads, public utility plants) rather than availability payments is usually tied to GDP or the consumer price index (Weber, 12). However, it is important to note that for unregulated assets, full hedging may not always be possible.
● Long Duration: Infrastructure assets tend to be long-lived, often with service lives lasting over 100 years. When matched with appropriate commercial and/or regulatory environments, infrastructure investments can provide the preceding characteristics over a relatively long time horizon (RREEF)
● Long-term cash flow predictability: Infrastructure assets that possess the characteristics listed above generally have stable, predictable and in most cases inflation-adjusted long-term revenues that can survive economic downturns and cycles and support a significant credit burden (Weber, 12). The economic cycle can have more impact on unregulated services, such as airports and seaports, though the essential nature of such services mitigates this risk. As a rule of thumb when looking at different infrastructure asset types, the stronger and more predictable the regulation and contractual framework is for a certain asset, the lower its sensitivity to the economic context and the more stable its cash flows over the long-term. Given the diversity and heterogeneity of infrastructure assets, these characteristics serve merely as a reference for potential features of an infrastructure investment. It is important to note that not all infrastructure assets will conform strictly to these characteristics. In fact, most will only meet them in part, nevertheless, they will still be considered as an infrastructure asset.
1.3 Classification of Infrastructure
Infrastructure assets can be classified according to various dimensions that are not mutually exclusive. The most common approach is in functional terms, that is, based on the uses of the facilities and the services provided by the underlying asset. Other classification approaches include the stage of asset
development, and as well based on the market conditions in which the asset is located. Overall, a distinct infrastructure opportunity needs to draw on the different elements in order to provide a relevant analysis. For example, a new social project in a mature market is very different from the privatization of an established economic project in an emerging market.
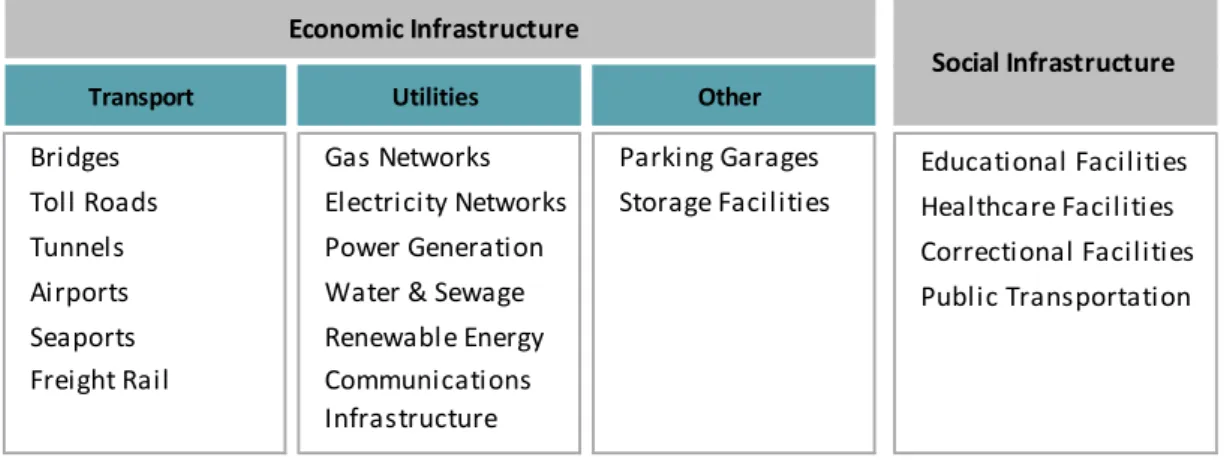
Economic and Social Infrastructure
Infrastructure assets are often divided according to the nature of the underlying service it provides: between economic and social infrastructure. Economic infrastructure assets are typically involved in the transportation and circulation of goods and essential commodities, as well as people and information. Social infrastructure assets provide structures for services society needs, including hospitals, schools, and other government buildings (Af2i & JPM).
Table 1.1 : Classification of Infrastructure Assets
Source: RREEF Research
From an investment perspective, social infrastructure tends to have lower risk-return profile as a result of its availability based model, which could limit the upside captured through user charge models. Such assets have traditionally been developed, owned, operated and funded by national or local governments but we currently see more asset managers investing in this sub-sector for diversification purposes. In contrast, economic infrastructure presents more steady revenue streams through user fees, tolling, or ticketing, and thus a wider range of opportunities for private sector participation (Deutsche).
As this asset class is vast, this paper will consider only the latter – assets whose financing and operation involve private parties. Therefore, assets financed, owned and operated solely by public authorities are excluded from further analysis.
Greenfield and Brownfield Infrastructure
A distinction can be made based on different development stages, that is, greenfield versus brownfield assets, otherwise known as ‘project development and operational assets’ or primary and secondary projects respectively (Weber, 21). The term greenfield refers to new infrastructure that is constructed
Transport Utilities Other
Bridges Gas Networks Parking Garages Educational Facilities Toll Roads Electricity Networks Storage Facilities Healthcare Facilities
Tunnels Power Generation Correctional Facilities
Airports Water & Sewage Public Transportation
Seaports Renewable Energy Freight Rail Communications
Infrastructure
Social Infrastructure Economic Infrastructure
for the first time and consequently will require all project phases including planning, development, construction, and the financing stage. In contrast, brownfield assets are already constructed with a history of operation that can provide sound visibility into revenue, usage rates and operating costs (depending on the infrastructure sub-sector’s underlying features and the inherent characteristics of the project itself). These projects may involve the reconstruction, renovation or expansion of existing assets.
Brownfield assets in good condition with long-term contracts will ideally offer stable, predictable cash yield immediately after acquisition in the form of dividends or interest payments in a similar way to real-estate or fixed-income products (Weber, 22); as a result, they tend to be particularly suitable for yield-driven investors. Greenfield assets that have yet to go through the development phase are subject to additional risks, such as construction risk and ramp-up risk, and therefore require higher returns to compensate for this risk (JPM). Additionally, greenfield projects do not generally return a project on their investments in the first years of the development and construction phase, with the initial capital only returned when the respective facility is operative, resulting in a so-called J-curve, which is typical of cash flows from private equity investments. Such assets are more appropriate for capital-gain or growth-style investors who are prepared to take additional risk (Weber, 22).
Mature and Emerging markets
Another way to classify the broad opportunity set is to employ a geographic lens. As demand for and type of infrastructure varies across regions, a distinction can be made between infrastructure assets located in mature markets and those located in emerging markets. In developed countries where the population is mature and slow-growing, it is the combination of aging systems and deferred maintenance that predominantly drives the demand for infrastructure. By contrast, developing economies need new infrastructure to support their fast-growing populations and help increase productivity (Af2i & JPM). For instance, Asia has a high proportion of greenfield projects, as emerging economies require more new construction than do most mature OECD countries. It is important to note that investments in infrastructure in non-OECD countries are generally considered riskier, principally due to a legal, regulatory and political environment that poses a higher risk of uncertainty than within OECD countries. This is especially the case in jurisdictions with relatively shorter regulatory histories, where regulatory decisions may be inconsistent (JPM).
2. Risk-return profiles of infrastructure investments
2.1 Risk-return spectrum
As discussed in the previous section, whilst the infrastructure asset class is generally defensive in nature, the extremely broad range of assets means that the risk exposure varies significantly across sub-sectors, development stages, and geographies. Alike any asset, the expected return of an infrastructure
asset is related to its corresponding risk exposure. For example, some sub-sectors such as social infrastructure, which includes hospitals and schools, tend to have lower risk exposure and lower returns. Similarly, greenfield assets have a typically higher risk exposure and expected return than brownfield assets (McKinsey). As such, it is difficult to draw general conclusions about the investment profile of infrastructure investments without making a precise differentiation between the various possible investment types.
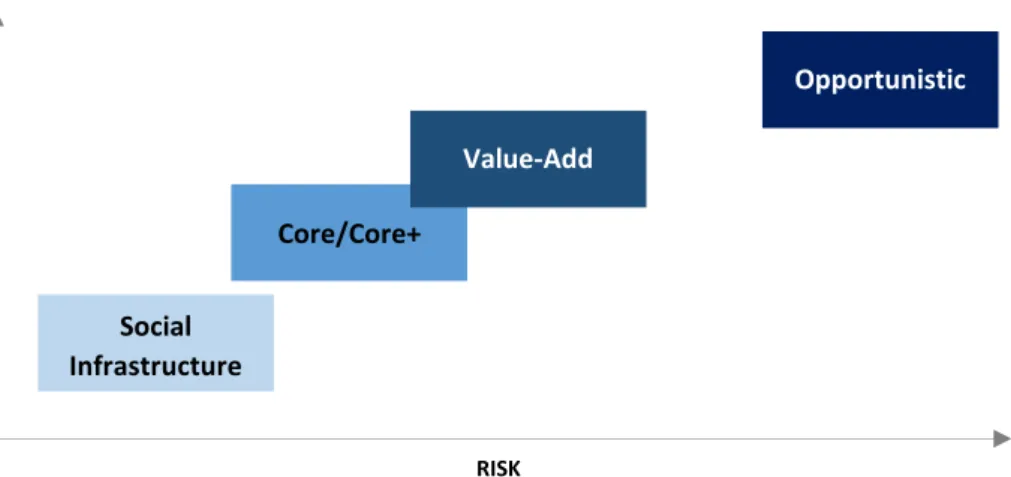
Figure 1.1: Risk & Return across the infrastructure spectrum
Source: BlackRock, February 2015
● Social infrastructure – refers to facilities and structures that are built to support communities, including hospitals, schools and education infrastructure. While traditionally under the jurisdiction of public authorities, there has been an active use of the Public-Private Partnership (PPP) model for new projects. In this model, the role of government is essentially transformed from that of project developer who retains and manages the risks of the construction, delivery, and operation and maintenance of a facility, to that of the long-term purchaser of the services provided by the project sponsors who are contracted to build and maintain the facility. Under this model, the government agency provides an availability-based payment in return for the facility being made available for public use (Grossman).
● Core assets – these assets are relatively stable in nature and often have high barriers to entry. As such, core infrastructure assets tend to be mature assets carrying low risk and providing most of their return through a healthy yield. Assets that fall under this category are usually strongly regulated utilities, businesses which provide essential services such as water supply, sewerage, electricity or other types of energy. These types of utilities tend to be regulated across most jurisdictions because of their essential importance to daily commerce and life and pricing is often set by the regulator. Performance of regulated utilities tends to be relatively resilient, regardless of the ups and downs of the economy, due to the essential nature of the
RISK R ETU R N Social Infrastructure Core/Core+ Value-Add Opportunistic
more susceptible to demand risk. Assets that fall under this latter category tend to be transportation assets (Blackrock).
● Value-added – these types of assets reside higher on the risk/return spectrum and can range from less mature operating assets to greenfield or are operating in unregulated industries or markets. These higher risks are justified by the higher return targets these assets seek to generate through both yield and capital appreciation (Grossman).
● Opportunistic – these assets lie on the highest end of the risk/return spectrum, as they are subject to significant risk, notably demand-risk given their unregulated nature. This can include uncontracted merchant power generation, transportation asset with no history, some telecom investments or large greenfield projects. It also encompasses assets in growth or emerging markets, assets where the investment case relies heavily on the growth of the local economy (Blackrock).
Focus on Core Infrastructure
We have noted that infrastructure is an expansive asset class, covering a wide span in the risk-return spectrum. The risk, return, and cash flow expectations vary on multiple dimensions such as an asset’s maturity, service area demographics, regulatory and political risks. As noted earlier, a core infrastructure asset occupies the lower end of the risk/return spectrum and can be characterized as an infrastructure asset for which the cash flows to equity owners is forecastable with a low margin of error. In that regard, core infrastructure consists of assets that are (i) mature beyond their demand ramp-up phases, (ii) functioning in established and transparent regulatory and political environments, (iii) serving demographically and economically sound service areas, and (iv) long-lived with minimal obsolescence or technology risks. Regulated utilities, energy assets with long-term contracts, and transportation assets with long-term concession agreements in the OECD economies can be defined as core assets, as long as they have the characteristics stated above (JPM).
In order to narrow the scope and form relevancy in our analysis, this paper will here on forward focus on core infrastructure.
2.2 Target Returns
What return can investors expect from core infrastructure investments and at what risk? As discussed earlier, the available data is still poor and history can offer little guidance. The following table, published by J.P. Morgan, depicts the illustrative returns of core infrastructure assets based on based on historical data and expectations.
Table 1.2: Illustrative Returns for Core Infrastructure Assets
Source: J.P. Morgan Asset Management, March 2015
3. Infrastructure investments
Infrastructure investments have gained much interest among investors given its potential to generate attractive and inflation-hedged total returns. As infrastructure financing increasingly moves towards private hands, investment opportunities in the asset class will continue to increase.
3.1 Private Sector Involvement in Infrastructure
Given the inherent public good nature of infrastructure, assets and projects have traditionally been within the purview of government ownership and public finance. However, public deficits, increased public debt to GDP ratios, and at times, the inability of the public sector to deliver efficient investment spending and optimal allocation of resources due to political interferences, have led to a reconsideration of the role of the state in infrastructure provision. This has shifted the role of the state to evolve from being owner and provider of public services to purchaser and regulator of them. The private sector comes in as financier and manager of infrastructure expecting attractive returns. Consequently, there has been a strong reduction of public capital committed to infrastructure (OECD). In fact, the OECD average ratio of capital spent in fixed investments to GDP fell from, above 4% in 1980 to approximately 3% in 2005.
As the share of government investment in infrastructures has declined, that of the private sector has increased, with privatizations being an important driver. Since the 1980s more than USD$1 trillion of assets have been privatized in OECD countries, with close to two-thirds of that accounted for by infrastructures, notably utilities, transport, telecommunications and oil facilities.
Sector Relative risk
assessment Avg. cash yield
Avg. expected return
Capital appreciation potential Social infrastructure/PPPs Low 4-5% 5-8% Low Contracted power generation Low 5-8% 6-10% Low Regulated utilities Low-medium 4-7% 8-10% Low-medium Toll roads Low-medium 4-6% 8-12% Low-medium Airports Medium 5-7% 10-15% Medium Seaports Medium 5-7% 11-16% Medium Freight rail Medium-high 6-8% 12-16% Medium-high Telecommunication infrastructure High 5-9% 12-18% High Merchant power generation High 0-4% 14-20% High
Figure 1.2: Value of privatization infrastructure transactions, 1990-2006
Source: Infrastructure to 2030, OECD
New business models with private sector participation, most notably PPPs and its variants have been increasingly used particularly in OECD countries, offering further scope for unlocking private sector capital and expertise.
Private sector participation has been characterized by the rise of institutional investors, with the likes of pension funds, insurance companies and sovereign wealth funds taking center stage. The emergence of such private institutional investors in infrastructure has been in response to a number of dynamic influences, including low-yield environment, heightened volatility and muted performance of equity markets.
Infrastructure investments are attractive to institutional investors such as pension funds and insurers as they can assist with liability-driven investments and provide duration hedging. These investments are expected to generate attractive yields in excess of those obtained in the fixed income market but with potentially higher volatility. Infrastructure projects are long-term investments that could match the long duration of pension liabilities. In addition, infrastructure assets linked to inflation could hedge pension funds liabilities’ sensibility to increasing inflation. It is now widely agreed that large institutional investors with long-term liabilities and a low-risk appetite are natural investors in less liquid, long-term infrastructure assets.
3.2 Infrastructure gap
Shifting infrastructure financing from the public to the private sector poses important challenges. First, the amount of money needed to fill the infrastructure gap is far from being negligible. Second, financial markets and intermediaries are required to play an important role in shaping financial contracts and financial solutions able to attract the highest number of investors (OECD).
Infrastructure funding gap
As mentioned before, significant demand for investments in infrastructure exists because the underlying assets are considered as growth drivers for any economy. Although governments are responsible for investments in new and existing infrastructure assets, the combination of economic upturn, insufficient investment in these sectors and the inadequate, even most basic, maintenance of existing aging facilities over the past decades have led to a considerable imbalance between supply and demand when it comes to infrastructure assets. This has been exacerbated by population growth and an increased demand for constructing, modernizing or replacing existing assets, which in turn leads to higher costs. Data provided by different sources agree on the overall investment shortfall. For example, the OECD and McKinsey quantify the total global infrastructure investment requirements by 2030 for transport, electricity generation, transmission and distribution, water and telecommunications is about $57-67tn and $71tn respectively. The European Commission estimates that, by 2020, Europe will need between €1.5tn and €2tn of infrastructure investments (OECD). In the United States, the American Society of Civil Engineers (2013) quantifies a total current infrastructure investment gap of $1.7tn and a need for additional investments of about $3.6tn by the end of 2020.
3.3 Investment vehicles
In order to meet the demand for investments in infrastructure, different investment vehicles have been engineered in order widen the net to attract investors; hence there is an increasing, and sometimes overlapping, variety of investment vehicles available for infrastructure assets. How exactly does one obtain exposure to infrastructure? It is particularly important to distinguish between listed and unlisted investment vehicles, and direct and indirect investments. The following matrix summarizes the most common forms of infrastructure investment grouped into categories listed/unlisted, and direct/indirect. It also shows schematically the exposure to different risks associated with them:
Figure 1.3: Matrix of most common forms of infrastructure investment
Source: Investing in Infrastructure, CAIA The three primary methods of gaining exposure to infrastructure assets are:
Direct or co-investments in unlisted infrastructure companies/projects: this form of investment in
infrastructure assets is the purest form of exposure. It typically requires significant amounts of capital
Direct Indirect
Unlisted Direct investments Unlisted infrastructure funds
Listed Stocks, bonds Listed infrastructure funds, indexes
Ti me horizon, l i quidity ri sk
for a single purchase and hence often viable for only the largest of investors. The main advantage of a direct investment is control; to this end, an expertise to efficiently manage the asset is essential. Due to its size and hands-on nature, most direct investments will not be adequately diversified across a large number of assets, subjecting the investor to high investment-specific risk and little flexibility in terms of liquidity. This can be done through either leading or co-investing with partners in a particular asset. This approach can also be implemented by entering into a separately managed account with an experienced asset manager (Grossman).
Indirect investments via unlisted funds: This form of investment follow closely a private equity fund
model. A limited partnership with a fixed term where capital commitments are drawn down by the manager over the investment period of the fund. Following capital deployment, the manager will attempt to create gains through sale or adopt a buy-and-hold strategy. A qualified fund manager sources infrastructure assets and enhances risk-adjusted returns for the fund’s investors in return for annual management fees and a performance fee. This approach is typically the most costly method to access the infrastructure space. However, it does not require a large in-house team of infrastructure investment professionals (as would be required by direct investments). Also, the pooling of money from multiple investors should lead to a more diversified portfolio of infrastructure assets with smaller capital requirements per investors. Liquidity issues remain, although to a lower extent than in the context of direct infrastructure investments (Grossman).
this form of investment refers to a collection of publicly traded stocks and/or debt of companies
whose businesses are directly related to infrastructure assets. Listed infrastructure vehicles also refer to the option of investing in investment funds which bundle several individual infrastructure assets and/or companies or debt. The primary advantages of listed infrastructure vehicles are (i) they are traded on an exchange, (ii) they are liquid, and (iii) they have extensive financial reporting requirements regulated by the various stock exchange (NBIM).
In general, listed infrastructure investment opportunities can gain greater diversification through investment across sectors and geographies, but also through the entire value chain, including project developers, building contractors, operators, suppliers, customers, utilities (Weber, 69). This approach is ideal for investors with significant liquidity requirements. While this is the lowest cost approach, these investments are subject to public market volatility and have the highest correlation to equity markets. The Rise of Direct Infrastructure Investment
The unlisted infrastructure fund model has, almost by default, become the primary route to market for most investors over the past decade. However, as many of the larger and more sophisticated infrastructure investors look to grow their portfolios, there is a developing trend away from unlisted funds and towards direct investment strategies. These investors are turning to direct investments in order to gain closer control over the assets held in their portfolios, as well as to bypass paying high
management fees. It also allows assets to be held more easily over the long term rather than being restricted to the lifespan of an infrastructure fund. Many of the most significant infrastructure investors i.e. pension funds, now pursue direct investment opportunities (Preqin). Nevertheless, direct investment requires significant internal resources and capital available to invest, which is not an option for the vast majority of institutional investors. For an investor, the most feasible approach depends on the investor’s strategy, liquidity requirements, budget, size, and experience of the in-house investment team (in the case of an institutional investor).
4. Performance of infrastructure investments
4.1 Yield-driven versus IRR-driven investors
When making infrastructure equity investments, investors generally pursue one of two financial objectives, or a combination of the two: 1) ensuring a stable, high level of current income (yield) and/or 2) ensuring the greatest possible return on equity. To this end, a distinction can be made between primarily yield-driven and IRR-driven investors (Weber, 22). As such, the Internal Rate of Return (IRR) and cash yield remain the key indicators LPs look to when assessing the performance of infrastructure funds. The weighting given to each of these differs by the type of LP investor. For example, pension fund LPs may be more focused on cash yield in order to service long-dated liabilities, while insurance company LPs will place a stronger emphasis on IRR, as they are generally required to market their investments (Deloitte).
4.2 Lack of data for unlisted infrastructure
Data available for unlisted infrastructure’s performance and volatility have historically been limited for several reasons. First, investment statistics are usually proprietary and investment managers tend to not disclose it. Due to this lack of transparency, it is extremely difficult to find proper performance data of unlisted infrastructure. Moreover, unlisted infrastructure investments present a relatively short track history due to its status as a young asset class. This is accentuated by the heterogeneity of the industry, made up of a large number of subsectors each with rather unique profiles and performances, making it very difficult to compare the assets on an aggregate fund level (Weber, 34). Consequently, very few data have been collected and established to date, again owing to the still relatively short history of unlisted infrastructure investments and investment vehicles (Wiley, 34). Moreover, it is also important to note that there is limited performance data available for the industry also because very few funds have completed a full investment cycle.
4.3 Structuring a benchmark
A benchmark can be defined as the relevant market with which the performance of an investment is compared (Wiley, 40); accordingly, investors use benchmarks to compare the financial performance of
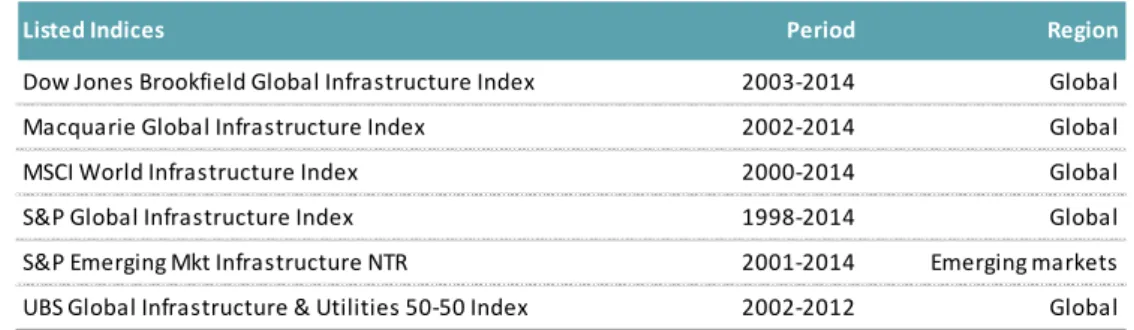
their investments with the market. Typically, a financial benchmark is an index of similar securities. In the case of listed infrastructure assets, the indices in the following table may serve as suitable benchmarks for investors depending on their specific investments.
Table 1.3: Main infrastructure benchmarks
Source: Weber, 48 Listed infrastructure indices are essentially equity market sector indices. Looking at historical performance, they generally show superior performance over equity markets prior to the financial crisis, while the performance wanes in later years. As seen in the chart below, generally, they display high correlation with equity indices, with negatively skewed and fat tail returns. However, their applicability to unlisted infrastructure investment is limited. Historically, performance analysis of unlisted funds has generally been limited to Australian funds (Inderst).
Figure 1.4: Historical Returns vs. Global Equities and Bonds (cumulative, USD)
Source: Bloomberg, UBS Global Infrastructure & Utilities 50-50 Index, J.P. Morgan Global Bond, MSCI World Equity Index For unlisted infrastructure, there is not currently a standard global infrastructure Index commonly used, although data collectors such as Preqin or IPD have developed proprietary indices. Hence, when unlisted infrastructure is concerned, there is also the possibility of using a selected benchmark based on goals of the investor. Given its distinctive characteristics as an asset class discussed in the previous
Listed Indices Period Region
Dow Jones Brookfield Global Infrastructure Index 2003-2014 Global Macquarie Global Infrastructure Index 2002-2014 Global MSCI World Infrastructure Index 2000-2014 Global S&P Global Infrastructure Index 1998-2014 Global S&P Emerging Mkt Infrastructure NTR 2001-2014 Emerging markets UBS Global Infrastructure & Utilities 50-50 Index 2002-2012 Global
section, investors use infrastructure for a variety of different roles in portfolio management, therefore different types of benchmarks based on such performance goals can be structured. Unsurprisingly, different strategic approaches necessitate different benchmarks, this means there is no single ‘right’ way to benchmark the asset class. A simple, straightforward approach is benchmarking infrastructure investments against absolute return expectations and/or inflation, usually CPI, plus a margin (AMP Capital [1]). More sophisticated approaches also exist that considers overall asset allocation goals, investment strategy, risk profiles of underlying assets, performance expectations, etc., when specifying a benchmark (Weber, 44). These can include:
Real estate (index) + margin
Bond yield + margin
Peer group
Listed infrastructure + margin
Inflation plus risk premium
Hybrid approaches
The variety of benchmarks used reflects not only the lack of long–term time series data for the asset class, but more particularly the different roles infrastructure can be expected to play in portfolio management. Unsurprisingly, different strategic approaches necessitate different benchmarks. Despite the differences, there does appear to be a consensus among institutional investors that infrastructure fits somewhere between regular equities and fixed income on the risk-reward spectrum (AMP Capital).
4.4 Listed versus unlisted infrastructure
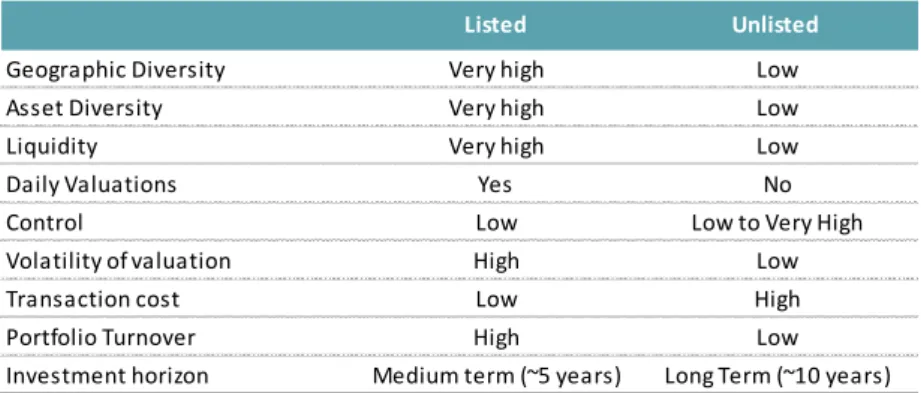
As discuss earlier, unlisted assets are investments that are not listed on the stock exchange. They can include direct infrastructure (roads, power grids and airports) and private equity infrastructure funds. Listed assets, on the other hand are valued daily by the stock market, while the values of unlisted assets are based on the underlying value of the asset. Listed assets tend to perform very differently their unlisted counterparts, as they are affected my market sentiment which can be very volatile. Therefore, although the underlying returns of listed and unlisted infrastructure can be expected to converge over the medium term, over the shorter term there are structural differences relating to liquidity and volatility. These differences can be summarized in the table below:
Table 1.4: Characteristics of listed and unlisted infrastructure
Listed Unlisted
Geographic Diversity Very high Low Asset Diversity Very high Low
Liquidity Very high Low
Daily Valuations Yes No
Control Low Low to Very High
Volatility of valuation High Low
Transaction cost Low High
Portfolio Turnover High Low
Source: AMP Capital These distinctions between listed and unlisted assets give rise to variation in their respective performance returns and volatility. We can observe this by looking at the infrastructure assets in Australia – where the asset class it’s the most mature and developed and with the best data. We looked at how returns of the S&P/ASX 300 (a Total Return Index), fluctuates compared to an Unlisted Infrastructure Fund - the Mercer Unlisted Infrastructure Fund, between the years 2001-2012.
Figure 1.5: Rolling 12-month returns from listed and unlisted Australian infrastructure
Source: Fact sheet, AustralianSuper The chart shows there is a high level of variability in the returns of the listed infrastructure, while unlisted infrastructure tends to be much less volatile and far more stable in the investment returns they provide. The resilience of unlisted infrastructure is especially noted during the period of the financial crisis of 2008.
Other academic and industry sources also reflect the same trend. We can note in the table below that unlisted funds carry a lower annual return with lower volatility, while listed funds tend to have higher returns in return for greater volatility.
Table 1.5: Return and volatility of listed vs. unlisted funds
Source: Weber, 35 Notably, Peng and Newell (2007) were among the first in the academic field to solidly, comparatively analyze listed and unlisted infrastructure investments in Australia. Over a period of 10 years (1995– 2006), they compared the risk-adjusted performance of 16 listed infrastructure companies (with assets of A$55 billion), 16 listed infrastructure funds (with assets of A$27 billion) and 19 unlisted funds (with 144 infrastructure assets of A$4.5 billion). They found that for listed infrastructure the average return was 22.5% and the volatility was 7.9%, which compared to a 14.1% return and a 5.8% volatility for unlisted infrastructure (Weber, 36).
Type Source Institution/Author/Index Period Region Annual Return (%) Volatility (%std.dev)
Academic Peng and Newell (2007) 1995-2006 Australia 14.1 5.8 Finkenzeller, Dechant and Shepherd (2010) 1994-2009 Australia 8.2 3.8 Hartigan, Prasad and De Francesco (2011) 1998-2008 UK 6.5 n/a Newell, Peng and De Francesco (2011) 1995-2009 Australia 14.1 6.5 Industry Macquarie 1995-2002 Australia 19.2 n/a Colonial First State 1996-2006 Australia 13.5 n/a Colonial First State 2001-2010 Australia 11.0 n/a Mercer/CFS 1995-2013 Australia 11.8 5.9
J.P. Morgan 1995-2014 Global 7.0 7.5
Academic Peng and Newell 1995-2006 Australia 22.5 7.9 Industry Duet Group 2004-2014 Australia/NZ 10.7 29.4 Cohen & Steers Infrastructure Fund 2004-2014 Global 9.6 26.4 Lazard Global Listed Infrastructure Fund 2005-2014 Global 11.1 14.8 Macquarie Infrastructure Corporation 2004-2014 Korea 15.0 63.5 Macquarie Korea Infrastructure Fund 2002-2014 Korea 7.5 18.7
Unlisted Funds
Chapter II: Appetite for infrastructure assets
1. Deal flow within the infrastructure asset class
The following analysis on trends and development within the infrastructure asset class is largely based on data provided by Preqin’s Infrastructure Report.
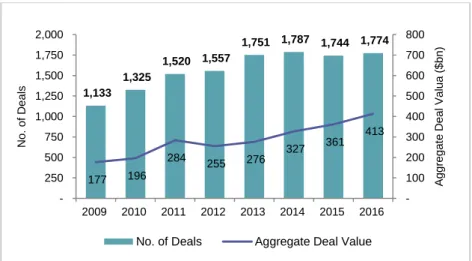
In terms of deal volume, the number and aggregate value of infrastructure deals remained resilient throughout 2016. This follows a period of growth where investment in global infrastructure assets increased from $177bn in 2009 to a record of $413bn in 2016. Yet, the number of deals has held relatively steady since 2013, suggesting that there is a “surplus of money chasing too few projects”. The demand for infrastructure has increased over the last decade, resulting in greater competition for assets – especially brownfield assets located in mature economies that are already generating stable revenues (Preqin). It is therefore consequential that asset valuation and average deal size has continued to rise, with the latter growing to a record $364m in 2016.
Figure 2.1: Number and Aggregate Value of Infrastructure Deals Completed Globally, 2009-2016
Source: Preqin Infrastructure Online
Figure 2.2: Average Annual Infrastructure Deal Size, 2009-2016
1,133 1,325 1,520 1,557 1,751 1,787 1,744 1,774 177 196 284 255 276 327 361 413 100 200 300 400 500 600 700 800 250 500 750 1,000 1,250 1,500 1,750 2,000 2009 2010 2011 2012 2013 2014 2015 2016 Aggregat e D eal Valua ($bn) N o. of D eals
No. of Deals Aggregate Deal Value
292 294 347 361 313 325 320 364 50 100 150 200 250 300 350 400 2009 2010 2011 2012 2013 2014 2015 2016 A v e ra g e D e a l S iz e ( $ m )
Source: Preqin Infrastructure Online
Figure 2.3: Infrastructure Deals by Transaction Value, 2009-2016
Source: Preqin Infrastructure Online The growth in asset valuation and average deal size is reflected in the rising proportion of deals falling into the larger size categories – it can be observed that deals completed for $500m or more accounted for a growing proportion of transactions between 2009 and 2014. More recently, this proportion has remained relatively steady at 20% in both 2014 and 2015, and 21% in 2016. Deals over $1bn in size represented 13% of completed deals in 2016, up from 11% in 2015 (Prequin).
Figure 2.4: Infrastructure Deals by Region, 2009-2016
Source: Preqin Infrastructure Online In terms of deal activity by region, Asia’s share of global infrastructure deals has increased substantially from over the years, reaching an all-time high of 33% in 2015, and dipping to 31% in 2016; this is still up from just 19% back in 2009. Europe accounted for the same proportion of deals as
52% 46% 45% 48% 52% 53% 56% 52% 34% 40% 36% 33% 30% 27% 25% 28% 7% 8% 8% 8% 9% 10% 9% 9% 7% 7% 12% 11% 9% 10% 11% 13% 0% 20% 40% 60% 80% 100% 2009 2010 2011 2012 2013 2014 2015 2016 P ro p o rt ion o f D e a ls > $1bn $500-999m $100-499m < $100m 26% 29% 26% 29% 28% 27% 29% 24% 44% 35% 42% 36% 34% 34% 28% 31% 19% 22% 19% 18% 23% 26% 33% 31% 3% 5% 5% 4% 4% 3% 3% 3% 4% 5% 4% 7% 8% 7% 4% 4% 4% 3% 4% 5% 5% 3% 4% 6% 0% 20% 40% 60% 80% 100% 2009 2010 2011 2012 2013 2014 2015 2016 P ro p o rt io n o f Dea ls Other Latin America Australasia Asia Europe North America
Asia in 2016. While Europe’s solid history of private sector investment and relatively stable political and economic landscape has propelled the infrastructure industry, a crowded and competitive market has driven asset prices higher and forced some investors to look for alternative investment opportunities. The result has been a gradual decline in deal activity in the region as a proportion of global deal activity. Similarly, North America has experienced a decline in their share of total infrastructure deals, falling to 24% in 2016, its lowest level since 2009 (Preqin). The proportion of deal activity focused on the rest of the world remained relatively constant in 2016.
Figure 2.5: Infrastructure Deals by Industry, 2009-2016
Source: Preqin Infrastructure Online
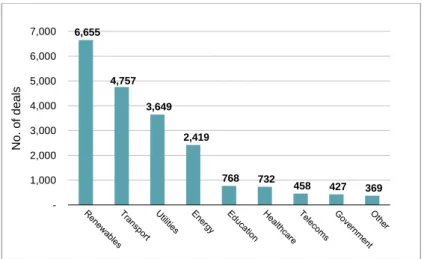
Figure 2.6: Number of Private Asset Transactions by Industry, All Time
Source: Preqin Infrastructure Online In terms of deal activity by industry, core infrastructure industries, including renewables energy, transport, energy and utilities, continue to be popular with investors targeting the asset class. In fact, they accounted for 86% of deals completed in 2016. Renewable energy maintains its first position
34% 36% 37% 36% 37% 40% 39% 42% 24% 23% 20% 19% 21% 23% 30% 25% 13% 9% 12% 14% 10% 11% 8% 6% 9% 12% 13% 11% 12% 8% 11% 12% 17% 17% 15% 15% 16% 16% 11% 13% 4% 4% 3% 4% 4% 2% 2% 2% 0% 20% 40% 60% 80% 100% 2009 2010 2011 2012 2013 2014 2015 2016 P ro p o rtio n o f Dea ls Other Utilities Energy Social Transport Renewables 6,655 4,757 3,649 2,419 768 732 458 427 369 1,000 2,000 3,000 4,000 5,000 6,000 7,000 N o . o f d e a ls
accounting for 42% of all deals completed in 2016, up from only 34% in 2009. This is largely due to the global push towards alternative energy sources that has continued to increase demand for capital in the renewable energy market. The popularity of renewable energy assets is further noted by looking at the distribution of private sector infrastructure transactions by industry on an all-time basis. Note that renewable energy has the largest number of assets, at 6,655, which accounts for 33% of the total, followed by transport and utilities.
Figure 2.7: Global Infrastructure Volumes by Project Stage, 2014 - 2016 (USDm)
Source: InfraDeals League Table In terms of deal activity by project stage, we note that institutional investors and fund managers tend to favour mature and established infrastructure assets i.e. brownfield assets, as they are less willing to be exposed to construction risk associated with greenfield assets. Consequently, we can observe that brownfield assets and refinancing deals have accounted for the vast majority of completed transactions over the period of 2014-2016.
2. Evolution of the investors universe
With the emergence of infrastructure investments as a separate asset class, the infrastructure market is currently experiencing many changes, notably in terms of dedicated allocations, followed strategies (co-investments, direct investments, etc.) and geographies selection.
2.1 Assets under Management (AuM) and Dry Powder
The evolution of the infrastructure AuM since 2005 as shown in Figure 2.8, clearly shows the growth in this new industry. As of H1 2015, the allocation to infrastructure as an asset class has reached c.$309bn of AuM, of which $201bn was held by companies as unrealized value in infrastructure assets and the remaining, $108bn, as dry powder (the capital committed to funds that have not yet been called up by fund managers). North America accounts for the largest proportion of global infrastructure AuM followed by Europe and Asia.
0 20 000 40 000 60 000 80 000 100 000 120 000 Q1 Q2 Q3 Q4 Q1 Q2 Q3 Q4 Q1 Q2 Q3 Q4 2014 2015 2016 Refinancing Brownfield Greenfield
Figure 2.8: Unlisted infrastructure AuM (Dec, 2004-Jun, 2015)
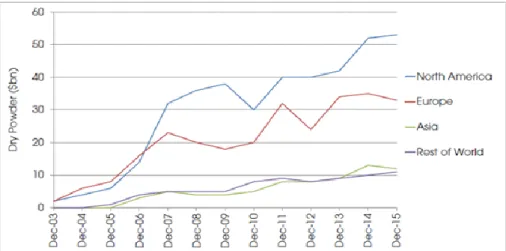
Source: Preqin Infrastructure Online Despite the rising Dry powder, its level is not symmetrically split between regions; funds focusing on North American investments have experienced a significant increase in Dry Powder: from $1bn at end 2014 up to $53bn by 2015. Although the figure for other regions are less important, they contribute to the overall growth of the infrastructure industry.
Figure 2.9: Unlisted infrastructure dry-powder by primary geographic focus (Dec, 2003-Dec, 2015)
Source: Preqin Infrastructure Online
2.2 Investors’ allocations to Infrastructure
Investors allocations to infrastructure assets have increased in the last years, as shown in Figure 2.10, compared to historical levels. This trend witnesses the rising prominence of this real asset class among investment portfolios (as a percentage of AuM) and other alternative investments.
11 16 38 65 67 65 69 90 82 116 112 108 6 9 17 35 51 62 94 127 149 171 196 201 -50 100 150 200 250 300 350 Jan-04 Jan-05 Jan-06 Jan-07 Jan-08 Jan-09 Jan-10 Jan-11 Jan-12 Jan-13 Jan-14 Jan-15 Dry powder Unrealised value
Figure 2.10: Average allocation to infrastructure as % of AuM (Dec, 2011-Dec, 2015)
Source: Preqin Infrastructure Online
However, the allocations and the degree of exposure to these assets vary depending on the type of investors (Figure 2.11). For instance, Superannuation schemes (based in Australia) have the highest average allocation (current and target) to infrastructure given the more dated history of this asset class in Australia and the expertise of the asset managers.
Figure 2.11: Average allocation to infrastructure by type of investor
Source: Preqin Infrastructure Online According to Preqin, as of end 2015, 63% of investors are below their long-term target weighting to the infrastructure asset class. The gap is expected to be filled in the next years by investing additional capital in the industry in order for investors to match their strategic targets. Further, it is expected that 52% of the investors will increase their investments in infrastructure in the long-term reflective of the increasing recognition of the potential of infrastructure assets to generate stable cash flows matching investors requirements. 3.5% 3.3% 3.6% 4.3% 4.3% 4.9% 5.0% 5.1% 5.7% 5.7% -1.0% 2.0% 3.0% 4.0% 5.0% 6.0% 2011 2012 2013 2014 2015
Avg. Current allocation Avg. Target allocation
6.6% 4.1% 3.2% 2.9% 2.5% 2.5% 8.7% 6.1% 5.1% 3.9% 4.3% 3.9% -1.0% 2.0% 3.0% 4.0% 5.0% 6.0% 7.0% 8.0% 9.0% Super-annuation scheme Endowment plan Public pension fund Insurance company Private sector pension fund Foundation
Evolution of Limited Partners (LPs) panel
An increasing number of investors has shown interest for infrastructure investments in the last years; according to Preqin, over 2,600 institutional investors worldwide are investing or intend to invest in infrastructure assets over the next years. This figure might seem very low in absolute terms compared to investors in the alternative investments sphere, such as private equity or real assets (excluding infrastructure assets), but this is due to the recent development of this asset class, which did not explicitly exist before 2005. However, the exposure to these assets is increasing on a yearly basis as demonstrated above.
This emergent appetite for infrastructure investments is the result of a combination of factors/ characteristics that made these investments an adequate match for investors’ requirements in the current macroeconomic environment.
Nevertheless, we can observe a significant variation in appetite from different types of investors. Over the last years, pension funds have demonstrated the greatest appetite for infrastructure investments (circa 33%), with public pension funds generally more active than their private sector peers, followed by private wealth entities (11%) comprised of wealth managers, multi-family offices and single-family offices, and insurance companies (10%). These investors are also the ones with the largest ticket size investing in the infrastructure asset class. This breakdown is not surprising as these investors are looking for long-horizon investments and steady yields to match their long-term liabilities, which are provided through infrastructure investments.
Furthermore, in addition to the traditional investors from mature markets (North America, France and Australia), a number of investors are emerging from Asia (mainly Japan, Korea and China) and are increasing significantly their investments in the sector.
Figure 2.12: Breakdown of institutional investors by investor's type
Source: Prequin Infrastructure 2015 report
Pension fund (Private sector) 19% Pension fund (Public sector) 15% Private wealth 11% Insurance company 10% Foundation 9% Endowment Plan 8% Bank/Invest ment Bank 7% Asset Manger 6% Other 15%
2.3 Access to the Infrastructure Market
When it comes to investments in unlisted infrastructure assets, several solutions are offered to institutional investors to invest in these assets. The main routes being closed-ended funds, direct investments, co-investments, Funds of Funds or managed accounts.
In general, the preferred routes to infrastructure investments is direct investment, unlisted funds and listed funds. As illustrated in Figure 2.13, between 2012 and 2014, investors were favouring direct investments (29% investors in 2012 vs. 56% in 2014) versus investment through unlisted funds (91% in 2012 vs. 65% in 2014), which could be explained by the tendency for large sophisticated institutional investors, with qualified teams in place able to source, invest and monitor a portfolio of infrastructure assets, to club investments avoiding by this paying management fees to a general partner. We note, however, that this is the case for big institutional investors with large capital and resources. Nevertheless, in 2015, the appetite for unlisted infrastructure is coming back (70% for unlisted funds vs. 48% in 2014). This flip-flop has been explained by the concerns over the recent valuations for the infrastructure assets and the ability of some General Partners (GPs) to source assets at attractive prices. Nevertheless, the trend towards direct investments is likely to pursue especially for established institutional investors.
Figure 2.13: Favourite routes to infrastructure investments
Source: Preqin Infrastructure Online
2.4 Reasons for the increasing interest on infrastructure assets
Substitute for real estate investments
Unlisted infrastructure investments are perceived as low-valued compared to “similar” asset classes such as Real Estate, especially during the 2007 bubble and considered as having low volatility and low correlation (and built-in inflation protection).
91.0% 76.0% 65.0% 70.0% 29.0% 46.0% 56.0% 48.0% 7.0% 14.0% 6.0% 6.0% -20.0% 40.0% 60.0% 80.0% 100.0% 2012 2013 2014 2015
Table 2.1: Inter-asset correlation matrix (Q3-1995; Q2-2006)
Source: Peng & Newell (2007) Note: * Significant correlation (p<5%) According to Peng & Newell (2007) analysis of a sample of unlisted infrastructure quarterly data series over the period (1995–2006), unlisted infrastructure assets returns proved to be low correlated with other assets (Table 2.1): 26% against real estate, 6% against equity and 17% against bonds, however, these correlations are statistically insignificant at the 5% level.
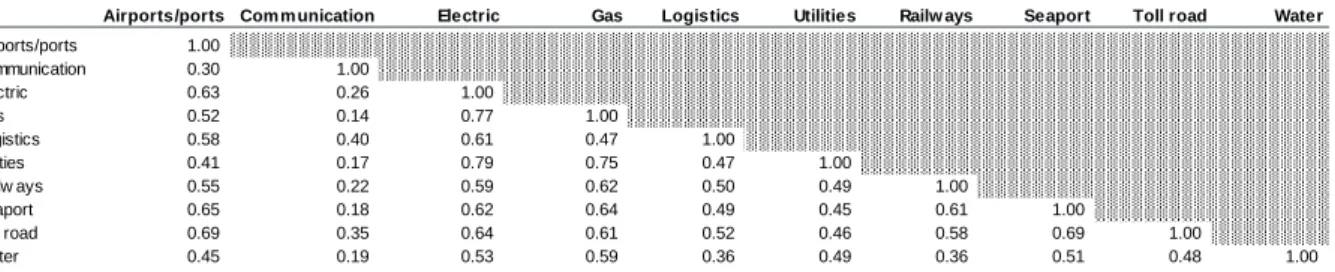
Furthermore, the correlation between the infrastructure sub-sectors is also low, e.g. 26% correlation between airports and toll roads. This result has been somewhat endorsed by the findings of RARE
(2013) based on daily 10-year time series of listed infrastructure assets; the correlation coefficient for
the studied sub-sectors is contained in the range [45%;65%], excluding communication sector which shows lower correlations with the different sectors (Table 2.2).
Table 2.2: Cross sector correlation matric (2000-2012)
Source: RARE (2013)
APM Capital (2014) also demonstrated through the analysis of 10-year series that the correlation
between infrastructure and other assets is low. Additionally, while the correlation between returns for listed and unlisted infrastructure assets is of 36% for Peng and Newell (2007), it is lower for AMP
Capital and it is at 26% (Table 2.3). Hence, investors view in this low correlation a path for further
diversification for their portfolios investment strategies.
Com posite infrastructure
Listed
infrastructure Toll roads Airports Utilities
Unlisted
infrastructure Real estate Listed equity Bonds Composite infrastructure 1.00 Listed infrastructure 0.86* 1.00 Toll roads 0.85* 0.99* 1.00 Airports 0.38* 0.40* 0.26 1.00 Utilities 0.82* 0.42* 0.42* 0.14 1.00 Unlisted infrastructure 0.31 0.36* 0.36* 0.26 0.16 1.00 Real estate (0.08) 0.03 (0.01) 0.36* (0.21) 0.26 1.00 Listed equity 0.15 0.21 0.14 0.54* 0.01 0.06 0.14 1.00 Bonds 0.57* 0.38* 0.38* (0.03) 0.57* 0.17 (0.12) (0.21) 1.00 Inflation (0.20) (0.22) (0.22) (0.23) (0.12) (0.17) 0.10 (0.09) (0.25)
Airports/ports Com m unication Electric Gas Logistics Utilities Railw ays Seaport Toll road Water Airports/ports 1.00 Communication 0.30 1.00 Electric 0.63 0.26 1.00 Gas 0.52 0.14 0.77 1.00 Logistics 0.58 0.40 0.61 0.47 1.00 Utilities 0.41 0.17 0.79 0.75 0.47 1.00 Railw ays 0.55 0.22 0.59 0.62 0.50 0.49 1.00 Seaport 0.65 0.18 0.62 0.64 0.49 0.45 0.61 1.00 Toll road 0.69 0.35 0.64 0.61 0.52 0.46 0.58 0.69 1.00 Water 0.45 0.19 0.53 0.59 0.36 0.49 0.36 0.51 0.48 1.00