by
R ICH A R D JACK SON, N E I L HOW E , and K E ISU K E NA K A SH I M A
G A P I N D E X . C S I S . O R G CENTER FOR STRATEGIC AND
INTERNATIONAL STUDIES 1800 K Street, NW Washington, DC 20006 USA Tel: + 1 202-887-0200 www.csis.org JACKSON NATIONAL LIFE INSURANCE COMPANY
1 Corporate Way Lansing, MI 48951 USA Tel: +1 517-381-5500 www.jackson.com
The
Global
Aging
Preparedness
Index
About the Authors
RICHARD JACKSON is a senior fellow at CSIS, where he directs the
Global Aging Initiative, a research program that explores the eco-nomic, social, and geopolitical implications of demographic trends in the United States and around the world. He is also a senior adviser to the Concord Coalition. Jackson is the author or co-author of nu-merous policy studies, including The Graying of the Middle Kingdom (2004); Long-Term Immigration Projection Methods: Current Practice and How to Improve It (2006); and The Graying of the Great Powers (2008). Jackson regularly speaks on long-term demographic and eco-nomic issues and is widely quoted in the international media. He holds a Ph.D. in history from Yale University and a B.A. in classics from SUNY at Albany. He lives in Alexandria, Virginia, with his wife Perrine and three children, Benjamin, Brian, and Penelope.
NEIL HOWE is an economist, demographer, and historian who writes
and speaks frequently on the aging of the population, long-term fiscal policy, and generations in history. He is a senior associate at CSIS, where he works with the Global Aging Initiative, and a senior adviser to the Concord Coalition. He is also founding partner and president of LifeCourse Associates, a marketing, HR, and strategic planning con-sultancy serving corporate, government, and nonprofit clients. Howe is the author or co-author of numerous books and policy studies, in-cluding On Borrowed Time (1988); Generations (1991); 13th-Gen (1993); The Fourth Turning (1997); Millennials Rising (2000); and The Graying of the Great Powers (2008). He holds graduate degrees in history and economics from Yale University and lives in Great Falls, Virginia.
KEISUKE NAKASHIMA is a fellow at CSIS, where he is assistant
di-rector of the Global Aging Initiative. He writes extensively on the economics of population aging and social security reform, especially in East Asia, and is the author or co-author of numerous policy stud-ies, including The Aging of Korea (2007); Meeting Japan’s Aging Chal-lenge (2008); and China’s Long March to Retirement Reform (2009). Nakashima holds an M.A. in international relations from the Max-well School of Citizenship and Public Affairs at Syracuse University and a B.A. in Anglo-American studies from Kobe City University of Foreign Studies.
ABOUT CSIS
In an era of ever-changing global opportu-nities and challenges, the Center for Strate-gic and International Studies (CSIS) provides strategic insights and practical policy solu-tions to decision makers. Since its founding in 1962, CSIS has grown to become one of the world’s preeminent public policy institu-tions, with more than 220 full-time staff and a large network of affiliated scholars. A bipar-tisan, nonprofit organization headquartered in Washington, DC, CSIS maintains research programs on each of the world’s regions, as well as on the transnational challenges that know no boundary, from energy and climate policy to demographic change, global devel-opment, and economic integration. Former U.S. senator Sam Nunn became chairman of the CSIS Board of Trustees in 1999, and John J. Hamre has led CSIS as its president and chief executive officer since 2000. The CSIS Global Aging Initiative (GAI) explores the fiscal, eco-nomic, social, and geopolitical implications of population aging. GAI pursues an ambi-tious educational agenda—undertaking cutting-edge research projects, publishing high-profile reports, and organizing interna-tional conferences that bring together world leaders to discuss common problems and explore common solutions.
ABOUT JACKSON NATIONAL LIFE INSURANCE COMPANY
Jackson is one of the largest life insurance companies in the US, providing retirement savings and income solutions to 2.8 million customers. Jackson is also one of the top three providers of total annuities and one of the top four providers of variable and fixed index annuities in the US. Founded nearly 50 years ago, Jackson has a long and successful record of providing advisers with the prod-ucts, tools and support to design effective retirement solutions for their clients.
Jackson is an indirect subsidiary of Pru-dential plc, a company incorporated in the United Kingdom. Prudential plc is not affili-ated in any manner with Prudential Financial, Inc, a company whose principal place of busi-ness is in the United States of America. ABOUT THE
GLOBAL AGING
PREPAREDNESS INDEX
The Global Aging Preparedness Index (or GAP Index) was developed by the Center for Stra-tegic and International Studies’ Global Aging Initiative with financial support from Pru-dential plc. The goal of the GAP Index is to help inform the policy debate about global aging and focus attention on the need for constructive reform in confronting one of the transformative challenges of the twenty-first century. CSIS hopes that the GAP Index will become the centerpiece of an ongoing project that includes updates of the Index itself as well as in-depth country and issue studies. Supplemental data and analysis related to the GAP Index are available on the Index website at gapindex.csis.org.
Copyright © 2010
The Center for Strategic and International Studies All rights reserved.
Table of Contents
Executive Summary ... iii
Acknowledgments ...vii
Introduction:
The Challenge of Global Aging ...1
1
The GAP Index Framework ...7
2
The Fiscal Sustainability Index ... 13
Category One: Public Burden ... 13
Category Two: Fiscal Room ...18
Category Three: Benefit Dependence ...22
Overall Fiscal Sustainability Results ...26
3
The Income Adequacy Index ...29
Category One: Total Income ...29
Category Two: Income Vulnerability ...32
Category Three: Family Support ...38
Overall Income Adequacy Results ...41
4
Strategies for the Future ...45
Reduce Public Pension Benefits ...46
Reduce Health-Care Cost Growth ...47
Extend Work Lives ...47
Increase Funded Pension Savings ...49
Strengthen Poverty Floors ...50
Increase Fertility Rates ...50
Increase Immigration ...51
Conclusion ...52
Technical Appendix ...53
by
R ICH A R D JACK SON, N E I L HOW E , and K E ISU K E NA K A SH I M A G A P I N D E X . C S I S . O R G C E N T E R F O R S T R A T E G I C A N D I N T E R N A T I O N A L S T U D I E S O C T O B E R 2 0 1 0
The
Global
Aging
Preparedness
Index
THE GLOBAL AGING PREPAREDNESS INDEX EXECUTIVE SUmmARy ~
iii
Global aging promises to affect everything from business psychology and worker productivity to rates of savings and investment, long-term returns to capital, and the direction of global capital flows. Perhaps most fatefully, it could throw into ques-tion the ability of many societies to provide a de-cent standard of living for the old without placing a crushing burden on the young.
The purpose of the Global Aging Preparedness Index (or GAP Index) is to provide a comprehen-sive assessment of the progress that countries are making in preparing for global aging, and par-ticularly the “old-age dependency” dimension of the challenge. The GAP Index covers twenty countries, including most major developed coun-tries and a selection of economically important emerging markets for which adequate data were available. Its projection horizon extends through the year 2040 in order to capture the full impact of the demographic transformation now sweeping the world.
The overall GAP Index consists of two separate subindices—the “fiscal sustainability index” and the “income adequacy index.”
On the fiscal side, the GAP Index begins by looking at projections of public old-age benefit spending, including both pensions and health benefits. But the Index also goes further. It takes into account the differing fiscal room that coun-tries have to accommodate their growing old-age dependency burdens by raising taxes, cutting other spending, or borrowing. It also considers the degree of elderly dependence on public ben-efits in different countries, which may be a crucial
factor in determining how politically easy or diffi-cult it will be to enact new cost-cutting reforms—
Executive Summary
GAP Index Country Rankings
Fiscal SustainabilityIndex Income Adequacy Index
1 India 1 Netherlands 2 Mexico 2 Brazil 3 Chile 3 US 4 China 4 Germany 5 Russia 5 UK 6 Poland 6 Australia 7 Australia 7 Sweden 8 Japan 8 Chile 9 Canada 9 Spain 10 Sweden 10 India 11 US 11 Canada 12 Korea 12 Japan 13 Switzerland 13 Poland 14 Germany 14 Switzerland 15 UK 15 Russia 16 Italy 16 France 17 France 17 Italy 18 Brazil 18 China 19 Netherlands 19 Korea 20 Spain 20 Mexico
iv
~ EXECUTIVE SUmmARy THE GLOBAL AGING PREPAREDNESS INDEXor indeed, to follow through on reforms that have already been enacted but not yet phased in.
On the adequacy side, the GAP Index tracks trends in the living standard of the elderly relative to the nonelderly in each country based on projec-tions that factor in the impact of changes in public benefit programs, private pension provision, and
labor-force participation rates. It also includes in-dicators that measure the robustness of old-age safety nets and family support networks, which play a crucial role in retirement security in many emerging markets and some developed countries.
The GAP Index reveals that most countries are doing much better on one dimension of aging
pre-GAP Index Reform Strategy Guide
1 2 3 4 5 6 7 Reduce Public Pension Benefits Reduce Health-Care
Cost Growth Work LivesExtend
Increase Funded Pension Savings Strengthen Poverty Floors Increase Fertility
Rates ImmigrationIncrease
Australia O OO O OO O
Brazil OOO O O OO O O
Canada O OO O OO O
Chile O O O O O O
China O OO OO OOO OO O
France OOO OOO OOO OOO O O
Germany OOO OO OO OO OOO OOO
India OO OO OO
Italy OOO OO OOO OO O OOO OO
Japan OOO OO OO OO OOO OOO
Korea O O OOO OOO OOO OOO
Mexico OO OOO O
Netherlands OO OOO OO OO OO
Poland OOO OO OO OOO OO
Russia O OO OO O OOO O
Spain OOO OO OOO OOO OO OOO OO
Sweden OO OO O O O
Switzerland O OO O O OOO O
UK O OO OO O O O
US O OOO O OO
THE GLOBAL AGING PREPAREDNESS INDEX EXECUTIVE SUmmARy ~
v
paredness than the other, suggesting that today’s re-tirement policies often entail a worrisome trade-off between fiscal sustainability and income adequacy. Three of the seven highest-ranking countries on the fiscal sustainability index (mexico, China, and Russia) are among the seven lowest-ranking coun-tries on the income adequacy index. Four of the seven highest-ranking countries on the income ad-equacy index (the Netherlands, Brazil, Germany, and the UK) are among the seven lowest-ranking countries on the fiscal sustainability index.
There are, however, some notable exceptions. Australia, which combines a low-cost, means-tested floor of public old-age poverty protection with a large, mandatory, and fully funded private pension system, scores in the top half of both indices. Although some real concerns about the adequacy of retirement provision for low earners remain, Australia appears to be on track to meet the aging challenge. France and Italy, on the other hand, score near the bottom of both indices. Each has legislated large future cuts in the generosity of its public pension system in an effort to shore up its long-term sustainability. yet despite the re-forms, old-age benefits will continue to impose a heavy fiscal burden even as they become increas-ingly inadequate.
The GAP Index includes a reform guide that assesses the potential payoff of seven key reform strategies, from reducing public pension benefits and health-care cost growth to increasing fertility rates and immigration. Two strategies in
particu-lar—extending work lives and increasing funded pension savings—are especially important, since they allow countries to escape, or at least to miti-gate, the trade-off between fiscal sustainability and income adequacy. They offer the best means for the world’s aging societies to maintain the liv-ing standard of the old without imposliv-ing a steeply rising burden on the young.
It is encouraging that countries around the world have begun to move in this direction. From Germany, Poland, and Sweden to Chile, China, and India, governments are expanding existing funded pension systems or jump-starting new ones. Elderly labor-force participation rates have also begun to rise in many countries, with espe-cially large increases in some continental Euro-pean countries long known for generous early retirement benefits. The lesson of the GAP Index is not that governments are doing nothing to re-spond to the challenge of global aging, but that they are not yet doing enough.
Ten or fifteen years ago, global aging barely registered as a policy issue. Today, with large age waves looming just over the horizon in most of the world’s leading economies, it has become the focus of growing concern. many governments are beginning to debate—and some have enacted— major reforms. yet despite this progress, there ex-ists no satisfactory measure of how well countries worldwide are actually responding to the chal-lenge. The Global Aging Preparedness Index is designed to fill this gap.
THE GLOBAL AGING PREPAREDNESS INDEX ACKNOWLEDGmENTS ~
vii
Acknowledgments
The authors have accumulated many debts while working on The Global Aging Preparedness Index and are pleased to be able to acknowledge some of the most important here.
First mention must go to Serena yi-ying Lin, a consultant with the CSIS Global Aging Initia-tive who took on the daunting task of analyzing the household income survey data for all twenty countries in the Index. Without the tremendous expertise and dedication she brought to the job, the report would be much poorer. The authors also wish to thank Tobias Peter, who worked as an intern with the Global Aging Initiative, for his important contributions to the project, as well as the program’s other talented interns—Brian Hen-derson, Laura mansfield, Travis mills, and Lin Sun Oo.
The authors are grateful to Prudential plc for funding the project and for offering strategic assis-tance at many crucial junctures along the way. In particular, they wish to thank Stephen Whitehead (Group Communications Director) for believ-ing in the project; miles Celic (Director, Group Public Affairs & Policy) for his unflagging support and thoughtful feedback; and Freya Aitken-Turff (manager, International Public Affairs), Philippa Dale-Thomas (Project Coordinator), and méliné Svadjian (Analyst, Public Affairs & Policy) for helping to shepherd the report through the pro-duction process and organize its roll out. They are also grateful to Paul Hancock (Regional Head
of Institutional Business, Funds), Greg Salisbury (Executive Vice President, Jackson National Life), Thomas Hurley (Senior Vice President, market Research & Strategic Development), and Thomas Boardman (Senior Advisor, Financial Services Authority) for their many insightful suggestions.
James H. Graham II (Creative Director, Spark media Group) deserves credit for the attractive report design. Ian Gottesman (Web manager, CSIS) created the project website.
In may 2010, CSIS convened an all-day round-table at which the authors presented their prelimi-nary conclusions. They wish to thank the outside experts who participated for their invaluable in-put: James C. Capretta (Fellow, Ethics and Pub-lic PoPub-licy Center); Louis Enoff (Principal, Enoff Associates, Ltd.); Peter Heller (Senior Adjunct Professor of International Economics, SAIS Johns Hopkins University); Dalmer Hoskins (Special Advisor, U.S. Social Security Administration); Es-telle James (International Consultant on Pension Reform); Rudolph G. Penner (Arjay and Frances miller Chair in Public Policy and Institute Fel-low, Urban Institute); Eugene Steuerle (Richard B. Fisher Chair and Institute Fellow, Urban Insti-tute); and mark Warshawsky (Director of Retire-ment Research, Towers Watson).
While the authors gratefully acknowledge the assistance they received in preparing the report, they are solely responsible for its content.
THE GLOBAL AGING PREPAREDNESS INDEX INTRODUCTION ~
1
INTRODUCTION
There are two forces behind the transforma-tion. The first force is falling fertility. People are having fewer babies, and this decreases the relative number of young in the population. As recently as the mid-1960s, every developed country was at or above the so-called 2.1 replacement rate needed to maintain a stable population from one genera-tion to the next. Today, every developed country is at or below it—and most are far below it. In Italy and Spain the fertility rate is 1.4 and in Germany and Japan it is 1.3.
The trend toward lower birthrates began in the rich world, but has now overtaken most emerg-ing markets as well. Fertility has fallen beneath the replacement rate in all of East Asia—and in Korea and the other Tigers it has dropped to lev-els as low as the lowest in the developed world. Fertility is also far beneath replacement through-out Central and Eastern Europe, and it is near, at, or beneath replacement in all of Latin America’s leading economies. Although it remains higher
elsewhere, it has begun to fall rapidly in South Asia and much of the muslim world.
The second force is rising life expectancy. Peo-ple are living longer, and this increases the relative number of old in the population. Worldwide, life expectancy at birth has increased by twenty-one years since 1950, a bigger gain over the past sixty years than humanity had achieved over the pre-vious six thousand. In the developed world, life expectancy is now in the late seventies to early eighties in every country—and it has reached the same level, or nearly the same level, in some emerg-ing markets. Life expectancy today is 73 in China (up from 41 in 1950), 76 in mexico (up from 51 in 1950), and 79 in Korea (up from 48 in 1950).
Put these two forces together and the result is a dramatic aging of the population. It is today’s developed countries, of course, that are leading the way into humanity’s graying future. For most of history until well into the nineteenth century, the elderly—defined throughout this report as
The Challenge
of Global Aging
T
he world stands on the threshold of a stunning demographic transformation. Itis called global aging, and it promises to reshape virtually every dimension of the economy and society over the next few decades.
2
~ INTRODUCTION THE GLOBAL AGING PREPAREDNESS INDEXadults aged 60 and over—comprised only a tiny fraction of the population, never more than 4 or 5 percent in any country. In the developed countries today, they comprise 22 percent. Three decades from now in 2040, the share is on track to reach 31 percent—and that’s just the average. In Japan and the fastest-aging European countries, it will be approaching or passing 40 percent.
The developing world as a whole is still much younger, but it too is aging—with some coun-tries traversing the entire demographic distance from young and growing to old and stagnant or declining at a breathtaking pace. By 2040, Brazil and mexico will be nearly as old as the United States—and China will be older. Poland will be older than France and the UK, while Korea will be vying with Germany, Italy, and Japan for the title of oldest country on earth. (See Figure 1.)
We live in an era of many challenges, from global warming to global terrorism. But few are as certain as global aging and few are as likely to have such a large and enduring impact on the size and shape of government budgets, on the future growth in living standards, and on the stability of the global econ-omy. Global aging promises to affect everything from business psychology and worker productivity to rates of savings and investment, long-term re-turns to capital, and the direction of global capital flows. Perhaps most fatefully, it could throw into question the ability of societies to provide a de-cent standard of living for the old without placing a crushing burden on the young. It is this “old-age dependency” dimension of the global aging chal-lenge that the current report explores.
Ten or fifteen years ago, global aging barely registered as a policy issue. Today, with large age waves looming just over the horizon in most of the world’s leading economies, it has become the focus of growing concern. many governments are beginning to debate—and some have enacted— major reforms.
most of the concern, especially in the devel-oped world, is focused on the rising fiscal cost of government benefit programs. most developed countries have expensive pay-as-you-go public FIGURE 1
Elderly (Aged 60 and Over),
as a Percent of the Population
in 2007 and 2040
7.2 15.6 9.3 22.2 8.7 22.3 12.2 25.0 17.2 25.4 11.3 27.9 21.8 27.9 18.3 28.5 17.3 28.8 24.0 29.6 18.6 31.5 21.6 31.6 20.2 32.2 22.2 32.7 17.9 33.5 21.9 37.9 14.2 38.6 25.3 39.0 25.7 39.9 28.1 43.3 2007 2040 Japan Italy Germany Korea Spain Poland Switzerland Netherlands France Canada Sweden Russia Australia UK China US Chile Mexico Brazil India 0% 10% 20% 30% 40% 50%THE GLOBAL AGING PREPAREDNESS INDEX INTRODUCTION ~
3
pension systems that were put in place back in the early postwar decades when workers were abun-dant and retirees were scarce, but which have now been rendered unsustainable by the collapse in birthrates and the steady rise in longevity. Graying also means paying much more for health care, be-cause the elderly typically consume at least three times more per capita in acute-care services and at least ten times more in long-term care services than the nonelderly.
Faced with this daunting arithmetic, several countries have dramatically cut the generosity of the “deal” future retirees will receive compared with today’s retirees. France, Germany, Italy, Japan, Poland, and Sweden have all revised the benefit structure of their public pension systems in ways that, over time, are scheduled to result in deep reductions in the share of wages they replace. many countries are also beginning to raise retire-ment ages, especially by closing down no-penalty early retirement options that in some European countries allowed workers to collect full benefits in their mid- or late fifties. At the same time, gov-ernments in many countries are trying to expand existing funded pension systems or jump-start new ones in an effort to fill the income gap left as state provision is scaled back.
meanwhile in the developing world, countries are beginning to worry that they may grow old before they grow rich. Although the rising fiscal burden of pay-as-you-go benefit systems is a major issue in a few countries, notably Brazil and Korea, the most pressing concern is often the growing vul-nerability of the old. many developing countries are aging before they have had time to put in place the social protections of a modern welfare state. In China and India, only a fraction of the workforce is earning a benefit under a pension system, public or private, and the majority of elders still depend heavily on the extended family for support in old age. yet the informal support networks on which elders depend are already under assault by the forces of modernization and will soon come under intense new pressure as populations age and fam-ily size declines. In response, some countries are
putting in place universal public floors of old-age poverty protection (Brazil and Chile), while others are expanding coverage under formal retirement systems (China and India).
Almost everywhere, governments are also con-sidering policies designed to ease the challenge of global aging by altering the underlying demo-graphics themselves. Increasing immigration is one option. Countries like Australia, Canada, and the United States that have high rates of net im-migration—and also do a good job of assimilating new arrivals—have a significant demographic and economic advantage over countries that do not. Not surprisingly, the pros and cons of stepped-up immigration are being debated wherever native-born workforces are projected to stagnate or de-cline in the decades ahead. The issue is even on the table in countries like Korea and Japan that have traditionally valued their ethnic homogene-ity. Typically, policy and business leaders favor higher immigration, especially when it is targeted at skilled workers, while the broader public in many countries is opposed.
There is also surging interest in pronatal poli-cies in low-fertility countries around the world. A few developed countries, most notably France and Sweden, have long had comprehensive pro-natal policy regimes—including cash benefits, subsidized daycare, paid maternity leave, and job guarantees—that make it easier for women to bal-ance jobs and babies. Now even a country like Germany, where any suggestion that government should encourage higher birthrates was politi-cally taboo until a few years ago, is studying and implementing pronatal reforms. In a remarkable about-face, Korea recently redefined the mis-sion of its government family planning bureau from discouraging births to encouraging them. Japan is debating how it can reorient its conserva-tive workplace and family cultures to make them more supportive of working mothers. meanwhile in Russia, Vladimir Putin, citing future economic and security needs, has flatly declared the nation’s birth dearth to be “the most acute problem facing our country today.”
4
~ INTRODUCTION THE GLOBAL AGING PREPAREDNESS INDEXyet despite all the concern about global aging, there ex-ists no satisfactory measure of how well countries worldwide are actually responding to the challenge. Not all national gov-ernments make long-term pro-jections of the fiscal burden of old-age benefit spending, and those that do rarely include all benefit programs. Virtually no government makes any attempt to evaluate how reforms are likely to affect the long-term ad-equacy of elderly income. To be sure, there are many specialized academic studies that evaluate various dimensions of aging or retirement “preparedness” in particular countries. There are also a few broader studies that compare selected indicators, such as retirement ages and re-placement rates, across many countries. But while these
stud-ies are useful, they only give a partial and incom-plete picture.
The purpose of the Global Aging Preparedness Index (or GAP Index) is to provide a more com-prehensive and realistic assessment of the progress that countries are making in preparing for their onrushing age waves. The GAP Index builds on, but refines and expands, an analytical framework first developed by the Center for Strategic and International Studies (CSIS) for a study of “aging vulnerability” in the developed world.1 To assess preparedness, the GAP Index looks at projections of total public benefit spending and total house-hold income by age through the year 2040. The Index covers twenty countries, including most major developed countries and a selection of eco-nomically important emerging markets for which adequate data were available.
1 Richard Jackson and Neil Howe, The 2003 Aging Vulnerability Index: An
Assess-ment of the Capacity of Twelve Developed Countries to Meet the Aging Challenge
(Washington, DC: CSIS and Watson Wyatt Worldwide, March 2003).
The overall GAP Index con-sists of two separate subindi-ces—the “fiscal sustainability index” and the “income ad-equacy index.”
On the fiscal side, the GAP Index begins by looking at pro-jections of public old-age ben-efit spending, including both pensions and health benefits. But the Index also goes further. It takes into account the differ-ing fiscal room that countries have to accommodate their growing old-age dependency burdens by raising taxes, cut-ting other spending, or borrow-ing. It also considers the degree of elderly dependence on public benefits in different countries, which may be a crucial factor in determining how politically easy or difficult it will be to en-act new cost-cutting reforms— or indeed, to follow through on reforms that have already been enacted but not yet phased in.
On the adequacy side, the GAP Index tracks trends in the living standard of the elderly rela-tive to the nonelderly in each country based on income projections that factor in the impact of changes in public benefit programs, private pen-sion provipen-sion, and labor-force participation rates. It also includes indicators that measure the ro-bustness of old-age safety nets and family support networks, which play a crucial role in retirement security in many emerging markets and some de-veloped countries.
Chapter 1 of the report describes the overall structure of the GAP Index in more detail and briefly explains the key assumptions underlying the projections. Chapter 2 discusses the fiscal sus-tainability index and the individual indicators that comprise it—why they were selected, how they are calculated, and what they reveal. Chapter 3 does
GAP Index Countries
Australia Brazil Canada Chile China France Germany India Italy Japan Korea Mexico Netherlands Poland Russia Spain Sweden Switzerland UK United States
THE GLOBAL AGING PREPAREDNESS INDEX INTRODUCTION ~
5
the same for the income adequacy index. Chapter 4 then gathers together the strands of the story and assesses the potential payoff of key reform strategies in different countries.
The story contains both good news and bad news. The bad news is that very few countries score well on both the fiscal sustainability and in-come adequacy indices. Countries that score well on income adequacy generally have costly public old-age benefit systems, while countries that score well on fiscal sustainability tend to have relatively low elderly living standards. The good news is that there are exceptions. Australia, which combines a low-cost, means-tested floor of public old-age support with a large, mandatory, and fully funded private pension system, scores in the top half of both indices. So does Chile, which has a similar mix of retirement policies. There are also a few countries that are clearly moving in the right di-rection. Germany and Sweden, for instance, have
scheduled deep reductions in the generosity of their public pension systems, but appear to be on track to fill in the resulting income gap by extend-ing work lives and increasextend-ing funded retirement savings. Although their fiscal burdens remain high, they have been cut well beneath what they would otherwise be without undermining adequacy.
The GAP Index also suggests that demogra-phy need not be destiny. Japan, which must cope with a massive age wave, nonetheless scores in the middle of both the fiscal sustainability and income adequacy indices. France, which by com-parison faces a relatively benign demographic future, scores toward the bottom of both indices. The lesson is that policy choices make a critical difference. It is in the hope of stimulating debate and focusing attention on the need for construc-tive reform that we offer this first edition of the Global Aging Preparedness Index.
THE GLOBAL AGING PREPAREDNESS INDEX CHAPTER ONE ~
7
CHAPTER ONE
The most important assumption is that current retirement policies and behavior in each country will remain unchanged in the future. There are only two significant exceptions to this “no change” rule. The GAP Index projections fully reflect the future impact of retirement policy reforms, from changes in benefit formulas to changes in retire-ment ages, that have already been enacted into law but are being phased in over time. They also incor-porate certain highly predictable cohort effects. If private pension coverage rates have been rising among younger workers, as is the case in several Index countries, the increase in pension coverage is ultimately reflected in an increase in pension receipt among the elderly. Similarly, if labor-force participation rates have been rising among work-ers in their fifties and sixties, as is also the case in several Index countries, that increase is assumed to translate with a lag into an increase in labor-force participation among workers in their sixties and seventies. The projections, however, do not
include additional policy or behavioral responses beyond those that are already in the pipeline.
The GAP Index uses a no-change baseline be-cause it is designed to serve as a “stress test” of current retirement policy. Its purpose is not to forecast where countries will end up, but rather to show where they are heading on their current course—and hence, by implication, the magnitude of the policy and behavioral responses that may be required to ensure a satisfactory outcome. Try-ing to anticipate these responses and build them into the baseline would obscure the very need for reform that the Index is designed to highlight.
The Index projections extend from 2007 through the year 2040. We selected 2007 as the base year not only because it is the most recent year for which many data series are available, but also because we wanted to use a snapshot of the “present” that is not distorted by the current eco-nomic crisis when comparing near- and long-term indicator values. The 2040 projection horizon was
T
he Global Aging Preparedness Index offers many new insights into one of thegreatest challenges of our time. Before examining the results, however, it is essential to understand the scenario and assumptions that underlie the projec-tions. While the overview that follows covers the critical issues, the interested reader may wish to consult the technical appendix for additional details.
The GAP Index
Framework
8
~ CHAPTER ONE THE GLOBAL AGING PREPAREDNESS INDEXselected because the “demographic transition” in most Index countries will by then be largely complete. Even after 2040, rising longevity will continue to push the old-age dependency burden steadily upward. But in most countries, the era of swiftest aging will occur between the mid-2010s and the mid-2030s, as the collapse in fertility rates that has occurred over the past few decades hol-lows out the bottom of the population pyramid and as the retirement of large postwar baby boom generations broadens the top. A country that can successfully navigate the demographic rapids over the next three decades will, presumably, be quite prepared to manage the gentler current thereafter. A country that fails to meet the challenge by 2040 may be far more concerned with confronting the destructive legacy of that failure, from high tax levels to runaway debt, than with managing any new demographic developments after 2040.
It is also worth stressing that the demographic projections—or more precisely, the relevant de-mographic outcomes—are virtually locked in over the next thirty years. Even if fertility, the main driver of demographic aging, were suddenly to surge, it would have a negligible impact on the projected size of the working-age population or the ratio of workers to retirees until 2035 or 2040. Demography is like an ocean liner. Once it is steaming full speed ahead, it takes a long time to turn around. Beyond 2040, however, unexpected demographic changes could significantly alter the Index results.
In the near term, our projections naturally fac-tor in the impact of the global economic crisis that began in 2008. Although the base year for the Index is 2007, the projection model incorporates actual 2008 and 2009 economic and fiscal data. For 2010 and 2011, the model follows the near-term projections published by the OECD or, for non-OECD members, projections published by the IMF or national governments. Between 2012 and 2015, the model assumes that the economic per-formance and fiscal stance of each country return to pre-crisis “normalcy.” As a result of the crisis, GDP is of course lower and the public debt higher
than they would otherwise have been. Unemploy-ment, productivity, and government taxation and spending, however, all return to pre-crisis levels. Our assumption of a complete and relatively rapid return to normalcy may be optimistic. To the ex-tent that the crisis lingers, the projections in this report may underestimate the economic and fiscal challenge that many countries face.
In the long term, we make no attempt to model future business cycles. On the economic side, we use a standard global GDP projection model that assumes a gradual convergence in productivity growth rates across countries. On the fiscal side, we make two critical assumptions designed to iso-late the impact of demographic aging on public budgets.
The first assumption is that, after the initial 2010–2015 transition period, each country adopts a long-term policy of “debt neutrality”—that is, each country moves toward a government deficit (or surplus) which, when continued unchanged as a share of GDP, would keep net government debt unchanged as a share of GDP. We assume that each country will achieve its new budget balance by an increase (or decrease) in taxes combined with an equal decrease (or increase) in government spend-ing. While unrealistic as a short- or medium-term forecast, debt neutrality is a standard assumption in long-term budget models. Governments cannot indefinitely accumulate debt—and it is doubtful that they can indefinitely accumulate assets either. To suppose that they can would obscure the true impact of demographic aging on the future fiscal burden.
We considered making—but decided against— an exception for countries that are targeting bud-get surpluses as a partial solution to the aging challenge. The historical failure of governments throughout the world to validate retirement “trust-fund” savings by running sustained gen-eral government surpluses raises serious ques-tions about the feasibility of this strategy. Unless retirement savings are personally owned or con-tractually based, there is nothing to prevent gov-ernments from spending, borrowing against, or
THE GLOBAL AGING PREPAREDNESS INDEX CHAPTER ONE ~
9
The public pension projections used in the In-dex are based on the specific benefit rules in each country and, as already indicated, take into ac-count reforms that have been enacted but not yet phased in. Whenever possible we rely on official projections by national governments or, for EU-member countries, the European Commission. The health benefit projections, which were made by CSIS, are based on a standard methodology. The projections reflect the impact of demographic ag-ing itself, which alone will push up spendag-ing as a share of GDP as more of the population moves into the older and higher-cost age brackets. They also take into account the fact that advances in medical technology and rising public expectations about care and cure are pushing up per capita costs at all ages faster than per capita GDP in most countries. It is the interaction of this “excess cost growth” with demographic aging that makes health-care spending such an explosive component of the old-age dependency burden.
In order to assess trends in income adequacy, the GAP Index also includes projections of to-tal income by age. The model divides household income into five broad categories: employment income, asset income other than funded pension income, funded pension income, public benefits, and family transfers. We treat funded pensions as a special class of assets because they are explicitly designed to provide retirement income, are often intended to substitute in whole or in part for pay-as-you-go public pension benefits, and are grow-ing in importance in many countries. The Index definition of funded pensions is fairly broad. They include public programs and private programs, mandatory schemes and voluntary schemes, employer pensions and personal pensions, and annuities and lump-sum payments. The Index projections of funded pension benefits, most of which were made by CSIS, are based on a detailed analysis of recent trends and policy reforms in each country. Other types of privately earned income are projected according to stylized rules that are described in the technical appendix. otherwise nullifying the savings. In any case, only
two of the twenty Index countries—Canada and Korea—have announced plans to pursue such a policy on a significant scale. If we factored their trust-fund savings into the projections, it would push Canada up by one place and Korea by five places in the fiscal sustainability index. Naturally, it would have no impact on their rankings in the income adequacy index.
The second assumption is that, once debt neu-trality is achieved, nonbenefit government spend-ing will remain constant as a share of GDP and taxes will be raised (or lowered) in each future year in accordance with the projected change in benefit spending. In most countries, of course, this means that taxes must be raised in every year. This rising tax assumption is only relaxed for two indicators—the “budget room” and “borrowing room” indicators—where the object is to assess the feasibility of alternative means of paying for the growth in old-age benefit costs.
The Index model divides government benefits into three categories: public pensions, health bene-fits, and other benefits. The public pension category includes all social insurance retirement and sur-vivors benefits, means-tested retirement benefits, and government employee pensions — provided that they are financed primarily on a pay-as-you-go basis. If public pension systems are funded and benefits are personally owned (as the personal accounts systems are in Chile, mexico, Poland, and Sweden) or contractually based (as govern-ment employee pensions are in some countries), benefits are considered economically equivalent to funded private pension benefits and are not in-cluded in the government benefit projections. The rationale is simple: Whether funded pensions are constituted as public or private programs, they represent a return on retirees’ prior savings and do not impose a burden on current workers. The health benefits category includes both acute care and long-term care. The other benefits category includes everything else, from disability benefits to unemployment benefits and housing benefits.
10
~ CHAPTER ONE THE GLOBAL AGING PREPAREDNESS INDEXThroughout the Index, the “elderly” are defined as persons aged 60 and over, the “nonelderly” as persons under age 60. The income of each age group refers to the income of individuals within that age group, with the exception of spouses of heads of households, who are considered to be-long to the same age group as the head of house-hold. In households containing both elderly and nonelderly persons who are not spouses, income is split between the two age groups. Such income sharing is very common in most developing and a few developed countries like Italy, Spain, and Japan, where the elderly and their adult children often live together.
The threshold between elderly and nonelderly may strike some readers as early, since in today’s developed countries most sixty-year-olds seem relatively “young.” The threshold, however, is not meant to indicate anything about health, capacity, or vigor. Nor does it mean that the GAP Index assumes that all adults under age 60 work and all adults over age 60 are retired. The model takes into account actual patterns of employment in each country. To the extent that the nonelderly do not work (because they are students or stay-at-home moms), the projections reflect this; to the extent that the elderly do work (because they are not retired or only semiretired), the projections also reflect this. However, we require some fixed dividing line between young and old in order to compare intergenerational transfer burdens and relative income adequacy across countries and across time. Age 60 was chosen because it is now close to the typical age of retirement on public benefits in most countries—much closer, in fact, than age 65.
The GAP Index measures the performance of countries relative to each other rather than against some absolute standard of “preparedness.” We considered establishing such a standard, but concluded that any absolute benchmark would be arbitrary. There is no real consensus within countries, much less across countries, about what constitutes an acceptable old-age benefit burden on workers or an acceptable living standard for
retirees. yet almost everyone would agree that the lower the worker burden is and the higher the retiree living standard is the more prepared the country is.
As already explained, the overall Global Ag-ing Preparedness Index consists of two separate subindices—the fiscal sustainability index and the income adequacy index. The subindices in turn are based on indicators grouped into distinct cat-egories, each dealing with a different dimension of the challenge.
Fiscal Sustainability Index
j
PUBLIC BURDEN. This category contains two indicators that measure the sheer magnitude of each country’s projected public old-age dependency burden.j
FISCAL ROOM. This category contains three indicators that measure each country’s ability to accommodate the growth in its public old-age depen-dency burden by raising taxes, cut-ting other spending, or borrowing.j
BENEFIT DEPENDENCE. This category contains two indicators that measure how dependent the elderly in each country are on public benefits and thus how politi-cally difficult it may be to reduce those benefits beneath current law—or even to carry out reductions in benefits that are already scheduled to take place.Income Adequacy Index
j
TOTAL INCOME. This category contains two indicators that measure the overall level of and trend in the income of the elderly relative to the nonelderly in each country.j
INCOME VULNERABILITY. This category contains three indicators—two that measure income adequacy for “middle class” elders in each country, a group that will be disproportionately affected by changes in the generosity of retire-ment income systems, and one that measures the extent of elderly poverty.THE GLOBAL AGING PREPAREDNESS INDEX CHAPTER ONE ~
11
j
FAMILY SUPPORT. This category contains two indicators that measure the robustness of family support networks in each country. For each of the subindices, the country rank-ings are calculated as follows. We first tabulate the results for individual indicators, ranked from one (best) to twenty (worst). We then transform the in-dicator results into index values. For each indica-tor, the mean result is set to an index value of 50; results that lie above and below the mean by one standard deviation are set, respectively, to index values of 100 and zero. The indicator index values thus preserve the indicator rankings while also re-flecting the relative distance of each ranked coun-try, positively or negatively, from the “center of the pack.” We next combine the indicator index values into category scores, which are used to determine the category rankings. Finally we combine the cat-egory scores into overall scores and rankings foreach of the two subindices. The weights given to each indicator and category are described in the technical appendix.
We considered but rejected the idea of combin-ing the two subindices into a scombin-ingle comprehensive index. Because the Global Aging Preparedness In-dex includes countries at such different stages of economic development, averaging the results for fiscal sustainability and income adequacy might obscure more than it illuminates. Consider: many developing countries have low fiscal burdens and low income adequacy, while many developed countries have average fiscal burdens and average income adequacy. In a combined index, these two groups of countries would have similar rankings, though it is not at all clear that they are similarly prepared to meet the aging challenge. On the other hand, the meaning of the rankings in the separate fiscal sustainability and income adequacy indices is perfectly clear.
THE GLOBAL AGING PREPAREDNESS INDEX CHAPTER TWO ~
13
CHAPTER TWO
Category One:
Public Burden
The public burden category includes two indict-ors that track the claim that public old-age benefits will place on society’s total economic resources:
j
BENEFIT LEVEL: Total public benefits tothe elderly in 2040 as a percent of GDP
j
BENEFIT GROWTH: The growth in to-tal public benefits to the elderly as a percent of GDP from 2007 to 2040As Table 1 (on page 14) shows, there is an enor-mous variation in the public old-age dependency
burden across the twenty countries in the GAP Index. Today’s emerging markets generally have low public burdens compared with the fully devel-oped economies, both because they have relatively young populations and because coverage un-der their public benefit systems is often far from universal. The high-cost exceptions are Poland, which has a typical European age profile, and Bra-zil, which spends lavishly on public pensions even though it is still demographically a young country. Total old-age benefits in Brazil weighed in at 9 percent of GDP in 2007, compared with 2 percent in India and mexico and 3 percent in Korea and China. Old-age benefits in most emerging mar-kets are projected to grow rapidly as their
popula-The Fiscal
Sustainability Index
T
he late Herb Stein, a former chairman of the U.S. Council of EconomicAd-visers, was fond of saying that things that are unsustainable tend to stop. The GAP fiscal sustainability index cannot tell us when different countries will take action to slow the growth in old-age dependency costs, much less what form the action will take. What it does provide is a comprehensive measure of the fiscal risks they face. The public burden indicators, which focus on the projected magnitude of the old-age dependency burden if current law remains in force, are presented first. The fiscal room indicators, which focus on how easily each country can accommodate the growth in that burden, are presented second. The benefit dependence indicators, which focus on how politi-cally difficult it may be for countries to reduce that burden—or indeed, to keep the burden from rising even faster than current law would dictate—are presented last.
14
~ CHAPTER TWO THE GLOBAL AGING PREPAREDNESS INDEXtions age, nearly doubling in India, nearly tripling in China, and quadrupling in Korea. Even so, only Brazil, where they are projected to reach 20 percent of GDP, will rank among the ten highest-burden countries in 2040.
Even within the developed world, there is a wide spread in outcomes. Total old-age benefits in Canada, Australia, the United States, Switzer-land, the UK, Japan, and Sweden are projected to grow to between 15 and 20 percent of GDP by 2040. In Germany, the Netherlands, France, Italy, and Spain, they are projected to grow to between 22 and 26 percent of GDP. The differences are due in part to demographics and in part to the varying generosity of benefit systems, especially pensions. The lower-burden English-speaking countries both spend less per capita on old-age benefits and
are due to age less. Switzerland spends relatively little on old-age benefits by European standards, and though Sweden spends heavily today it has enacted an overhaul of its pension system de-signed to keep benefits from rising much in the future and also has a relatively low rate of growth in health-care spending. Japan is a special case: It faces a massive age wave, but its pension ben-efits are already less than generous and are sched-uled to be reduced even further in the future. The higher-burden countries of continental Europe generally have the most expensive public old-age benefit systems and the fastest-aging populations.
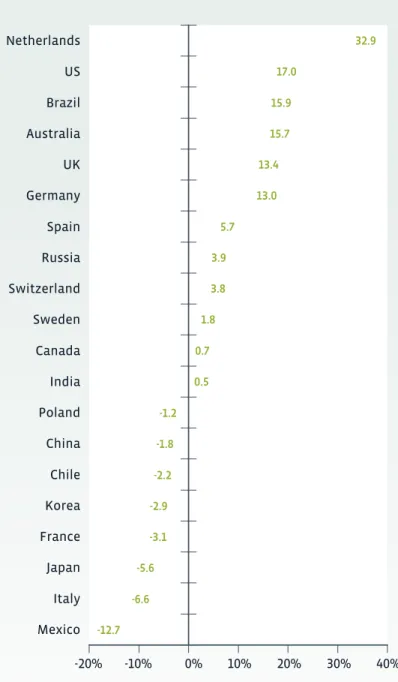
Contrary to what some readers may suppose, pensions and other cash benefits—not health benefits—account for most of the total projected old-age spending burden in 2040. On average
Total Public Benefits to the Elderly,
as a Percent of GDP, 2007–2040
TABLE 1 Country Ranking % of GDP 2007 2020 2030 2040 1 India 1.9 3.1 4.2 3.6 2 Mexico 2.4 3.2 3.9 5.1 3 Chile 6.0 6.8 7.0 7.5 4 China 2.8 4.6 6.1 8.0 5 Russia 5.8 7.5 8.7 10.2 6 Poland 10.1 12.0 13.1 13.9 7 Korea 3.4 7.5 11.0 14.1 8 Canada 8.3 10.9 13.2 14.7 9 Australia 8.9 10.7 12.9 14.9 10 US 8.9 12.5 15.1 16.3Note: Countries are ranked from best to worst according to the projection results for 2040.
Country Ranking % of GDP 2007 2020 2030 2040 11 Switzerland 9.8 12.6 15.7 17.4 12 UK 12.1 14.0 16.4 18.2 13 Japan 14.1 15.4 15.9 18.4 14 Sweden 15.7 16.6 18.1 19.2 15 Brazil 8.8 12.5 16.3 20.4 16 Germany 15.8 17.3 20.0 21.7 17 Netherlands 12.0 15.7 20.0 23.2 18 France 16.6 19.4 21.8 23.5 19 Italy 18.0 19.9 22.3 24.7 20 Spain 14.3 17.0 20.6 26.1
THE GLOBAL AGING PREPAREDNESS INDEX CHAPTER TWO ~
15
across all twenty Index countries, health benefits represent 38 percent of the total burden. In only three countries do they represent more than half: Canada (52 percent), mexico (55 percent), and the United States (57 percent). Health benefits, however, do account for a disproportionate share of the projected growth in total old-age benefit spending. In twelve of the countries, the share is more than 50 percent and in six of the countries it is more than 60 percent. In one country—Chile— health benefits account for more than 100 percent of the growth, since cash benefits to the elderly are actually projected to decline as a share of GDP. (Detailed projections of public benefits by type are available at gapindex.csis.org.)
Although the rankings for the benefit level and benefit growth indicators are similar for most countries, there are some important differences. (See Figure 2.) A few countries, notably Korea and the United States, score much better on level than on growth. In the case of Korea, the dif-ference is dramatic: a ranking of seven versus a ranking of seventeen. The explanation lies mainly in Korea’s unusually severe demographics. Its public pension system is not especially generous and leaves large gaps in coverage, but the elderly share of its population is projected to soar from 14 percent in 2007 to 39 percent in 2040, by far the largest increase of any country in the Index. The United States, in contrast, faces a relatively mild aging trend. It is the youngest of the developed countries today, and thanks to its relatively high fertility rate and substantial net immigration, it will (despite the retirement of its large baby boom generation) still be the youngest in 2040. The gen-erosity of its public pension system is also mod-est by developed-world standards. What gives the United States its fifteenth-place ranking on ben-efit growth is its exceptionally rapid rate of growth in health-care spending.
There are also a number of countries that score significantly better on growth than on level, nota-bly Sweden (ten rankings higher), Germany (seven higher), Japan (seven higher), Italy (six higher), and France (four higher). All have enacted reforms
FIGURE 2
Growth in Total Public
Benefits to the Elderly
from 2007 to 2040,
as a Percent of GDP
US UK 11.8 11.6 11.2 10.7 7.6 7.4 6.8 6.6 6.4 6.1 6.0 5.9 5.2 4.4 4.3 3.8 3.5 2.7 1.6 1.5Note: Countries are ranked from best to worst.
Spain Brazil Netherlands Korea Switzerland France Italy Canada Australia Germany China Russia Japan Poland Sweden Mexico India Chile 0% 2% 4% 6% 8% 10% 12% 14%
16
~ CHAPTER TWO THE GLOBAL AGING PREPAREDNESS INDEXin recent years that are scheduled to cut average public pension benefits relative to average wages over the next few decades. Sweden and Italy are transforming their traditional defined-benefit sys-tems into notional defined-contribution syssys-tems in which benefit payouts are effectively indexed to the growth in the payroll tax base. France has re-indexed its second tier ARCO and AGIRC pensions to prices, which again means that average benefits will decline as share of average wages. Germany and Japan have introduced “demographic stabi-lizers” that will have much the same effect. These countries spend a lot on old-age benefits today and will spend even more tomorrow. But total
spending will grow much less than the aging of their populations would otherwise require.
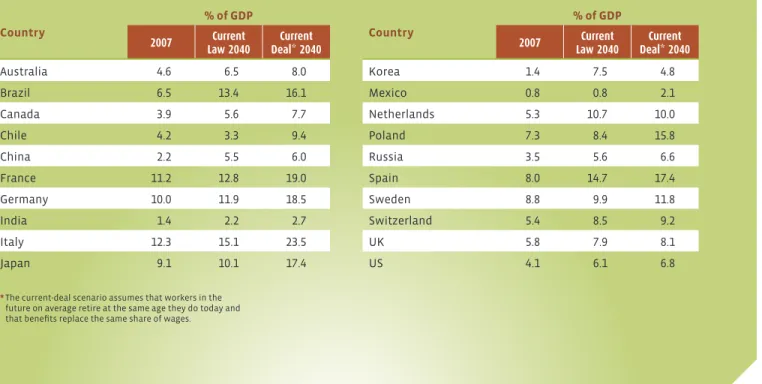
Table 2 compares the current-law public pen-sion projections used in the GAP Index with an alternative “current-deal” scenario that assumes that the average retirement age in each country will remain unchanged in the future and that ben-efits will continue to replace the same share of wages they do today. As can be seen, scheduled reductions in the generosity of public pension systems are indeed large in many countries. In France, pension spending as a share of GDP will be 33 percent less in 2040 under the current-law pro-jection than the current-deal propro-jection. In Italy
Public Pension Benefits to the Elderly,
as a Percent of GDP in 2007 and 2040:
Current-Law versus Current-Deal Scenario*
TABLE 2
Country
% of GDP
2007 Law 2040Current Deal* 2040Current
Australia 4.6 6.5 8.0 Brazil 6.5 13.4 16.1 Canada 3.9 5.6 7.7 Chile 4.2 3.3 9.4 China 2.2 5.5 6.0 France 11.2 12.8 19.0 Germany 10.0 11.9 18.5 India 1.4 2.2 2.7 Italy 12.3 15.1 23.5 Japan 9.1 10.1 17.4
* The current-deal scenario assumes that workers in the future on average retire at the same age they do today and that benefits replace the same share of wages.
Country
% of GDP
2007 Law 2040Current Deal* 2040Current
Korea 1.4 7.5 4.8 Mexico 0.8 0.8 2.1 Netherlands 5.3 10.7 10.0 Poland 7.3 8.4 15.8 Russia 3.5 5.6 6.6 Spain 8.0 14.7 17.4 Sweden 8.8 9.9 11.8 Switzerland 5.4 8.5 9.2 UK 5.8 7.9 8.1 US 4.1 6.1 6.8
THE GLOBAL AGING PREPAREDNESS INDEX CHAPTER TWO ~
17
and Germany it will be 36 percent less and in Ja-pan 42 percent less. Very large benefit reductions are also scheduled in Poland, Chile, and mexico, but in these countries pay-as-you-go public pen-sions are being replaced in whole or in part with funded personal accounts.
The benefit level and benefit growth indicators both add an important and different
perspec-tive to the Index. The absolute spending level as a share of GDP is clearly the simplest measure of the total resource burden that demographic ag-ing threatens to impose on the economy. yet the rise in spending is also important, since some so-cieties may be institutionally and culturally better equipped to handle high levels of public benefit spending than others. From this perspective, the
Public Burden Category
TABLE 3
Category Ranking and Score Benefit Level Indicator (%) Benefit Growth Indicator (%)
1 India 135 1 India 3.6 1 Chile 1.5
2 Mexico 121 2 Mexico 5.1 2 India 1.6
3 Chile 120 3 Chile 7.5 3 Mexico 2.7
4 China 89 4 China 8.0 4 Sweden 3.5
5 Russia 87 5 Russia 10.2 5 Poland 3.8
6 Poland 78 6 Poland 13.9 6 Japan 4.3
7 Sweden 60 7 Korea 14.1 7 Russia 4.4
8 Australia 57 8 Canada 14.7 8 China 5.2
9 Japan 56 9 Australia 14.9 9 Germany 5.9
10 Canada 54 10 US 16.3 10 Australia 6.0
11 UK 43 11 Switzerland 17.4 11 UK 6.1
12 US 40 12 UK 18.2 12 Canada 6.4
13 Switzerland 34 13 Japan 18.4 13 Italy 6.6
14 Germany 31 14 Sweden 19.2 14 France 6.8
15 Korea 22 15 Brazil 20.4 15 US 7.4
16 France 17 16 Germany 21.7 16 Switzerland 7.6
17 Italy 14 17 Netherlands 23.2 17 Korea 10.7
18 Brazil -9 18 France 23.5 18 Netherlands 11.2
19 Netherlands -17 19 Italy 24.7 19 Brazil 11.6
20 Spain -33 20 Spain 26.1 20 Spain 11.8
INDICATOR KEY
Benefit Level Indicator = Total public benefits to the elderly in 2040 as a percent of GDP
Benefit Growth Indicator = Growth in total public benefits to the elderly from 2007 to 2040 as a percent of GDP
18
~ CHAPTER TWO THE GLOBAL AGING PREPAREDNESS INDEXroad ahead for Korea or the United States may be just as bumpy as for some countries that are projected to spend much more.
Table 3 (on page 17) summarizes the results for the public burden category. Not surprisingly, In-dia, which has the youngest population and the least-developed welfare state of any country in the Index, ranks first. Spain, which is both one of Eu-rope’s fastest-aging countries and one of the few that has yet to undertake any significant reform of its public pension system, ranks last. In calcu-lating the category results, both indicators were weighted equally.
Category Two:
Fiscal Room
The first indicator category focused on the pro-jected resource burden of rising old-age benefit spending. While a large and growing burden is certainly a cause for concern, the magnitude of the burden alone does not tell us whether it is sustainable. It is also crucial to look at the fiscal room that different countries have available to ac-commodate the burden. There are three ways in which countries can adjust to higher old-age ben-efit spending: pay for the growth by raising taxes,
Total Government Revenue as a Percent of
GDP, Assuming Taxes Are Raised to Pay for
All Growth in Public Benefits, 2007–2040*
TABLE 4 Country Ranking % of GDP 2007 2020 2030 2040 1 India 23.5 23.8 25.1 24.2 2 Mexico 22.6 22.9 23.4 24.4 3 Chile 29.5 26.4 26.4 26.9 4 China 21.7 23.9 25.2 27.2 5 Japan 33.5 33.7 34.0 36.2 6 Poland 40.3 39.4 39.8 40.4 7 Russia 40.0 38.0 38.9 40.5 8 Switzerland 33.9 35.9 38.8 40.6 9 Australia 35.7 36.6 38.7 40.6 10 US 34.0 37.6 40.3 41.7
Note: Countries are ranked from best to worst according to the projection results for 2040.
* The projections assume that, beginning in 2015, each country moves to a debt-neutral fiscal balance in its “rest of government” budget.
Country Ranking % of GDP 2007 2020 2030 2040 11 Korea 33.3 36.4 39.4 42.3 12 Canada 40.7 41.5 43.5 45.0 13 UK 41.4 43.2 45.4 47.4 14 Brazil 34.8 39.6 43.5 47.4 15 Germany 43.9 43.9 45.8 47.5 16 Spain 41.1 42.4 45.6 50.3 17 Italy 46.4 47.7 49.5 51.4 18 Netherlands 45.7 47.8 51.5 54.7 19 France 49.6 52.4 54.6 56.3 20 Sweden 56.3 55.1 56.3 57.4
THE GLOBAL AGING PREPAREDNESS INDEX CHAPTER TWO ~
19
pay for the growth by cutting other government spending, or pay for the growth by borrowing. The fiscal room category includes three indica-tors that evaluate the feasibility of these strategies:
j
TAX ROOM: Total government revenue in2040 as a percent of GDP (This
indica-tor assumes that all benefit growth is paid for by raising taxes.)
j
BUDGET ROOM: Total public benefits to the elderly in 2040 as a percent of govern-ment outlays (This indicator assumesthat all benefit growth is paid for by cuts in other government spending.)
j
BORROWING ROOM: The net public debt in 2040 as a percent of GDP (Thisindica-tor assumes that all benefit growth is paid for by government borrowing.)
Let us begin with the tax option. Not surpris-ingly, countries with the largest projected old-age dependency burdens tend to end up with the larg-est tax burdens. (See Table 4, on page 18.) Since the overall tax burden also depends on the overall size of the public sector, however, there are some exceptions. A few countries with large public sec-tors score much worse on tax room than they do on the public burden indicators. Sweden, for ex-ample, ranks seventh overall in the public burden category, but twentieth on tax room. For a few other countries with large old-age dependency burdens but relatively small public sectors, the re-verse is true. Switzerland ranks thirteenth in the public burden category, but eighth on tax room.
In many countries, the tax option would lead to total tax burdens that are considerably higher than today’s. In 2007, only ten of the Index countries had a total tax burden of more than 40 percent of GDP and only one—Sweden—had a total tax burden of more than 50 percent of GDP. By 2040, fifteen would have a total tax burden of more than 40 percent of GDP, including such traditionally low-tax countries as Australia, Korea, Switzer-land, and the United Sates. Five countries, all in
FIGURE 3
Total Public Benefits to
the Elderly as a Percent of
Government Outlays in 2007
and 2040, Assuming Cuts in
Other Spending Pay for All
Growth in Public Benefits*
2007 2040 6.7 12.5 10.2 21.2 17.3 27.9 29.2 30.9 24.0 33.3 29.9 35.5 21.2 36.3 12.6 36.3 27.4 41.2 26.0 42.5 24.2 44.1 31.8 44.9 12.0 46.4 36.3 48.8 26.3 50.1 37.7 51.0 39.2 51.0 30.4 52.6 23.8 55.6 36.4 64.0
Note: Countries are ranked from best to worst
according to the projection results for 2040.
* The projections assume that, beginning in 2015, each country moves to a debt-neutral fiscal balance in its “rest of government” budget.
0% 10% 20% 30% 40% 50% 60% 70% Spain Brazil Switzerland Japan Italy Netherlands Germany Korea France US Australia UK China Canada Sweden Poland Chile Russia Mexico India
20
~ CHAPTER TWO THE GLOBAL AGING PREPAREDNESS INDEXEurope, would have a total tax burden of more than 50 percent of GDP.
Some European countries may literally find it impossible to raise taxes enough to pay for the full cost of their age waves. At some point, rather than generate new revenue, higher tax rates may simply slow the economy, exacerbate unemployment, and push more workers into a growing gray economy. The tax option may also prove unsustainable in some emerging markets with fast-growing old-age dependency burdens. most emerging markets start with relatively small public sectors and so would seem to have an advantage. This advantage may be more apparent than real, however, since many also
have large informal sectors which by definition can-not be taxed. While the developed countries may have difficulty pushing total taxation above 50 per-cent of GDP, emerging markets like Korea and Bra-zil may have difficulty pushing it above 40 percent. To the extent that taxes cannot be raised, coun-tries may be able to accommodate the growing burden of old-age benefit spending by reducing other categories of government spending. The budget room indicator looks at what would hap-pen if, instead of raising taxes, governments sim-ply allowed old-age benefits to crowd out other spending “dollar for dollar.” By 2040, benefits to the elderly would account for over 40 percent of
Net Public Debt as a Percent of GDP,
Assuming that Borrowing Pays for All
Growth in Public Benefits, 2007–2040*
TABLE 5 Country Ranking % of GDP 2007 2010 2015 2040 1 Chile -13.7 -14.5 -26.0 -31.1 2 Sweden -25.0 -12.9 -14.1 17.8 3 Russia 0.0 1.6 -6.2 32.0 4 China 1.7 -1.5 -1.1 39.0 5 Mexico 31.4 44.4 43.0 66.8 6 Poland 17.0 32.4 41.7 70.1 7 Australia -6.6 -1.1 1.3 73.9 8 Korea -35.8 -33.4 -36.8 87.4 9 Switzerland 11.0 9.3 5.8 98.9 10 Canada 23.1 32.6 32.7 104.8
Note: Countries are ranked from best to worst according to the projection results for 2040.
* The projections assume that, beginning in 2015, each country moves to a debt-neutral fiscal balance in its “rest of government” budget. † Data for India refer to gross debt.
Country Ranking % of GDP 2007 2010 2015 2040 11 India † 78.3 84.6 80.0 108.0 12 Germany 42.9 54.7 56.7 127.2 13 Japan 80.4 104.6 114.9 133.6 14 France 34.0 60.7 73.5 149.2 15 UK 28.8 58.3 76.9 152.6 16 Italy 87.1 100.8 103.6 168.2 17 Netherlands 28.0 36.5 41.3 169.1 18 Spain 18.7 41.6 49.2 175.1 19 Brazil 42.0 37.3 37.2 175.2 20 US 42.3 65.0 76.2 179.0