T
T
H
H
È
È
S
S
E
E
En vue de l'obtention du
D
D
O
O
C
C
T
T
O
O
R
R
A
A
T
T
D
D
E
E
L
L
’
’
U
U
N
N
I
I
V
V
E
E
R
R
S
S
I
I
T
T
É
É
D
D
E
E
T
T
O
O
U
U
L
L
O
O
U
U
S
S
E
E
Dé livré par l'Université Toulouse III - Paul SabatierDiscipline ou spé cialité : Ingénierie des plasmas
JURY
Pré sident Olivier Eichwald Professeur UPS
Rapporteurs Young dong Park Professeur Ajou
Jean-Paul Booth Directeur de Recherche CNRS
Examinateurs Soo-ghee Oh Professeur Ajou
Freddy Gaboriau Maître de Conférences UPS André Ricard Directeur de Recherche CNRS
Ecole doctorale : GEET Unité de recherche : UMR 5213
Directeur(s) de Thè se : Freddy Gaboriau & Soo-ghee Oh Rapporteurs : Jean-Paul Booth & Young-dong Park
Pré senté e et soutenue par Namjun KANG Le 12 juillet 2011
Titre : Modeling and experimental study of low pressure
Abstract
Low pressure inductively coupled plasmas (ICPs) are investigated using theoretical modeling and experimental diagnostic methods. For various ICP discharges, time dependent global (volume averaged) models are developed and a number of diagnostic tools are used.
In a low pressure argon discharge, a new method is proposed to improve the precision of the pressure-dependent electron temperature calculated by the line ratio method. Using the electron energy distribution functions (EEDFs) and the electron density from Langmuir probe, the coefficient of the cascade cross-section are provided as a function of the pressure for argon 4p1 and 4p5. The effective electron temperature calculated by the corrected cascade cross-section is shown and compared with Langmuir probe results.
The production of argon excited states in the afterglow of pulse discharge is investigated. Experimentally time resolved optical emission spectroscopy (OES), optical absorption spectroscopy (OAS) and Langmuir probe are used to measure the emission of highly excited states, metastable atom density, electron density and electron temperature. From the time dependent global model, it is found that during the pulse-on time the electron impact excitation and the ionization from the ground state and Ar (3p54s) are the dominant population processes for all excited states. On the other hand, during the afterglow the main source of all excited states is the three body electron-ion recombination. As a consequence argon highly excited state can be populated more than during the pulse-on time.
The E-H mode transition and hysteresis in low pressure argon inductively coupled discharges are investigated using the previous global model and a transformer model. The total absorbed power by plasma electrons and coil current are calculated as a function of the electron density at fixed injected power. We found that the transition is due to the difference of the absorbed power between the two modes. Moreover the calculation results show that the existence of an inaccessible region between E and H mode, as well as a threshold coil current and a minimum absorbed power for the H mode.
The dissociation of the nitrogen molecule in an Ar-N2 ICP discharge is studied both experimentally and theoretically. Using the two-photon absorption laser-induced fluorescence (TALIF) an increase of the dissociation rate in highly Ar-diluted region is observed. A complete kinetic model is developed to understand the behavior of the Ar-N2 discharge. The calculated results are compared with the measured results, obtaining reasonably good agreement. In pure nitrogen discharge the N atoms are mainly created by electron impact dissociation at low pressure (20 mTorr) while it is due to metastable-metastable pooling dissociation at high pressure (200 mTorr). In Ar-N2 discharge, the N atom density increases despite less amount of N2 molecule in highly Ar-diluted region at 200 mTorr. From the model the charge transfer from Ar+ to N2 is an important source of nitrogen dissociation in Ar-N2 discharge.
The global kinetic models are developed in low pressure He, Ne, Ar and Xe discharges to calculate the electron temperature and the electron density. The calculated results are compared with experiments and the dominant creation sources and the routes of loss for electron and metastable atoms are discussed as function of pressure. Finally the transformer model is used to calculate the electrical properties of He, Ne, Ar and Xe discharges.
Contents
Abstract . . . . i
List of figures . . . . vii
List of tables . . . . xiii
1. General introduction . . . . 1
1.1 The fourth state of matter: plasma . . . 2
1.2 The science of plasma processing . . . 2
1.3 DC glow discharge . . . 6
1.4 High frequency discharge . . . 7
1.5 Aim of this work and outline . . . 9
1.6 References . . . 11
2. Characteristic of ICP discharge . . . . 13
2.1 Introduction . . . 14
2.2 Heating mechanism in RF inductive discharge . . . 14
2.2.1 Effective electrical conductivity and effective collision frequency 14 2.2.2 Classical skin effect . . . 17
2.2.3 Anomalous skin effect . . . 18
2.2.4 Ohmic (collisional) and stochastic (collisionless) heating . . . 20
2.3 The power transferred to the plasma electrons in TCP reactor . . . 21
2.4 Transformer model and plasma impedance . . . 24
2.5 References . . . 28
3. Global (volume averaged) model . . . . 29
3.1 Introduction. . . 30
3.2 Power balance . . . 31
3.2.1 Energy loss by collision . . . 31
3.2.2 Energy loss by diffusion to the wall . . . 32
3.3 Particle balance . . . 35
3.3.1 Electron impact excitation coefficient . . . 35
3.3.2 Radiative decay. . . 35
3.3.3 Diffusion loss. . . 37
3.3.4 Pumping loss . . . 37
4. Survey of plasma diagnostic methods . . . . 41
4.1 Introduction. . . 42
4.2 Optical emission spectroscopy (OES) . . . 42
4.2.1 Principle . . . 42
4.2.2 Emission intensity in the corona model and line ratios method . . 43
4.2.3 Molecular spectroscopy. . . 44
4.2.3.1 Rotational spectra. . . 44
4.2.3.2 Vibrational spectra . . . 46
4.2.3.3 Spectra of diatomic molecules . . . 47
4.2.3.4 Ro-vibrational spectra of N2 and N2+. . . 48
4.3 Optical absorption spectroscopy (OAS) . . . 54
4.4 Two-photon absorption laser-induced fluorescence (TALIF) . . . 56
4.4.1 Principle . . . 57
4.4.2 Measurement of absolute density. . . 57
4.5 Langmuir probe. . . 59
4.6 References . . . 63
5. Low pressure argon ICP discharge . . . . 65
5.1 Introduction . . . 66
5.2 Experimental setup . . . 67
5.3 Determination of the electron temperature in a planar inductive argon plasma with emission spectroscopy and electrostatic probe . . . 68
5.3.1 Measurement of EEPF and optical emission . . . 68
5.3.2 Radiation trapping and line ratio method. . . 70
5.3.3 Pressure dependence of the cascade cross-section . . . 71
5.4 Modeling and experimental study of pulse modulated ICP afterglow: production of Ar highly excited states . . . 74
5.4.1 Experiments. . . 74
5.4.2 Discharge model . . . 78
5.4.3 Results and discussion . . . 80
5.4.3.1 Electron density and electron temperature in continuous mode . . . 80
5.4.3.2 Electron temperature and electron density in pulse mode 81 5.4.3.3 Ar excited states in pulse mode. . . 83
5.5 Modeling of E-H mode transition and hysteresis in low pressure argon ICP discharges . . . 91
5.5.1 E-H mode transition and hysteresis. . . 91
Contents v
5.5.3 Results and discussion . . . 92
5.6 Conclusion . . . 95
5.7 References . . . 97
6. Modeling and experimental study of molecular nitrogen dissociation in an Ar-N2 ICP discharge . . . 101
6.1 Introduction . . . 102
6.2 Experiment . . . 102
6.2.1 Measurement of electron temperature and electron density . . . . 102
6.2.2 Measurement of Ar (3p54s) density and emission intensity . . . . 103
6.2.3 Measurement of atomic nitrogen density by TALIF . . . 104
6.3 Discharge model . . . 106
6.4 Results and discussion . . . 110
6.4.1 Pure nitrogen dischage . . . 110
6.4.2 Ar-N2 discharge. . . 114
6.4.2.1 Electron temperature and charged particles density . . . 114
6.4.2.2 Ar(3p54s) density . . . 117
6.4.2.3 Production of N2(
C
3
u) excited molecules . . . 1176.4.2.4 Production of N(4S). . . 120
6.5 Conclusion . . . 123
6.6 References . . . 129
7. Experimental and electrical characteristics of inductively coupled He, Ne, Ar and Xe discharges . . . 131
7.1 Introduction . . . 132
7.2 Experiment . . . 132
7.3 Global model of pure rare gases . . . 134
7.4 Transformer model . . . 137
7.4.1 Effective collision frequency. . . 138
7.4.2 Skin depth. . . 138
7.4.3 Plasma impedance . . . 139
7.5 Results and discussion . . . 141
7.5.1 Electron temperature and electron density . . . 142
7.5.2 Metastable atoms . . . 144
7.5.3 Plasma impedance . . . 147
7.6 Conclusion . . . 148
7.7 References . . . 152
8. General conclusion . . . 155
Appendix – Electromagnetic field in TCP reactor . . . 159 A.1 Capacitive coupled discharge . . . 160 A.2 Inductive coupled discharge . . . 162
List of Figures
1.1 Space and laboratory plasmas on a log n versus log Te diagram . . . 3
1.2 Transistor counts for integrated circuits plotted against their dates of introduction. The curve shows Moore‟s law; the doubling of transistor counts
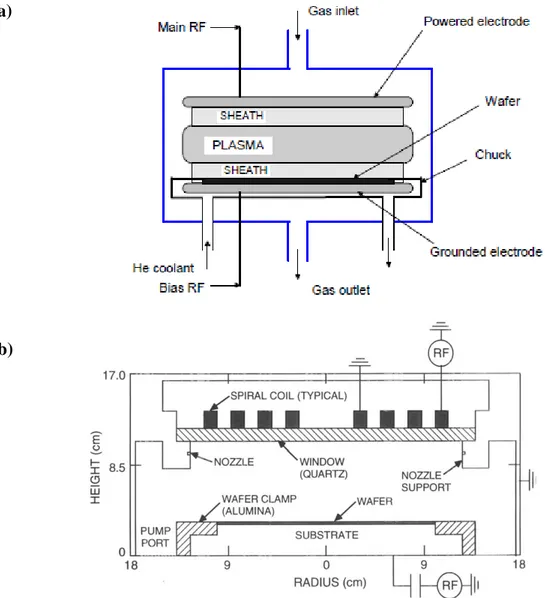
every two years . . . 4 1.3 V-I characteristic curve in DC glow discharge . . . 6 1.4 Schematic of (a) parallel-plate capacitive discharge, called a Reactive Ion
Etcher (RIE) and (b) transformer coupled plasma (TCP) . . . 8
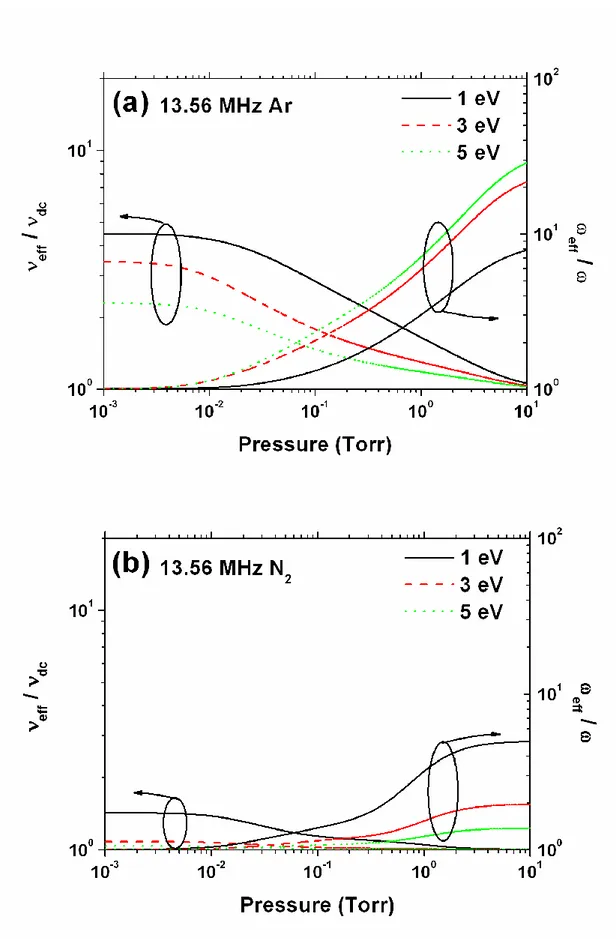
2.1 Variations of νeff/νdc and ωeff/ω as a function of pressure for different electron
temperatures Te (Maxwellian distribution) of (a) argon and (b) nitrogen gas. . . 16
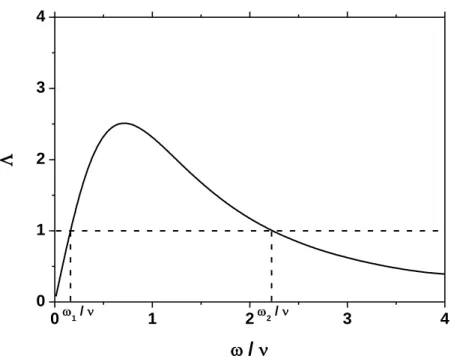
2.2 The parameter Λ as a function of ω/ν. The anomalous skin effect takes place in the frequency range ω1 < ω < ω2 . . . 19 2.3 Calculated transferred power by capacitive coupling, inductive coupling,
stochastic heating and total transferred power at 100 mTorr argon pressure, Te
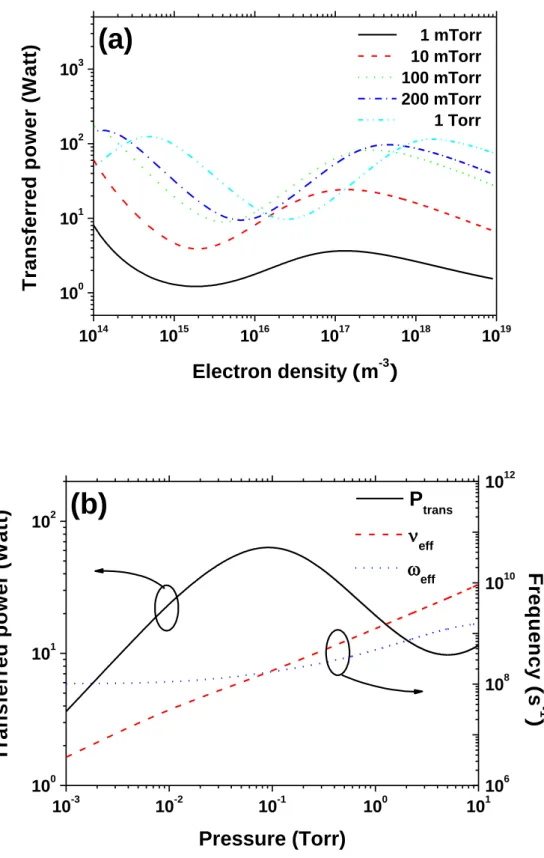
= 2.0 eV and 1 A coil current . . . 22 2.4 (a) Calculated total transferred power at 5 A coil current and Te = 2.0 eV for
various argon pressure and (b) total transferred power and the effective frequencies νeff and ωeff as a function of gas pressure at fixed electron density
1017 m-3 and 5 A coil current . . . 23 2.5 The circuit representation of the discharge which allows for both inductive and
capacitive coupling of RF power to the plasma . . . 25 2.6 The equivalent circuit . . . 26
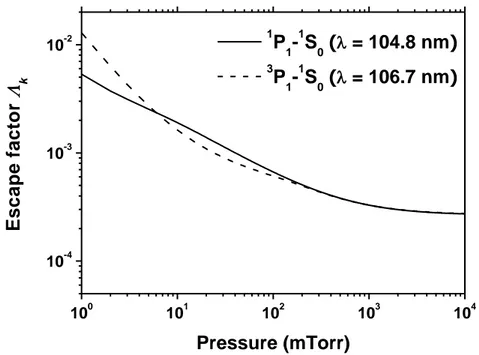
3.1 Calculated escape factors for λ = 104.8 nm and λ= 106.7nm resonance lines of argon as a function of gas pressure . . . 36
4.1 Classification of the cross section . . . 42 4.2 M e a s u r e d a n d c a l c u l a t e d t y p i c a l e m i s s i o n s p e c t r a o f S P S
3 3
2 u, g, ' N C v B v and FNS
2 2
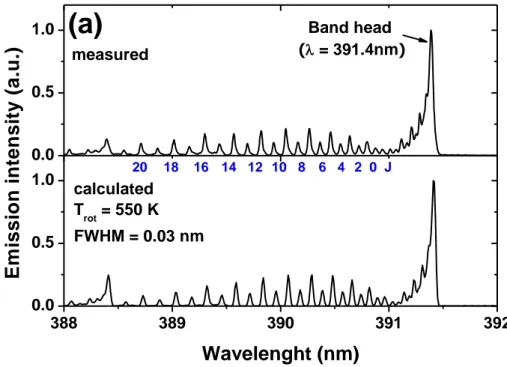
2 u, g, ' N B vX v . . . 49 4.3 (a) Measured rotational spectra of N2+ FNS in an ICP discharge at 100 mTorrand calculated rotational spectra with 0.3 Ǻ of FWHM at 550 K. (b) Linear
4.4 Calculated rotational spectrum of P, Q and R branches and corresponding
Fortrat diagram of
3 3
2 u, 0 g, 0
N C v B v . . . 51 4.5 Measured vibrational spectra of (a) the second positive system (SPS), (b) the
first positive system (FPS) and (c) the first negative system (FNS) in the nitrogen ICP discharge at 100 mTorr. (d) Correspond vibrational distributions by normalizing [N2(C,0)] = 1, [N2(B,3)] = 1 and [N2+(B,0)] = 1 for N2(C3Πu),
N2(B3Πg) and N2+(B2Σu+) . . . 52
4.6 Calculated optical depth kζ0L variations versus the absorption coefficient for α
values between 0 and 5 . . . 56 4.7 Energy diagram for typical LIF excitation of (a) atom, (b) a diatomic molecule,
radical or ion, and (c) a multiphoton transition . . . 57 4.8 Schematic diagram of a typical arrangement used in LIF diagnostics . . . 58 4.9 An idealized I-V curve. The left curve is expanded 10× to show the ion current. 59 4.10 (a) Typical probe I-V characteristic and its second derivative measured in an
argon ICP discharge at 20 mTorr, and (b) the semi-log plot of the EEPF from the I-V curve . . . . 61 4.11 Measured Ip curves at each fixed robe voltage in a pulse modulated argon RF
discharge (pressure = 20 mTorr, frequency = 500 Hz) . . . 62
5.1 Schematic diagram of the TCP chamber and diagnostics system . . . 68 5.2 Evolution of the EEPF with the argon pressure ranging from 3 to 100 mTorr for
an argon inductively coupled discharge at a RF frequency of 13 MHz and a
power of 200 Watt . . . 69 5.3 (a) Effective electron temperature Teff of the EEPF in figure 5.2 against the
pressure, and (b) measured electron density. . . 70 5.4 Pressure dependence of α(P), the coefficient of the cascade cross-section;
ζapp
(E,P) = ζdir(E) + α(P)ζcas(E). α(P) = 1 at 3 mTorr. The open squares are for
4p1 (750.4 nm) and the solid circles for 4p5 (751.5 nm). . . 72 5.5 Solid circles, which are Te according to the line ratio with non-corrected
cross-sections, are substantially below the open squares Te according to the line ratio with corrected cross-sections. The trend of the pressure dependence of the electron temperature from the line ratio with the corrected cross-sections is identical to that of the effective electron temperature from the single Langmuir probe (solid line) . . . 73 5.6 Calculated rotational spectra of N2(B,2-A,0) first positive band for different set
List of Figures ix
5.7 (a) The intensity ratio of the two P1, P2 peaks with the resolution from 0.05 nm to 0.15 nm, and (b) the measured rotational spectra of the hollow cathode lamp and plasma . . . 77 5.8 Energy level scheme of the argon atom excited levels used in the model . . . . 78 5.9 Measured and calculated electron density and electron temperature in
continuous mode plasma varying pressure from 10 mTorr to 200 mTorr. . . 80 5.10 Calculated and measured temporal (a) electron temperature, (b) electron
density at 10 mTorr and 200 mTorr and (c) temporal net loss rate for electron at 200 mTorr; lighter curve indicates negative loss . . . 82 5.11 Calculated and measured temporal atom density of (a) Ar (1s5), (b) Ar (1s4) at
10 mTorr and 200 mTorr and (c) net production rate of each reaction for Ar (1s5) at 200 mTorr . . . 84 5.12 Calculated and measured temporal atom density and emission intensity of (a)
Ar 4p, (b) Ar(5p) and (c) Ar** . . . 85 5.13 Calculated reaction rates for R15 and R16 vs. time in the afterglow at 200
mTorr . . . 86 5.14 Variation of (a) the absorbed power Pabs and the loss power Ploss by electrons
and (b) the coil current icoil as a function of the electron density ne at different
fixed source applied powers from 5 to 50 Watts . . . 93 5.15 Variation of the absorbed power Pabs as a function of the electron density. The
steady state was first calculated for 20 Watts applied power and then from this steady point (ne = 1 × 10¹⁷ m-3) the applied power was decreased to 13, 10, 8
and 5 Watt . . . 94 5.16 The calculated electron density versus the coil current as shown experimentally
by Kortshagen et al . . . . 94
6.1 The measured substrate temperature by thermocouple in Ar -N2 mixed discharge . . . 103 6.2 Simplified energy level diagrams of atomic nitrogen and krypton indicating the
excitation scheme and the observed fluorescence wavelength . . . 104 6.3 Time variation of absolute nitrogen atomic density during pulse-off period at
20 mTorr and 200 mTorr in the pure nitrogen discharge . . . 105 6.4 Measured EEPFs in Ar-N2 discharges at (a) 20 mTorr and (b) 200 mTorr . . . . 107 6.5 Measured and calculated diffusion loss rates of N atoms for various γn at 400 K
gas temperature. The measured sticking coefficient is around 0.02. . . 108 6.6 Flow chart of calculation algorithm . . . 109
6.7 (a) Calculated and measured electron temperature and electron density, (b) calculated collisional energy loss per electron – ion pair created versus electron temperature assuming a Maxwellian electron energy distribution, and (c) calculated charged particle densities versus pressure at fixed RF power in pure
nitrogen discharge . . . 111 6.8 (a) Calculated and measured absolute N atom density and dissociation fraction,
(b) calculated relative production rates for creation of N atoms, and (c) calculated rate coefficients of electron impact excitation to N2( A3Σu+), electron
impact ionization, electron impact dissociation and electron-ion dissociative recombination as function of mean electron energy. . . 112 6.9 Calculated and measured (a) electron temperature and (b) electron density as a
function of the N2 fraction at 20 mTorr, 50 mTorr and 200 mTorr . . . 115
6.10 Calculated density of charged particles versus N2 fraction at (a) 20 mTorr, (b) 200 mTorr and (c) relative loss rates of Ar+ by the ambipolar diffusion (R114) and the charge transfer between Ar+ and N2 (R108) at 20 mTorr, 50 mTorr and
200 mTorr . . . 116 6.11 Calculated and measured (a) metastable state Ar(1s5), (b) resonance state
Ar(1s4) atom densities, (c) Measured emission intensity of N2(C3Πu)-N2(B3Πg)
and calculated density of N2(C3Πu) versus N2 fraction at 20 mTorr, 50 mTorr and 200 mTorr. (d) Change of relative production rates from 20 mTorr (black line) to 200 mTorr (lighter line) of N2(C3Πu) by electron impact excitation
(R7), metastable-metastable excitation (R57) and excitation transfer (R109 ~ R112) . . . 118 6.12 Calculated and measured (a) absolute N atom density and (b) dissociation
fraction function of N2 mixing ratio at 20mTorr, 50 mTorr and 200 mTorr. Calculated relative production rate of N atoms at (c) 20 mTorr and (d) 200
mTorr . . . 121
7.1 Measured rotational spectrum of N2 1st positive (B,0-A,2) band from the Ar-N2
and Xe-N2 mixture discharge . . . 133 7.2 Calculated εc as a function of Te for Ar, He, Ne and Xe, when assuming a
Maxwellian electron energy distribution . . . 135 7.3 Measured EEPFs at pressure of 50 mTorr. . . 136 7.4 Calculated escape factors of He(21P-11S, λ = 58.4 nm), Ne(3P1-1S0, λ = 74.4
nm), Ar(3P1-1S0, λ = 106.7 nm) and Xe(3P1-1S0, λ = 147.0 nm) as a function of the pressure . . . 137 7.5 The equivalent circuit used in the transformer model. . . 137 7.6 The flow chart of calculation algorithm . . . 141
List of Figures xi
7.7 Measured and calculated (a) electron temperature and (b) electron density
versus pressure at a fixed RF power in pure He, Ne, Ar and Xe discharge . . . 143 7.8 Calculated relative production rate of the atomic ion by the direct electron
impact ionization from ground state (R7), the electron impact ionization from
excited states (R8-R10) and ionization by excited particle collision (R21-R22). 144 7.9 Calculated and measured metastable atom density from the absorption
spectroscopy of He(23S), Ne(1s5), Ar(1s5) and Xe(1s5) as a function of the gas
pressure . . . 145 7.10 Calculated loss frequencies of He, Ne, Ar and Xe metastable atoms by
diffusion as well as those by electron collision . . . 146 7.11 Calculated ratio of (a) electron-neutral collision frequency to the effective
collision frequency (b) effective collision frequency to the effective driving
frequency versus pressure for He, Ne, Ar and Xe discharges. . . 147 7.12 Calculated the resistance Rp, and the inductance Lp, in He, Ne, Ar and Xe
discharges . . . 148
List of Tables
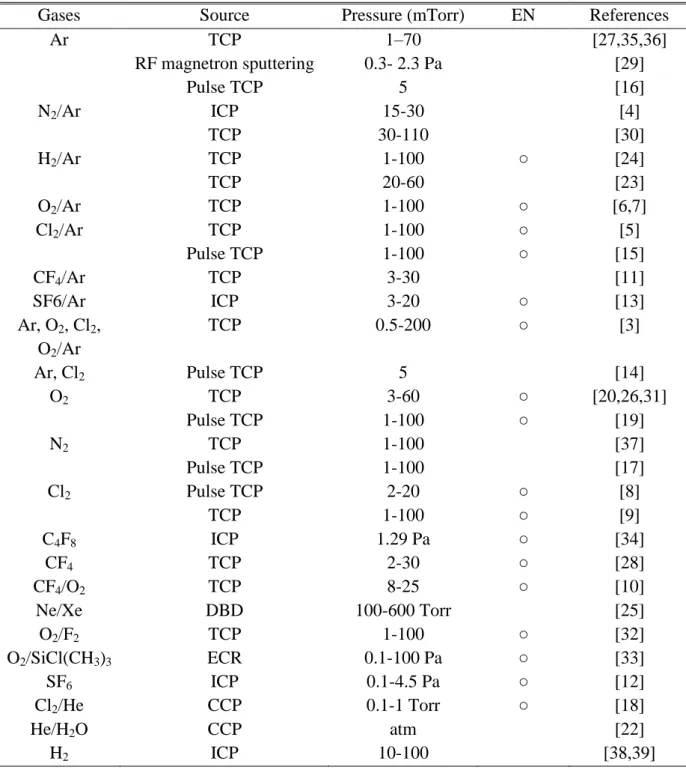
3.1 The developed global models for various gas mixture and discharge sources . . 30
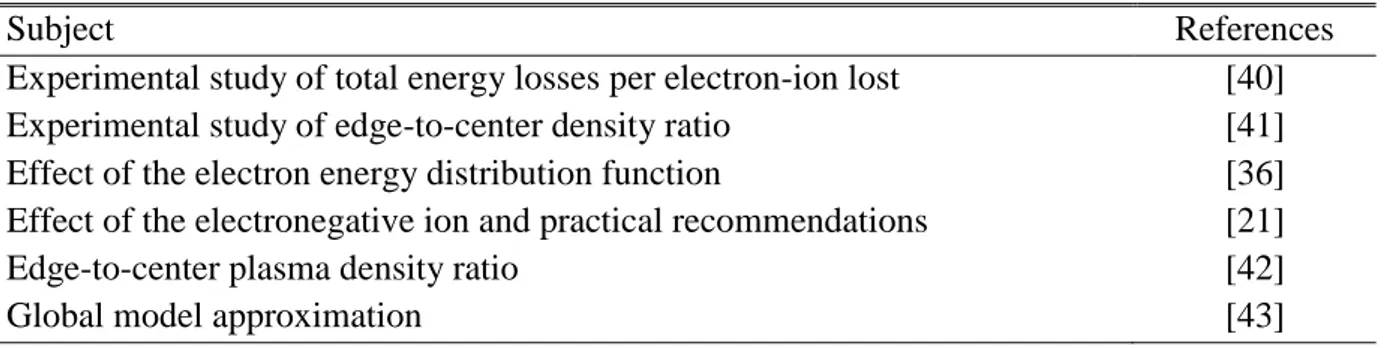
3.2 Useful experimental and theoretical literatures in the global model . . . 31
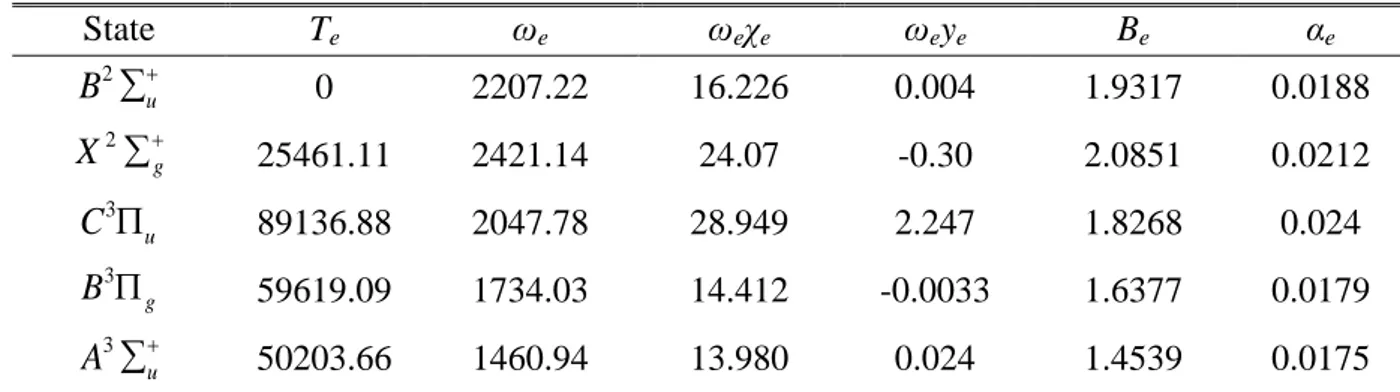
4.1 The spectroscopic constant terms (cm-1) of N2 excited states . . . 51
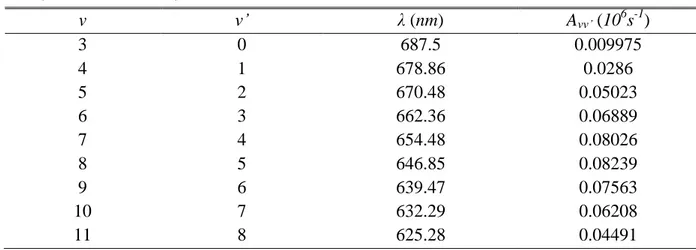
4.2 The wavelength and the transition probability of second positive system (SPS),
3 3
2 u, g, ' , 2 N C v B v v . . . 534.3 The wavelength and the transition probability of the first positive system (FPS),
3 3
2 g, u, ' , 3 N B v A v v . . . 534.4 The wavelength and the transition probability of the first negative system (FNS), N2
B2u,vX2g, ' , v
v 2. . . 545.1 Reaction set used in the model. . . 88
5.2 Relative contributions of the most important population and loss processes during pulse on time and afterglow . . . 89
6.1 The species used in the discharge model . . . 106
6.2 Reaction set used in the discharge model . . . 124
7.1 Selected spectral lines and spectroscopic data of rare gases used for the resonant absorption measurement . . . 133
7.2 Species used in the discharge model . . . 134
7.3 Reaction set used in the model . . . 150
Chapter 1
General introduction
Contents
1.1 The fourth state of matter: plasma . . . . 2
1.2 The science of plasma processing . . . . 2
1.3 DC glow discharge . . . . 6
1.4 High frequency discharge . . . . 7
1.5 Aim of this work and outline . . . . 9
1.1 The fourth state of matter: plasma
LASMA is the most common form of matter in the universe and it is often considered the fourth state of matter. As we know, a solid substance in thermal equilibrium generally passes into a liquid state as the temperature is increased as a fixed pressure. The liquid passes into a gas as the temperature is further increased. At a sufficiently high temperature, the molecules in the gas decompose to form a gas of atoms that move freely in random directions, except for infrequent collisions between atoms. If the temperature is further increased, then the atoms decompose into freely moving charged particles (electrons and positive ions), and the substance enters the plasma state. So plasma is a partially or fully ionized gas, but plasma must be a quasi-neutral gas of charged and neutral particles which exhibit collective behavior. The quasi-neutrality means that the same amount of positive and negative charged particles ni
≈ ne, is probably the most important characteristic of a plasma. In a plasma, the different
species (ions, electrons, and neutrals) have different temperatures: Ti, Te and Tg. Parameters
such as the degree of ionization (ratio of ions to neutral particles density, ni / ni+ng), density
of electrons ne, and the electron temperature Te can be used to characterize a plasma in a
broad sense. Figure 1.1 identifies different kinds of plasmas on a log n versus log Te diagram.
In this work we study a very specific type of plasmas, generally called “cold plasma” or “low pressure discharges”. The typical pressure range of such a discharge is 1 mTorr ~ 1 Torr, and the ionization degree is 0.1 ~ 1 %. As a consequence of the very low charged-to-neutral particle ratio, collisions of electrons with neutrals are very important and often dominant over charged-charged particle collisions for the determination of the electron transport parameters. These discharges are characterized by Te ≈ 1 ~ 10 eV, and ne ≈ 108 ~ 1013 cm-3. Such
discharges are sustained in a non-equilibrium steady state by the electric field that allows the ion temperature to be much lower than the electron temperature Ti ≪ Te. In most cases the
electrons are close enough to thermal equilibrium that their temperature is relatively well-defined, even when there is a significant deviation from a Maxwellian distribution. Due to the large difference in mass, the electrons come to thermodynamic equilibrium among themselves much faster than they come into equilibrium with the ions or neutral atoms. For this reason, the ion temperature is different from (usually lower than) the electron temperature.
1.2 The science of plasma processing
Plasma processing is the most widely used chemical process in microelectronic industry for thin film deposition and etching. Its application extends to surface cleaning and modification, flat panel display fabrication, plasma micro discharge and many other rapidly growing areas. Plasma processing is a combination of several different branches of science such as plasma physics, gas-phase chemistry, atomic and molecular physics, and surface science [3-5].
The number of industrial applications of plasma-based systems for processing of materials and for surface modification is extensive, and many industries are impacted. Some of these processes and corresponding applications are following:
• Plasma-controlled anisotropic etching in the fabrication of microelectronic chips.
P
1.2 The science of plasma processing 3
• Plasma deposition of silicon nitride for surface passivation and insulation.
• Surface oxidation used in the fabrication of silicon-based microelectronic circuits. • Plasma-enhanced chemical vapor deposition of amorphous silicon films used in solar
cells.
• Plasma-surface treatment for improved film adhesion to polymer surfaces. • Plasma nitriding, which is used to harden the surface of steel.
• Plasma-enhanced chemical vapor deposition and thermal plasma chemical vapor deposition of diamond thin films.
• Plasma spray deposition of ceramic or metal alloy coatings used for protection against wear of corrosion in aircraft and automotive engines.
• Plasma spray deposition of clearance control coatings. • Plasma melting and refining of alloys.
• Plasma-assisted manufacture of optical fibers used in communications.
Figure 1.1 Space and laboratory plasmas on a log n versus log Te diagram adapted frim
• Plasma synthesis of ultrapure powders used as ceramic precursors.
• Plasma spray deposition and thermal plasma chemical vapor deposition of high-temperature superconductors and refractory materials.
• Plasma welding and cutting.
• Plasma sputter deposition of magnetic films for memory devices.
In each case, the plasma is used as a source of ions and/or reactive neutrals, and is sustained in a reactor so as to control the flux of neutrals and ions to a surface.
The science of plasma processing is largely motivated by the semiconductor industry that for the past three decades has been accelerating towards faster computing and larger memory volumes. Moore‟s law has characterized the microelectronics industry since 1980, when Gordon Moore observed that the number of transistors in microprocessors doubles every 18 months, and it was extended to 24 months to compensate for expected increases in the complexity of semiconductors (see figure 1.2). The industry has obeyed Moore‟s law for over 20 generations. This has lead to smaller devices and features and improved capabilities over the years. The process of fabricating these devices involves hundreds of steps while critical dimensions have shrunk to 10‟s of Å (a few atomic mono-layers).
In plasma etching, the plasma produces both highly reactive neutrals and ions that
Figure 1.2 Transistor counts for integrated circuits plotted against their dates of introduction.
1.2 The science of plasma processing 5
bombard the surface being etched. The process can be chemically selective, removing one type of material while leaving other materials unaffected, and can be anisotropic, removing material at the bottom of a trench while leaving the same material on the sidewalls unaffected. The neutrals react with the surface to produce volatile species that absorb and are pumped away. Ion bombardment often increases the etching rate by removing surface contaminants that block the etching or by directly enhancing the kinetics of the etching. Directional plasma etching processes must be used to pattern such features to obtain the necessary fidelity of pattern transfer. Wet etching processes and chemical based plasma etching processes are typically isotropic, and produce undercutting of the pattern at least equal to the film thickness.
Reactive ion etching (RIE) consists of bombarding the material to be etched with highly energetic chemically reactive ions. Such bombardments with energetic ions dislodge atoms from the material, in effect achieving material removal by sputtering. In addition to sputter-removal, the bombarding ions used in RIE were chosen so that they will chemically react with the material being bombarded to produce highly volatile reaction byproducts that can simply be pumped out of the system. This is the reason why RIE is widely used in wafer fabrication; it achieves the required anisotropy (by means of sputter-removal) and the required selectivity (through chemical reactions).
Plasma-assisted deposition, implantation, and surface modification are important material processes for producing films on surfaces and modifying their properties. The deposition processes can be divided into two large groups, namely the Physical Vapor Deposition (PVD) and Chemical Vapor Deposition (CVD), in which plasma si utilized extensively in order to improve the process characteristics. The PVD techniques can be sub-divide further into:
• Cathodic Arc Deposition, in which a high power arc discharge the target material blasts away some into highly ionized vapor
• Electron Beam Physical Vapor Deposition, in which the material to be deposited is heated to a high vapor pressure by electron bombardment in high vacuum
• Evaporative Deposition, in which the material to be deposited is heated to a high vapor pressure by electrically resistive heating in low vacuum
• Pulsed Laser Deposition, in which a high power laser ablates material from the target into a vapor
• Sputter Deposition, in which a glow plasma discharge (usually localized around the “target” by a magnet) bombards the material sputtering some away as a vapor
Also PVD coating is used to improve hardness, wear resistance and to reduce friction. The use of such coatings is aimed at improving efficiency through improved performance and longer component life.
CVD processes normally involve the chemical processing for producing of high-purity solid materials including thin film, but in some cases CVD is enhanced by plasma. These cases normally refer to as Plasma-Enhanced CVD (PECVD), which are the CVD processes that utilize a plasma to enhance chemical reaction rates of the precursors. PECVD uses a discharge to reduce the temperature at which films can be deposited from gaseous reactants through the creation of free radicals and other excited species that react at lower temperatures
within the gas-phase and on the surface. The quality of the deposited film often can be improved by the use of the plasma ion flux to clean the surface before the deposition begins and by heating during processing. In addition, the ion flux can alter the film during deposition by cleaning, enhancing the mobility of adsorbed species.
Plasma implantation can introduce elements into the surface of the materials without thermodynamic constraints. In particular, plasma immersion ion implantation (PIII), sometimes also referred to as plasma implantation, the specimens are surrounded by a high-density plasma and pulse biased to a high negative potential relative to the chamber wall. Ions generated in the overlying plasma are accelerated across the sheath formed around the samples and implanted into the surface of the targets. Plasma implantation has many potential applications in biomaterials engineering. For example, sample possessing a sophisticated shape can be treated with good conformality and uniformity without beam scanning and special target manipulation. In addition, multiple processes such as simultaneous and consecutive implantation, deposition, and etching are possible by varying the instrumental parameters without breaking vacuum.
1.3 DC glow discharge
The direct current (DC) glow discharge has been studied for a long time. It works in a glass tube filled with a given gas at low pressure, between two electrodes, called cathode and anode [6]. The potential (V) between the two electrodes is related to the discharge current (I) by V = V0 – RI where R is the charge resistance and V0 is the voltage applied to the cathode.
Figure 1.3 V-I characteristic curve in DC glow discharge.
10-10 10-8 10-6 10-4 10-2 1 102 104
Dark discharge Glow discharge Arc
Current (A) V o ltag e VB Breakdown voltage Normal glow Abnormal glow
Townsend regime Thermal Arc
Non-thermal Arc Corona Glow-to-Arc transition Saturation regime
1.4 High frequency discharge 7
The V-I curve as schematized in figure 1.3, is the discharge characteristic for a given gas. The resistance (R) value must be sufficiently high to obtain a stable working point. This stable working point will be easy to find in the growing part of the V-I characteristic, called the glow discharge. A increasing the current the breakdown occurs at the end of the Townsend regime, and then the voltage decreases and becomes stable. This regime corresponds to a normal glow discharge in which the voltage slightly increases with the current. In the abnormal glow regime the voltage increases steeply with current, this regime is established until the arc transition at high discharge currents. In the arc regime, the voltage is weak and the discharge current is strong.
1.4 High frequency discharge
High frequency discharge or radio-frequency is one of the most widely used discharge types for film treatment. This is because it is able to produce a large volume of stable plasma [7,8]. Using an alternative current (AC) the displacement current will flow through the electrode whether it is dielectric or not and so the discharge can be sustained. In AC discharge the positive charge accumulated during one half-cycle can be neutralized by electron bombardment during the next half cycle. For the power source, whole range of frequencies can be available. If the frequency exceeds about 300 kHz, the high frequency power can be supplied from an external electrode to the load. This can be done through a discharge tube which is made of glass (usually quartz) because of its heat resisting property and low dielectric loss. The high frequency discharge is also called the electrodeless discharge, because the external electrode is not directly in contact with the plasma. It makes possible to reduce the effect of the electrode materials, such as metal impurities on the plasma processing. The frequency most often chosen is 13.56 MHz. At this frequency the plasma impedance is relatively low. This frequency is allowed for industrial, scientific and medical uses by international communications authorities. However, the discharge system including the high frequency generator radiates many harmonics of the parent frequency. Such high frequencies as 13.56 MHz can cause problems in electronics, especially instruments used for precise measurements. The operating frequency affects the composition, the densities and the potentials of the plasma and therefore has a strong influence on the properties of the deposited films.
The high frequency discharges have been classified onto two types according to the method of coupling the high frequency power with the load: the capacitive coupled plasma (CCP) and the inductively coupled plasma (ICP). In the capacitive coupled plasma, one of the most widely used low pressure discharge is sustained by RF currents and voltages applied directly to an electrode immersed in the plasma. This creates a high voltage capacitive sheath between the electrode and the bulk plasma. The RF currents flowing across the sheath and the bulk plasma led to stochastic or collisionless heating in the sheath and ohmic heating in the bulk. Inductive coupled discharges are nearly as old as the invention of electric power, with the first report of an “electrodeless ring discharge” by Hittorf in 1884 [9]. He wrapped a coil around an evacuated tube and observed a discharge when the coil was excited with a Leyden jar. Inductive coupled discharges have two main advantages: no internal electrodes are
needed as in capacitively coupled systems and no dc magnetic field is required. These benefits make ICPs probably the most common of the plasma tools. These devices come in many different configurations. In the simplest form, the antenna consists of one or several turns of water-cooled tubing wrapped around a ceramic cylinder, which forms the sidewall of the plasma chamber. Another configuration called the transformer coupled plasma (TCP) uses a top-mounted antenna in the shape of a flat coil, like the heating element on an electric stove. In addition to inductive coupling, there can also be capacitive coupling, since a voltage must be applied at least to one end of the antenna to drive the RF current through it. Since this voltage is not uniform distributed, as it is in a plane-parallel capacitive discharge, it can cause an asymmetry in the plasma density. On the other hand, this voltage can help to breakdown the plasma, creating enough density for inductive coupling to take hold. Figure 1.4 shows typical (a) parallel-plate capacitive discharge, called a Reactive Ion Etcher (RIE) and (b) transformer coupled plasma (TCP) [10].
(a)
(b)
Figure 1.4 Schematic of (a) parallel-plate capacitive discharge, called a Reactive Ion Etcher
1.5 Aim of this work and outline 9
1.5 Aim of this work and outline
In spite of the extensive use of low pressure glow discharges in a wide range of application fields as mentioned before, the underlying physics of the discharge is not yet fully understood. For a better understanding, it is necessary to know not only the physics of plasma such as electron heating, collision, diffusion and transport, but also the plasma chemistry such as gas-phase kinetics and physical/chemical reaction with surface. To do this, integrated diagnostic tools are needed to quantify the concentrations of various reactive species as well as the important plasma parameters such as the electron temperature and electron density in the discharge. Indeed, the plasma modeling is essential by virtue of theoretical interpretation and prediction of experimental results.
The aim of this work is therefore to understand the physical/chemical properties of low pressure glow discharges. This work is devoted to diagnostics of low pressure inductively coupled plasma (ICP) discharge, both of the physical and chemical interaction within plasma using theoretical modeling and experimental diagnostic methods for plasma processing. To understand the chemical kinetics in the discharge, a time dependent global model (volume averaged) is developed for various gases. Also a transformer model is developed to understand the electrical properties of the low pressure ICP discharge. A number of traditional plasma diagnostic methods are used to compare with calculated results such as Langmuir probe, optical emission spectroscopy (OES), optical absorption spectroscopy (OAS) and laser-induced fluorescence (LIF).
In Chapter 2 we discuss some important characteristics of typical ICP discharge such as the heating mechanisms, power transferred to the plasma electrons and we present a transformer model of the discharge. We show variation of the effective collision frequency and the effective RF driving frequency with the pressure and the electron temperature to calculate the electrical conductivity in RF discharge. The electrical conductivity is an important parameter in understanding the mechanism by which the power is coupled to a RF discharge, as well as determining the external electrical characteristics of the discharge. Using these values we also give the electromagnetic field components of a planar ICP reactor with analytical expressions to calculate the transferred power to the plasma electrons by the capacitive coupling and the inductive coupling. Finally using the transformer model we show the plasma impedance, current and voltage.
In Chapter 3 we describe the global model which consists of the particle and the electron energy balance equations. We provide the general expression of energy balance for non-Maxwellian electrons. Also we provide the particle balance by electron impact excitation, ionization, radiative decay, diffusion and pumping loss.
In Chapter 4 we briefly introduce basic principles of some methods of plasma diagnostics used in this study such as OES, OAS, TALIF and Langmuir probe. We provide the calculation of ro-vibrational spectra of N2 discharge, and the estimation of rotational and vibrational temperature from measured spectra. We apply this technique to deduce the gas temperature in discharges containing N2 gas.
Chapter 5 is devoted to the study of low pressure argon ICP discharges. First, we propose a new method of improving the precision of the pressure-dependent electron temperature calculated by the line ratio method. Using the electron energy distribution functions (EEDFs) and the electron density from Langmuir probe, we provide the coefficient of the cascade cross-section as a function of the pressure for argon 4p1 and 4p5. We show the effective electron temperature calculated by the corrected cascade cross-section and compare with Langmuir probe. Second, we study the production of argon excited states in the afterglow of pulse discharge. Experimentally time resolved OES, OAS and Langmuir probe are used to measure the emission of highly excited states, metastable atom density, electron density and electron temperature. To understand the behavior of the afterglow a time dependent global model is developed. We discuss the dominant creation sources and the routes of loss for each level during the discharge and in the afterglow. Finally, the E-H mode transition and hysteresis in low pressure argon inductively coupled discharges are investigated using the global model and the transformer model.
In Chapter 6 the dissociation of the nitrogen molecule in an Ar-N2 ICP discharge is studied both experimentally and theoretically. Using TALIF we found an increase of the dissociation rate in highly Ar-diluted region. A global model is developed to understand the behavior of the Ar-N2 discharge. The calculated results are compared with the measured results, obtaining reasonably good agreement. We discuss in detail the dominant creation sources and the routes of loss for each level in pure N2 discharge as well as in Ar-N2 mixture.
In Chapter 7 we develop the global model for He, Ne, Ar and Xe discharges to calculate the electron temperature and the electron density. We compare the calculated results with experiments and discuss the dominant creation sources and the routes of loss for electron and metastable atoms as function of pressure. The transformer model is used to calculate the electrical properties of He, Ne, Ar and Xe discharges. We discuss the differences of the kinetics and the electrical properties in He, Ne, Ar and Xe discharges.
1.6 References 11
1.6 References
[1] Lieberman M A and Lichtenberg A J 2005 Principles of Plasma Discharges and
Materials Processing 2nd ed. (New York: Wiley)
[2] 2009 NRL Plasma Formulary, Naval Research Laboratory, Washington, DC
[3] Rossnagel S M, Westood W D and Haber J J 1991 Handbook of Plasma Processing
Technology: Fundamental, Etching, Seposition and Surface Interations (Material Science and Process Technology) (New Tork: Noyes)
[4] Ohring M 1992 The Material Science of Thin Films (California: Academic Press) [5] Konuma M 1992 Film Deposition by Plasma Techniques (Springer)
[6] Ricard A 1966 Reactive Plasmas (SFV Editions)
[7] Keller J H, Forster J C and Barnes S M 1993 J. Vac. Sci. Technol. A 11 2487
[8] Hopwood J, Guarnieri C R, Whitehair S J and Cuomo J J 1993 J. Vac. Sci. Technol. A 11 147
[9] Hittort W 1884 Wiedemanns. Ann. Phys. 21 90
[10] Chen F F and Chang J P 2003 Lecture Notes on Principles of Plasma Processing (New York: Kluwer Academic)
Chapter 2
Characteristic of ICP discharge
Contents
2.1 Introduction . . . . . . 14 2.2 Heating mechanism in RF inductive discharge . . . . . . 14 2.2.1 Effective electrical conductivity and effective collision frequency . . . 14
2.2.2 Classical skin effect . . . 17
2.2.3 Anomalous skin effect . . . 18
2.2.4 Ohmic (collisional) and stochastic (collisionless) heating . . . 20
2.3 The power transferred to the plasma electrons in TCP reactor . . . . 21 2.4 Transformer model and plasma impedance . . . . 24 2.5 References . . . . . . . . 28
2.1 Introduction
NDUCTIVELY coupled plasma (ICP) provide compact high density reactors operating at low pressures and they are full of promise as innovative sources applicable to various plasma processings [1,2]. Although inductively coupled plasmas have over 100 years of history, the use of these sources for plasma-assisted materials processing was first described in patents by Ogle of Lam Research Corporation [3] and by Coultas and Keller of IBM Corporation [4] as devices to generate high density plasma at low pressures. Later many researchers indicate that these discharges are capable of producing plasma densities on the order of 1011-1012 cm-3 at low pressures, and that under optimized conditions, uniform plasma densities can be achieved [5-8].
In high-frequency discharges there are two distinct mechanisms by which power is coupled into the plasma [9]. The first of these is the plasma joule heating, which is principally due to collisions between electrons and atoms of the background gas. The second mechanism is the stochastic heating, due to the voltage across the sheaths which occurs, for example, at the electrodes of capacitively coupled discharges on is due to the inhomogeneous radio-frequency fields in the neighborhood of the coil in inductively coupled discharges. In order to correctly interpret the power balance in a high-frequency discharge, it is necessary to know the complex electrical conductivity due to the electron-atom collisions, which determines the joule heating component.
In section 2.2 we first discuss the effective electrical conductivity and the effective collision frequency developed by Lister et al [10]. And then we introduce the classical skin effect which is the penetration depth of an electromagnetic field, and the collisional heating and collisionless heating mechanism.
In section 2.3 we give the transferred power to the plasma electrons by the capacitive coupling, the inductive coupling and the stochastic heating in a planar ICP reactor. Also we discuss the influence of the effective collision frequency and the effective driving frequency to the transferred power.
In section 2.4 we show a transformer model which considers the plasma to be a ring acting as the secondary coil of a transformer in the low pressure inductive discharges. Using this model we calculate the plasma impedance, current and voltage.
2.2 Heating mechanism in RF Inductive discharge
2.2.1 Effective electrical conductivity and effective collision frequency
The collisional electrical conductivity ζp expresses the relation between the local current J in
the discharge and the local electric field E through Ohm‟s law, p
J
E (2.1)The classical definition of the collisional electrical conductivity in a high-frequency plasma is
2 e p e m n e m j (2.2)I
2.2 Heating mechanism in RF Inductive discharge 15
where e and me are the electronic charge and mass, respectively, ne is the electron density, νm
is the electron collision frequency, and ω is the applied frequency. Equation (2.2) is strictly valid only when the electron collision frequency is independent on the electron velocity. If νm
is a function of the electron energy, ε, equation (2.2) is replaced by the more general form:
2 e p e eff eff n e m j (2.3)where the effective electron-neutral collision frequency νeff and the effective driving
frequency ωeff depend on both ν(ε) and ω.
The general formula for the electrical conductivity in a weakly ionized plasma in which the electric field E ∝ ejωt
is
2 3 2 0 2 3 e p e c dF n e d m j d
(2.4)where νc(ε) = Nυζc(ε) is the differential collision frequency for electron momentum transfer at
energy ε, N is the background neutral density, υ = (2eε/me)1/2 is the electron velocity, and ζc(ε)
is the effective collision cross section for momentum transfer, which includes both elastic and inelastic cross section, and F(ε) denotes the electron energy distribution function (EEDF) with the normalization,
1 2 0 F d 1
(2.5)Using equation (2.3) and (2.4), we find general expressions of νeff and ωeff.
2 2 2 0 2 2 2 3 eff c eff eff c dF d d
(2.6)
3 2 2 2 0 2 2 2 3 eff eff eff c dF d d
(2.7)Moreover we can define two important limiting cases, the dc limit and the high-frequency limit. When eff2 2 (dc limit),
eff
dcwhere
3 2 1 0 2 3 dc c dF d d
(2.8)
2 3 2 2 0 2 3 eff dc c dF d d
(2.9)Figure 2.1 Variations of νeff/νdc and ωeff/ω as a function of pressure for different electron
2.2 Heating mechanism in RF Inductive discharge 17
3 2
0 2 3 hf c dF d d
(2.10)Figures 2.1(a) and 2.1(b) show the variations of νeff/νdc and ωeff/ω as a function of pressure for
different electron temperatures Te which the EEDF is assumed Maxwellian for argon and
nitrogen gas. The high-frequency and dc limits at low and high pressures, respectively, and the deviation from these limits, are clearly illustrated. Indeed, for nitrogen gas, νeff/νdc and ωeff/ω decrease as increasing the electron temperature, due to the vibrational and rotational
energy levels between 1 ~ 3 eV in nitrogen molecule.
2.2.2 Classical skin effect
In an inductively coupled plasma, the power is transferred from the electric fields to the plasma electrons within a skin depth layer of thickness δ near the plasma surface by collisional (ohmic) dissipation and by a collisionless (stochastic) heating process in which bulk plasma electrons “collide” with the oscillating inductive electric fields within the skin layer.
We consider the classical or normal skin effect accompanied by ohmic (collisional) electron heating in a semi-infinite spatially uniform plasma. The normal skin effect occurs when the electron thermal motion is negligible and there is a local coupling between the RF current density J and the RF electric field E within the skin layer given by J = ζpE. We
consider the case when ω ≪ ωpe, which is always true for inductively coupled plasmas,
where ωpe is the electron plasma frequency, defined aspe2
e n2 e 0me
. We also assume a Maxwellian EEDF and an energy-independent electron-atom collision frequency νm(ε) =const.
According to Maxwell‟s equations, the penetration of the transverse electric field into the plasma is described by the complex wave equation
2 0 2 y p y d E j E dx (2.11) having solution
0 cos x y y E E e t x (2.12) where
1 2 1 0 Re j p (2.13) is the inverse skin depth and
1 2 0Im j p
(2.14)
is the propagation constant. Substituting (2.2) into (2.13), one obtains the general expression for the classical (normal) skin depth
0 cos 2 (2.15) where 1 4 2 0 1 2 m pe c (2.16) and
1 tan m (2.17) In the collisional limit (νm ≫ ω), typical for the nonsuperconducting metals and high pressureplasma, ε = π/2 and 1 2 1 2 2 m 2 m c p pe c (2.18)
and the RF energy collisionally dissipates within the skin layer.
In the high frequency limit (νm ≪ ω), called the nondissipative or high frequency skin
effect ε = 0 and p pe c (2.19)
In this case the electrons colllisionlessly oscillate within the skin layer with no net energy gain. For an electromagnetic wave incident on the plasma boundary this case corresponds to the total reflection of the wave from the plasma. For discharge maintenance in this case, the wave reflection is not perfect, and a small fraction of the incident wave power is locally and/or nonlocally deposited within the skin layer.
2.2.3 Anomalous skin effect
There is a third situation for which electrons incident on a skin layer of thickness δa satisfy
the condition , 2 e m a (2.20)
where δa is determined below. In this case, the interaction time of the electrons with the skin
layer is short compared to the RF period of the collision time. That means the electrons can gain energy from the wave without losing it during all the period. In analogy to collisionless heating at a capacitive sheath, a stochastic collision frequency can be defined
4 e e stoc a C (2.21)
2.2 Heating mechanism in RF Inductive discharge 19
where Ce is a quantity of order unity that depends weakly on e, δa, and ω, provided the ordering (2.20) is satisfied. We then substitute νstoc for νm in (2.16) and expand for νstoc ≫ ω,
to obtain 1 2 2 e e a pe a C c (2.22)
Solving for δa, we find
1 3 1 3 2 2 2 2 e e e e a p pe p C c C (2.23)
where δa is the anomalous skin depth.
A general nonlocality parameter for the nonlocal interaction of electrons with the electromagnetic field has been given by Fried and Conte [11] and used in the analysis of the anomalous skin effect by Weibel [12] and Saysov [13]
2 3 2 2 2 4 e pe en c (2.24)Formulae for the classical skin effect are applicable when Λ ≪ 1; for Λ > 1, the anomalous skin effect takes place. Figure 2.2 shows the nonlocality parameter Λ as a function of ω/ν.
0 1 2 3 4 0 1 2 3 4 2 / 1 / /
Figure 2.2 The parameter Λ as a function of ω/ν. The anomalous skin effect takes place in
The anomalous skin effect takes place in the frequency range ω1 < ω < ω2.
In the extreme anomalous case (a) neither the skin depth δ nor the energy dissioation in the skin layer depend on the collision frequency ν, (b) the dissipation of energy is present even if ν = 0, (c) the damping of the field is characterized by at least two characteristic lengths (the skin depth δ and the mean free path λ), and (d) the field profile can be non-monotonic, and in some places the current can even flow against the field [14].
2.2.4 Ohmic (collisional) and stochastic (collisionless) heating
The heating of electrons of time-varying fields is fundamental to the operation of radio frequency discharges. In a uniform oscillating electric field, E(t) = ReE0ejωt, a single electron
has a coherent velocity of motion that lags the phase of electric field force –eE by 90°. Hence, the time-average power transferred from the field to the electron is zero. Electron collisions with other particles destroy the phase coherence of the motion, leading to a net transfer of power. For an ensemble of n electrons per unit volume, it is usual to introduce the macroscopic current density J = enu, with u the macroscopic electron velocity, and to relate the amplitudes of J and E through a local conductivity equation (2.1). The average electron velocity oscillates coherently but lags the electric field by less than 90°, leading to an ohmic power transfer per unit volume
2 2 * 1 0 0 0 0 1 1 1 Re J E E Re J Re 2 2 2 ohm p p P (2.25)So in the planar inductively coupled discharge, the ohmic heating power flux is
2 2 0 2 2 0 2 2 0 2 2 1 2 1 4 z s en ohm e en eff s en e en eff e n S dz E e m e n E m
(2.26)where ns is the sheath edge density and z is the distance from the quartz window.
To determine the stochastic heating at low pressure, we consider an electron from the bulk plasma incident on the RF electric field within a skin depth layer in slab geometry. We assume a simple model in which the transverse electric field within the slab decays exponentially with distance z from the edge into the slab [15]
, 0 cos
zy
E z t E e t (2.27)
We also assume that the collisionality is weak, νm ≪ υe/δ; hence there are no electron
collisions within the skin layer. Because there are no z-directed forces, we can write the position of the electron as:
, t < 0 , t > 0 z z t z t t (2.28)2.3 The power transferred to the plasma electrons in TCP reactor 21
where the electron reflects from the surface at t = 0. Substituting (2.28) into (2.27) yields the transverse electric field seen by the electron
0 0 Re , 0 Re , 0 z z j t j y j t j E t E e t E e t (2.29)The transverse velocity impulse
y y e eE t dt m
(2.30)is calculated by substituting (2.29) into (2.30) and integrating to obtain
0 2 2 2 2 cos z y e z eE m (2.31)
The energy change Δε, averaged over a uniform distribution of initial electron phase , is then
2 2 2 0 2 2 2 2 2 1 1 2 4 z e y e e z eE m m m (2.32)which can be integrated over the particle flux to obtain the stochastic heating power
stoc x y z e z z
S d d d F
(2.33)For a Maxwellian electron distribution Fe, the integral over υx and υy are easily done, and the υz integral can be evaluated in terms of the exponential integral E1. For the regime of large
nonlocality ( Λ ≫ 1) 2 2 2 4 1 e (2.34) we obtain 2 0 1 ln 1 1.58 e s stoc e e m n eE S m (2.35)
2.3 The power transferred to the plasma electrons in TCP reactor
The power transferred to the plasma electrons in planar inductively coupled discharge can be calculated from the electric field components induced by the induction coil current [16-20]. The planar induction coil excites RF magnetic fields Br, Bθ and Bz, which are respectively the
radial, azimuthal and axial components and the corresponding components of RF electric fields Er, Eθ and Ez. The electromagnetic field components of Bθ, Er and Ez are capacitively
coupled with plasma electrons while the remaining filed components Eθ, Br and Bz are
inductively coupled. We derive the each component of electromagnetic field in Appendix. The averaged power transferred by capacitive coupling, Pe, can be calculated by
integrating the Poynting vector using calculated Er, Ez and Bθ as follows:
*
*
0 0 0 2 , , , , R R e r z P rE r L D B r L D dr rE r L D B r L D dr
(2.36)In a similar manner, the average power, Pind, delivered from the RF coil to the plasma
through inductive coupling is given by integrating the Poynting vector over the surface area of the coil:
*
0 0 1 2 , , 2 R ind r P rE r L D B r L D dr
(2.37)The total transferred power to the electrons is given by
Re
trans e ind stoc
P P P P (2.38)
Figure 2.3 Calculated transferred power by capacitive coupling, inductive coupling,
stochastic heating and total transferred power at 100 mTorr argon pressure, Te = 2.0 eV and 1