THÈSE
En vue de l'obtention duDOCTORAT DE L’UNIVERSITÉ DE TOULOUSE
Délivré par l'Université Toulouse 3 Paul Sabatier (UT3 Paul Sabatier) Discipline ou spécialité : Génie Civil
Présentée et soutenue Le 30 Octobre 2017 par :
Ponleu CHHUN
Titre :
Modélisation du comportement
thermo-hydro-chemo-mécanique des enceintes de confinement nucléaire en béton
armé-précontraint
JURY
Frédéric DUFOUR Pr. Grenoble INP Président
Nicolas BURLION Pr. Polytech Lille Rapporteur
Farid BENBOUDJEMA Pr. ENS Paris Saclay Rapporteur
Sylvie MICHEL-PONNELLE Ingénieur chercheur, EDF R&D Examinatrice
Bruno CAPRA Directeur scientifique, OXAND Examinateur
Sylvain CHATAIGNER Ingénieur chercheur, IFSTTAR Nantes Examinateur
Alain SELLIER Pr. Université Paul Sabatier Directeur de thèse
Laurie LACARRIERE MC Université Paul Sabatier Co-Directrice
Benoît MASSON Ingénieur expert, EDF SEPTEN Invité
Sharock GHAVAMIAN Directeur général associé, NECS Invité
Ecole doctorale : MEGEP Génie civil
i
Abstract
In the context of life extension and safety demonstration of nuclear reactor buildings following the severe accidents of Chernobyl (in Ukraine, 1986) and Fukushima (in Japan, 2011), the “Confinement Assessment of a vessel during an Accident” (MACENA) project supported by the French National Research Agency (ANR) has been initiated since 2013. The experimental campaigns and modelling works of this project are based on an experimental containment vessel mock-up at scale 1/3 named VeRCoRs which is constructed and monitored by Electricity of France (EDF). The main issues for long-term operation of nuclear power plants that have more than 50 years old consist of ageing mechanisms in concrete and prestressing losses, as the internal concrete wall is prestressed with steel wires. These phenomena influence the cracking occurrence that can be significant if the “Loss-of-coolant accident” (LOCA) induced conditions are maintained for several weeks. The material characteristics of nuclear containment building can be modified by the loading prior to the LOCA, leading possibly to a reduction of tensile strength (early cracking, pre-operational pressurization test). The loadings during the LOCA i.e. increase of temperature and vapour relative pressure can then propagate the cracks. Thus, the material properties depend on the solicitation history since the concrete pouring
In that context, this PhD thesis introduces a computational strategy adopted to consider the damage accumulation using a single mechanical model from the early age until the LOCA. Considering the effect of chemo-physical of the concrete on the response of this mechanical model along the life of the structure requires the preliminary prediction of the evolution of chemical, thermal and hydric state from casting to later ages, including the LOCA. Several multiphysics models are studied, improved or tested in this thesis work: the first model is devoted to predicting the hydration degree, temperature, water content and porosity of concrete at an early age; the second allows to follow the evolution of temperature and water saturation for later ages (ageing period and effects of the LOCA conditions on the thermal and hydric state of concrete). The mechanical model uses the results of the two previous ones to estimate the delayed deformations of concrete, the relaxation of prestressing wires, and the risk of cracking.
This methodology was developed to avoid the loss of information relative to material state throughout the life of the structure. The main advantages of the methodology are the possibility to consider automatically the accumulation of damage until the LOCA on the one hand and on the other hand the improvements made to the material model to be used in the LOCA conditions, which improve the modelling quality, especially during the early age.
Keywords: THCM behaviour of prestressed concrete, (early) crack, nuclear containment, scale
effect, wires relaxation, creep, shrinkage, thermal damage, restrained deformation, drying, hydration, distributed reinforcement, high temperature, humidity
iii
Résumé
Dans le cadre de la prolongation de la vie et de la démonstration de la sécurité des bâtiments des réacteurs nucléaires suite aux accidents graves de Tchernobyl (en Ukraine, 1986) et Fukushima (au Japon, 2011), le projet « Maitrise du confinement d’une enceinte en accident » (MACENA) soutenu par l'Agence Nationale de la Recherche (ANR) a été lancé depuis 2013. Les campagnes expérimentales et les travaux de modélisation dans ce projet sont basés sur une maquette expérimentale de confinement à l'échelle 1/3 nommée VeRCoRs qui est construite et surveillée par Electricité de France (EDF). Les principaux problèmes liés à l'exploitation à long terme des centrales nucléaires de plus de 50 ans sont le vieillissement du béton et la perte de précontrainte puisque l’enceinte de confinement est en béton précontraint. Ces phénomènes conduisent à un risque de fissurations qui pourrait être déterminant si les conditions induites par l’"Accident de Perte de Réfrigérant Primaire" (APRP) sont maintenues pendant plusieurs semaines. Les caractéristiques des matériaux de construction de l’enceinte de confinement nucléaire peuvent être également modifiées par les chargements avant l’APRP, conduisant éventuellement à une réduction des propriétés mécaniques (fissuration précoce, test de mises en pression, effet du séchage). Les conditions pendant l’APRP, c'est-à-dire l'augmentation de la température et de la pression relative de la vapeur dans l’enceinte, peuvent ensuite faire propager ces fissures. Ainsi, les capacités de confinement dépendent de l'histoire des sollicitations depuis le coulage du béton.
Dans ce contexte, cette thèse présente une stratégie de calcul pour considérer l'accumulation de l’endommagement en utilisant un seul modèle mécanique depuis le jeune âge jusqu’à l’APRP, ce modèle est toutefois inclu dans un contexte global de modélisation faisant appel à d’autres modèles multiphysiques destinés à fournir les facteurs influents les plus importants tels que le degré d’hydratation, la température ou l’humidité. Ainsi, plusieurs modèles sont étudiés, améliorés ou testés dans ce travail de thèse : le premier modèle est consacré à la prédiction du degré d’hydratation, de la température, de la teneur en eau et de la porosité du béton au jeune âge, le second permet de suivre l’évolution de la température et de la saturation en eau en condition thermo hydrique ambiante ou proche des conditions APRP. Le modèle mécanique utilise les résultats des deux précédents pour estimer les déformations différées du béton, la relaxation des fils précontraints, et le risque de fissuration.
Cette méthodologie d’analyse a été mise au point pour éviter la perte d’information concernant l'état du matériau tout au long de la vie de la structure. Les principaux avantages de la méthodologie sont la possibilité de considérer automatiquement l'accumulation de l’endommagement depuis le jeune âge jusqu'à l’APRP d’une part et d’autre part les améliorations apportées au modèle matériau pour qu’il soit utilisable en conditions APRP, qui améliore la qualité de modélisation, y compris pour le jeune âge.
Mots clés: Comportement THCM du béton précontraint, fissure (précoce), confinement
nucléaire, effet d'échelle, relaxation des fils précontraints, fluage, retrait, endommagement thermique, déformation empêchée, séchage, hydratation, armatures réparties, température élevée, humidité
v
Table of Contents
Abstract ... i Résumé ... iii Table of Contents ... v List of Figures ... xiList of Tables ... xvii
I. GENERAL INTRODUCTION ... 2
I. 1. Industrial context ... 4
I. 2. ANR-PIA MACENA project ... 5
I. 3. Problematic of study ... 7
I. 4. Objectives and Methodology ... 8
I. 5. Organisation of the thesis manuscript ... 10
CHAPITRE I: THC simulation of early-age concrete nuclear containments ... 12
1. 1. Introduction ... 14
1. 2. State of the art ... 15
1. 2. 1. Effect of hydration on THC behaviour of concrete at early-age ... 15
1. 2. 2. Modelling of hydration of concrete ... 16
1. 2. 2. 1. Hydration kinetic law ... 18
1. 2. 2. 2. Water mass balance equation ... 20
1. 2. 2. 3. Heat balance equation and boundary conditions ... 20
1. 3. Strategy for concreting sequence modelling ... 21
1. 4. Application to the lower part of vessel mock-up VeRCoRs ... 23
1. 4. 1. Presentation of nuclear containment mock-up VeRCoRs ... 23
1. 4. 2. Formulation of VeRCoRs concrete and cement ... 25
1. 4. 3. Environmental conditions ... 26
1. 4. 4. Identification of model and material parameters ... 27
1. 4. 5. Validation of model on the structure ... 29
1. 5. Conclusion ... 31
CHAPITRE II: Simulation of Thermo-Hydric behaviour of Concrete at high temperature ... 32
2. 1. Introduction ... 34
vi
2. 2. 1. Transport mechanisms and phase changes ... 35
2. 2. 2. Heat transfer ... 36
2. 2. 2. 1. Heat transfer model ... 36
2. 2. 2. 2. Concrete conductivity ... 37
2. 2. 2. 3. Thermal capacity ... 40
2. 2. 2. 4. Concrete density ... 41
2. 2. 3. Moisture transfer ... 43
2. 2. 3. 1. Moisture transfer model ... 43
2. 2. 3. 2. Influence of temperature on moisture transfer ... 45
2. 2. 3. 3. Permeation of concrete ... 46
2. 2. 3. 4. Isotherm sorption curves ... 48
2. 3. TH modelling of saturated and unsaturated porous media ... 50
2. 3. 1. Constitutive model ... 50
2. 3. 1. 1. Governing equations ... 50
2. 3. 1. 2. Choice of state variables ... 51
2. 3. 1. 3. Temperature dependency of the isotherm sorption curve ... 52
2. 3. 1. 4. Relationship between 𝒑𝒗 and 𝒑𝒍 equivalent to the Kelvin-Laplace law .. 53
2. 3. 1. 5. Heat and hydric balance equations and numerical implementation ... 55
2. 3. 2. Evolution of thermal and hydric parameters ... 57
2. 3. 2. 1. Evolution of thermal properties of concrete ... 57
2. 3. 2. 2. Evolution of water properties ... 59
2. 4. Application on MAQBETH mock-up ... 65
2. 4. 1. Presentation of MAQBETH structure, mesh and boundary conditions ... 65
2. 4. 2. Numerical results... 66
2. 4. 3. Parametrical studies on permeability ... 69
2. 5. Conclusion ... 70
CHAPITRE III: Simulation of reinforced concrete behaviour under different THCM loadings ... 72
3. 1. Introduction ... 74
3. 2. State of the art ... 76
3. 2. 1. Effect of hydration on mechanical behaviour of concrete ... 76
3. 2. 1. 1. Mechanical threshold of cementitious materials at early age ... 76
3. 2. 1. 2. Cracking at early age ... 77
3. 2. 2. Effect of temperature and humidity on hardened concrete mechanical behaviour ………79
vii
3. 2. 2. 1. Effect on elastic modulus and Poisson coefficient ... 80
3. 2. 2. 2. Effect on tensile strength ... 83
3. 2. 2. 3. Effect on compressive strength ... 84
3. 2. 2. 4. Effect on fracture energy ... 86
3. 2. 3. Effect of temperature and humidity on delayed strains of concrete ... 88
3. 2. 3. 1. Influence of temperature ... 90
3. 2. 3. 2. Influence of water content ... 91
3. 2. 3. 3. Thermal induced damage at material scale ... 92
3. 2. 4. Creep modelling ... 93
3. 2. 5. Crack modelling ... 94
3. 2. 5. 1. Isotropic elastic damage model ... 95
3. 2. 5. 2. Orthotropic damage model ... 96
3. 2. 6. Influence of temperature on reinforcement behaviour ... 97
3. 2. 6. 1. Reinforcement behaviour at high temperature ... 97
3. 2. 6. 2. Bond behaviour of reinforcement-concrete at high temperature ... 99
3. 3. Modelling of reinforced concrete at high temperature and humidity ... 104
3. 3. 1. Presentation of concrete model at moderate temperature and humidity ... 104
3. 3. 1. 1. Rheological model ... 104
3. 3. 1. 2. Damage model ... 110
3. 3. 2. Adaptation for large meshes of massive structures ... 113
3. 3. 3. Adaptation for early age concrete ... 114
3. 3. 4. Adaptation for concrete at high temperature and humidity ... 116
3. 3. 4. 1. Effect of temperature and humidity on mechanical strength ... 116
3. 3. 4. 2. Effect of temperature and humidity on damage variable ... 118
3. 3. 4. 3. Behaviour law of concrete at high temperature ... 120
3. 3. 5. Adaptation for reinforced concrete structure ... 121
3. 4. Applications of MACENA experiments (LMDC, IPPRA, CERIB) ... 126
3. 4. 1. Formulation of VeRCoRs concrete ... 126
3. 4. 2. Identification of model and material parameters ... 126
3. 4. 3. Validation of new evolution laws with experiments ... 131
3. 4. 3. 1. Instantaneous behaviour under effect of temperature and humidity ... 131
3. 4. 3. 2. Delayed deformations in compression at moderate temperature ... 132
3. 4. 3. 3. Delayed deformations in compression at high temperature ... 133
3. 4. 3. 4. Delayed deformations in tension at high temperature ... 134
viii
CHAPITRE IV: Effect of temperature and prestress ratio on relaxation of prestressing
wires ... 138
4. 1. Introduction ... 140
4. 2. State of the art ... 141
4. 2. 1. Temperature influence on mechanical properties of prestressing wires ... 141
4. 2. 2. Temperature influence on the relaxation of prestressing tendons ... 143
4. 3. Development of relaxation model ... 145
4. 3. 1. Model principles ... 145
4. 3. 2. Nonlinear Maxwell level strain ... 146
4. 3. 2. 1. Non-linear effect of loading ratio ... 147
4. 3. 2. 2. Temperature effect ... 148
4. 3. 3. Kelvin level strain ... 149
4. 3. 4. Numerical implementation ... 150
4. 4. Applications ... 151
4. 4. 1. Identification of model and material parameters ... 151
4. 4. 2. Validation ... 154
4. 5. Conclusion ... 155
CHAPITRE V: Scale effect consideration for application on massive structures ... 156
5. 1. Introduction ... 158
5. 2. State of the art ... 158
5. 2. 1. Size effect phenomena ... 158
5. 2. 2. Modelling of probabilistic size effect in tension ... 160
5. 3. Probabilistic scale effect model ... 161
5. 3. 1. Weibull scale effect ... 161
5. 3. 2. Weakest Link Localization method (WL2) ... 162
5. 3. 3. Numerical implementation ... 163
5. 4. Application to nuclear wall mock-up PACE 1450 ... 164
5. 4. 1. Presentation of PACE 1450 structure... 164
5. 4. 2. Mesh and boundary conditions ... 168
5. 4. 3. Thermal and mechanical results ... 170
5. 5. Application to the lower part of vessel mock-up VeRCoRs ... 172
5. 5. 1. Benchmark VeRCoRs 2015 ... 173
5. 5. 2. Study of the lower part of the whole vessel containment ... 176
5. 6. Conclusion ... 179
ix
Annexes ... A-1
Annexe 1: Technical data sheet of cement ... A-1 Annexe 2: Technical data sheet of aggregates ... A-2 Annexe 3: Technical data sheet of superplasticizer ... A-5
xi
List of Figures
Figure I-1: Nuclear Power Plants in France. The numbers indicate the number of reactors at a
particular plant site (IAEA, 2016) ... 4
Figure I-2: Research project in the framework of previous activities (Hermann et al., 2009) .. 5
Figure I-3: Organisation chart of MACENA project (3SR Grenoble, CEA, IFSTTAR, IPRA Pau, LMDC Toulouse, CERIB, EDF R&D, NECS and OXAND, 2012) ... 6
Figure I-4: Phenomena to consider for a LOCA analysis (Sellier et al., 2016) ... 9
Figure I-5: Framework and methodology for the envisioned modelling ... 9
Figure I-6: Global scheme of THCM model... 10
Figure 1-1: Equivalent convective coefficient with formwork ... 21
Figure 1-2: Modelling of concreting sequence during the gusset construction (piece of VeRCoRs structure) (a) heating phase, (b) formwork removal phase ... 22
Figure 1-3: Nuclear reactor building VeRCoRs mock-up (EDF, 2014) ... 23
Figure 1-4: Axisymmetric section of structure VeRCoRs ... 24
Figure 1-5: 3D mesh of whole structure VeRCoRs with soil (only a half of the structure is presented here) ... 24
Figure 1-6: Evolution of air temperature and heating temperature during gusset formwork (𝑡 = 0 corresponds to calculation time 834h) (EDF, 2014) ... 26
Figure 1-7: Calibration of heat of hydration of pure Portland cement (Isothermal calorimeter test at 20°C and 40°C) ... 28
Figure 1-8: Prediction of temperature evolution of concrete in adiabatic condition (Adiabatic calorimeter test by CEBTP) ... 28
Figure 1-9: Numerical and experimental results for thermal evolution of gusset ... 29
Figure 1-10: Model’s responses in terms of (a) temperature, (b) porosity, (c) water content, (d) hydration degree obtained at 16h after gusset casting ... 30
Figure 1-11: Temperature fields at different instance of construction sequence ... 31
Figure 2-1: Schematic representation of water transport and phase changes in cement paste (Benboudjema, 2002) ... 35
Figure 2-2: Dehydration of concrete with temperature (Wang, 2016) ... 36
Figure 2-3: Thermal conductivity Vs Temperature (* TPS = Transient Plane Source) ... 38
Figure 2-4: Dependence of thermal conductivity on temperature ... 39
Figure 2-5: Thermal Capacity Vs Temperature and Saturation degree ... 41
Figure 2-6: Effect of temperature on the density of concrete made from different types of aggregates (a) expanded clay (light aggregates) (b) silico-calcars (c) quartzite and (d) basalt (Bazant and Kaplan, 1996) ... 42
Figure 2-7: Evolution of density of different concretes with temperature (Schneider, 1988) . 42 Figure 2-8: Evolution of mass of different concretes with temperature (Kodur, 2014) ... 42
Figure 2-9: Evolution of concrete density with temperature (Anderberg, 2003; Nguyen, 2013) ... 42
Figure 2-10: Schema of moisture movement within heated concrete element ... 46
Figure 2-11: Permeability measures on ordinary concrete (Picandet, 2001) ... 47
Figure 2-12: Isotherm sorption curves at different temperatures ... 49
xii
Figure 2-14: Influence of temperature on isotherm sorption curves (thick lines are the curves
from the proposed model) ... 53
Figure 2-15: Comparison of relation 𝑝𝑣, 𝑝𝑙 to the Kelvin-Laplace’s law ... 54
Figure 2-16: Continuous description of moisture diffusion for saturated-unsaturated media at 20°C and 100°C ... 56
Figure 2-17: Outline of the thermo-hydric analysis ... 57
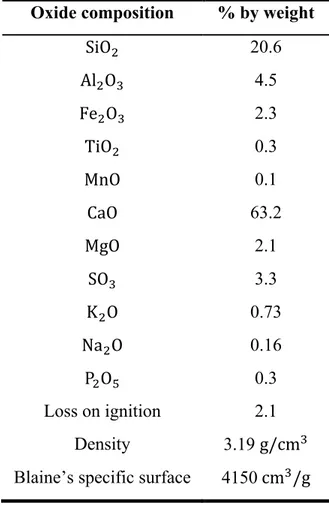
Figure 2-18: Dependence of thermal properties of concrete on temperature ... 58
Figure 2-19: Water density Vs Temperature ((Raznjevic, 1970) cited by (Hassen, 2006)) .... 59
Figure 2-20: Liquid dynamic viscosity Vs Temperature ... 60
Figure 2-21: Gas dynamic viscosity Vs Temperature ... 60
Figure 2-22: Relative permeability versus saturation degree (van Genuchten, 1980; KALLEL, 2016; Kameche et al., 2014; Monlouis-Bonnaire et al., 2004; Sogbossi, 2017) ... 61
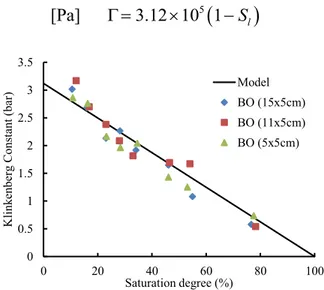
Figure 2-23: Evolution of Klinkenberg coefficient with saturation degree of concrete (Kameche et al., 2014) ... 62
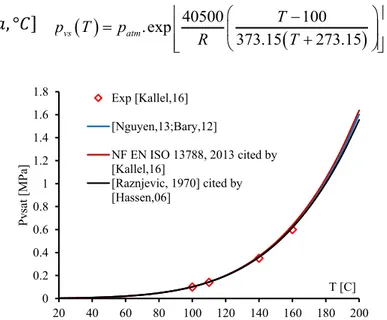
Figure 2-24: Saturated vapour pressure Vs Temperature ... 63
Figure 2-25: Geometrical characteristics of MAQBETH mock-up (concrete hollow cylinder) (a) and schematic description of experimental conditions (b) (Bary et al., 2012) ... 66
Figure 2-26: Thermal loading history on the inner surface (left) and initial conditions and boundary conditions applied to the 2D axial symmetric model (right) (Bary et al., 2012) ... 66
Figure 2-27: Comparison of radial temperature profiles at different times (hours) between the simulation (lines) and experimental measurements (symbols) (Bary et al., 2012) ... 67
Figure 2-28: Comparison of radial relative humidity ℎ𝑟(a) and liquid saturation 𝑆𝑙(b) profiles at different times (hours) between the simulation (lines) and experimental measurements (symbols) (Bary et al., 2012) ... 68
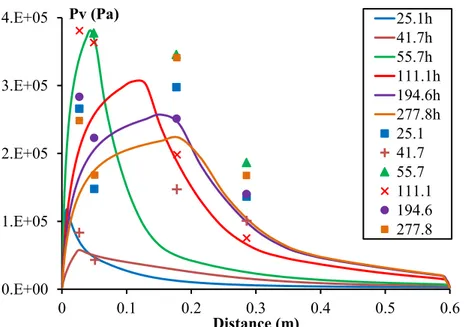
Figure 2-29: Comparison of radial gas pressure profiles 𝑝𝑣 at different times (hours) between the simulation (lines) and experimental measurements (symbols) (Bary et al., 2012) ... 68
Figure 2-30: Comparison of 𝑘𝑔 and 𝑘𝑙 effects on 𝑝𝑣 responses ... 70
Figure 3-1: Scheme of percolation threshold during hydration (Stefan et al., 2010) ... 77
Figure 3-2: Evolution of Young’s modulus with different 𝑤𝑐 (experiment issued from (Boumiz, 1995)) ... 77
Figure 3-3: 3D mesh of restrained shrinkage structure RG8 (Buffo-Lacarrière et al., 2014) .. 78
Figure 3-4: Evolution of instantaneous characteristics with hydration degree (Buffo-Lacarrière et al., 2014) ... 78
Figure 3-5: Damage field during heating and cooling phase (Buffo-Lacarrière et al., 2014) . 79 Figure 3-6: Crack pattern (Buffo-Lacarrière et al., 2014) ... 79
Figure 3-7: Evolution of (residual) elastic modulus according to the temperature ... 81
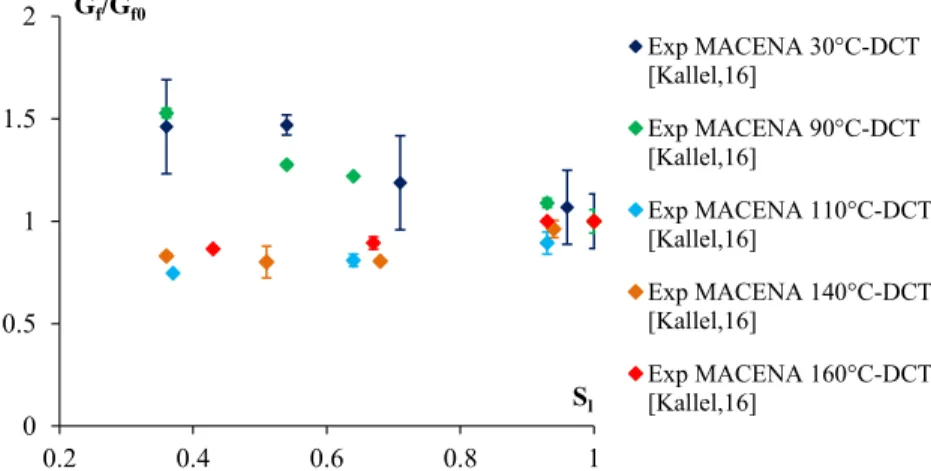
Figure 3-8: Evolution of elastic modulus with saturation degree (Kallel, 2016; Shoukry et al., 2011) ... 82
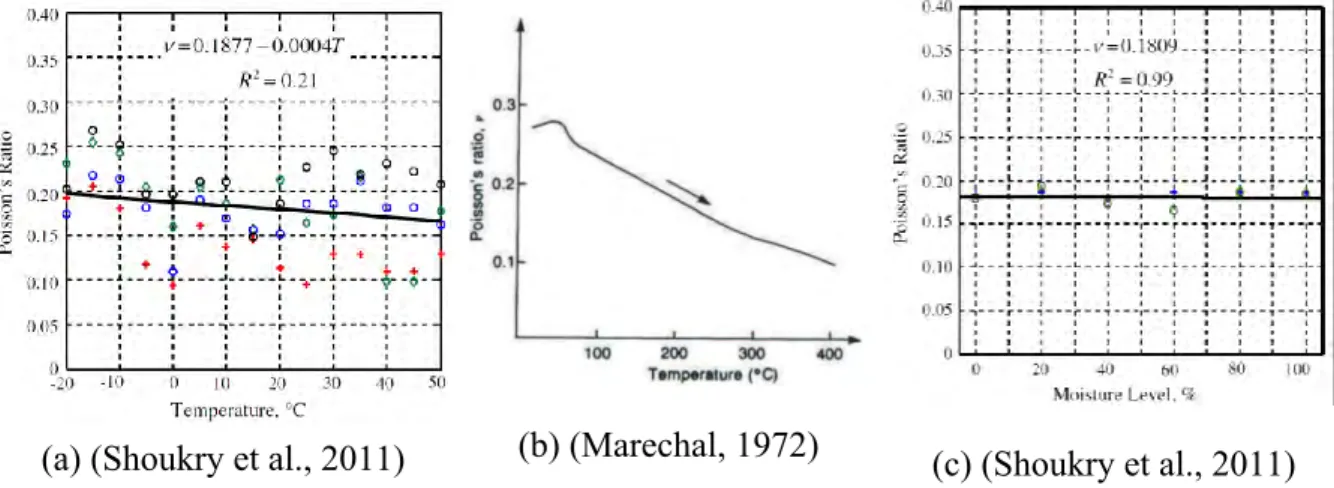
Figure 3-9: Evolution of Poisson coefficient with temperature and moisture content ... 82
Figure 3-10: Evolution of tensile strength with temperature ... 83
Figure 3-11: Evolution of tensile strength with moisture levels ... 84
Figure 3-12: Evolution of residual compressive strength with temperatures ... 85
Figure 3-13: Evolution of residual compressive strength with moisture levels (Shoukry et al., 2011) ... 86
Figure 3-14: Evolution of fracture energy according to the temperature ... 87
xiii
Figure 3-16: Scheme of various time-dependent strains of concrete (ACI Committee 209,
2005) ... 89
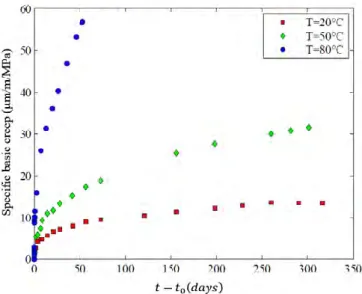
Figure 3-17: Evolution of time dependent specific basic creep of concrete at different temperatures (20°C, 50°C and 80°C) under uniaxial compression test of (Ladaoui, 2010) .... 90
Figure 3-18: Evolution of time dependent basic creep of concrete at different temperatures (20°C, 40°C and 70°C) under uniaxial compression (15 MPa applied after heating) at LMDC in MACENA project (Nguyen et al., 2017b) ... 91
Figure 3-19: Evolution of time dependent basic creep of concrete at different temperatures (20°C, 100°C and 180°C) under uniaxial tension (13.5 MPa applied after heating) at CERIB in MACENA project (Daval, 2016) ... 91
Figure 3-20: Incompatibility of thermal deformation of cement paste and aggregates ... 92
Figure 3-21: Mechanisms of basic creep (a) short-term micro-diffusion of water and (b) sliding of C-S-H sheets (Ulm and Acker, 1998) ... 93
Figure 3-22: Softening behaviour of concrete under a tension test ... 94
Figure 3-23: Scheme of effective stress ... 95
Figure 3-24: Scheme of tensile tests on rebars (a) and temperature evolution along heated section (b) (Toumi Ajimi et al., 2017) ... 98
Figure 3-25: Influence of temperature on the tensile behaviour of rebars and comparison with (Eurocode 2, 2005) and (Li et al., 2003) ... 98
Figure 3-26: Scheme of the pull-out tests(a) and temperature evolution at the interface before tests at 40, 100 and 140°C (b) (Toumi Ajimi et al., 2017) ... 99
Figure 3-27: Degradation mechanism of steel-concrete bond (Dominguez Ramirez, 2005) 100 Figure 3-28: Evolution of ultimate shear stress with temperature for HA12/HA16 (a) and obtained interfacial behaviours at different temperatures for HA12 (b) (Toumi Ajimi et al., 2017) ... 100
Figure 3-29: Water flow along rebar during heating at 100 and 140°C (Toumi Ajimi et al., 2015) ... 101
Figure 3-30: Cracks observed for concrete at 100 and 140°C (Toumi Ajimi et al., 2015).... 101
Figure 3-31: Bond stress-slip curve defined by (FIB, 2000) ... 101
Figure 3-32: Bond-slip model (Rolland, 2015) ... 101
Figure 3-33: Interfacial zone model with thickness. Steel bar with bar element (a) (Hameed, 2010), (b) (Kolani et al., 2012), (c) heterogeneity consideration (Michou, 2015) and (d) steel bar with volumetric element (Handika, 2017) ... 103
Figure 3-34: Interface model without thickness (lineic element) (Mang et al., 2015) ... 103
Figure 3-35: 1D-3D model of steel cross section inside concrete (Llau et al., 2016) ... 103
Figure 3-36: Rheological scheme of the creep model ... 105
Figure 3-37: Evolution of water viscosity (inverse function of 𝐶𝑤𝑇 ) ... 108
Figure 3-38: Evolution of coefficient T p C ... 108
Figure 3-39: Idealised cracking pattern used to compute tensile damage (Sellier et al 2013a) ... 112
Figure 3-40: Behaviour law of hardened concrete under tension-compression cycles with damage (𝑅𝑡 = 3 𝑀𝑃𝑎, 𝑅𝑐 = 30𝑀𝑃𝑎, 𝐺𝑓𝑡 = 100𝐽/𝑚2, 𝐺𝑓𝑟 = 100𝐽/𝑚2) (Sellier, 2015) 112 Figure 3-41: Uniaxial tensile behaviour modelling (softening part given for different element sizes) ... 114
Figure 3-42: Effect of hydration on the behaviour law of evolutive concrete under tension-compression cyclic (𝑅𝑡 = 3 𝑀𝑃𝑎, 𝑅𝑐 = 30𝑀𝑃𝑎, 𝐺𝑓𝑡 = 100𝐽/𝑚2, 𝐺𝑓𝑟 = 100𝐽/𝑚2) ... 116
xiv
Figure 3-43: Response under cyclic tension loading ... 116
Figure 3-44: Evolution of relative tensile strength with temperature and degree of saturation ... 117
Figure 3-45: Evolution of coefficient CPc T, at 𝑇𝑟𝑒𝑓 = 20℃ ... 118
Figure 3-46: Evolution of coefficient T p C ... 119
Figure 3-47: Evolution of coefficient A ... 119TH Figure 3-48: Evolution of thermohydric damage coefficient
D
TH ... 120Figure 3-49: Effect of temperature on behaviour law of hardened concrete under tension-compression cycle test ... 121
Figure 3-50: Idealized scheme for modelling reinforced concrete ... 122
Figure 3-51: Concrete mesh and mechanical boundary conditions ... 124
Figure 3-52: (a), (b), (c) Steel ratio in three directions X, Y, Z and (d) Comparison of experimental crack pattern (below) and computed damage pattern (above) for load 90kN .. 125
Figure 3-53: Comparison of experimental and calculated force-deflection curves ... 125
Figure 3-54: Hydration development at centre of 11 x 22 cm specimen obtained from hydration model (points represent ages of concrete used for measures) ... 127
Figure 3-55: Evolution of instantaneous characteristics according to hydration development (a) 𝐸, (b) 𝑅𝑐, (c) 𝑅𝑡 (experimental results obtained from different laboratories in MACENA project) ... 127
Figure 3-56: LMDC test of concrete creep under uniaxial compression at 20°C ( 𝑓𝑐𝑚 ≈ 52𝑀𝑃𝑎) ... 128
Figure 3-57: DCT specimen (a) and its mesh (b) ... 131
Figure 3-58: Force-displacement evolutions under variable TH conditions ... 132
Figure 3-59: Strains of concrete at 40°C ... 133
Figure 3-60: Uniaxial drying creeps of concrete in compression at 100 and 180°C (CERIB tests) and at 40°C (LMDC test) ... 134
Figure 3-61: Deformation during the 2 first days of creep tests in temperature ... 134
Figure 3-62: Geometry of specimen for creep tests in tension (Daval, 2015) ... 135
Figure 3-63: Uniaxial creep of concrete in tension at 100 and 180°C (CERIB tests) ... 135
Figure 4-1: Evolution of mechanical tensile behavior of prestressing wires with temperature (Toumi Ajimi et al., 2017) and comparison with (Eurocode 2, 2005) and (Li et al., 2003) .. 142
Figure 4-2: Evolution of relaxation with different temperatures and loading ratios (0.7 (a) and 0.8 (b)) (Toumi Ajimi et al., 2017) ... 144
Figure 4-3: Scheme of relaxation sample with the heating device on the prestressing wire (a) and temperature evolution along the heated section (b) (Toumi Ajimi et al., 2017) ... 144
Figure 4-4 : Idealized rheological scheme for relaxation model ... 146
Figure 4-5 : Nonlinear amplification function k versus loading level ... 148M Figure 4-6 : Comparison between model and experimental results of relaxation versus time for different temperatures and loading ratios (0.7 and 0.8) ... 153
Figure 4-7: Comparison of model with relaxation experiment at stepwise cooling (140°C, 100°C and 20°C) ... 153
Figure 4-8 : Comparison of model with test of relaxation with a stepwise heating (20°C, 100°C and 140°C) ... 154
xv
Figure 5-1: Experimental dispersion of concrete tensile strength as function of the smallest dimension of the specimen (Clément, 1987; Farra, 1994; Mivelaz, 1996; Rossi et al., 1994;
Van Vliet and Van Mier, 2000) cited by (Ghannoum, 2017) ... 160
Figure 5-2: Scheme of tensile strength (Rt) vs. specimen diameter (D) and compressive strength (fc) (Rossi et al., 1994)) ... 160
Figure 5-3: Evolution of 𝑚 as function of 𝐶𝑣 (Sellier and Millard, 2014) ... 161
Figure 5-4: Dispersion of measures of tensile strength at 28 days from different laboratories in MACENA project ... 162
Figure 5-5: Evolution of tensile strength due to scale effect (CEOS.fr, 2016) ... 163
Figure 5-6: Geometry and dimension of specimen PACE 1450 (Hermann et al., 2009) ... 165
Figure 5-7: Horizontal section of specimen PACE 1450 (Hermann et al., 2009) ... 165
Figure 5-8: Vertical section of specimen PACE 1450 (Hermann et al., 2009) ... 165
Figure 5-9: Mechanical boundary conditions and photo of the set-up (Hermann et al., 2009) ... 167
Figure 5-10: Pressure scenario for RUN 1 to RUN 3 (left) and test control (right) (Hermann et al., 2009) ... 167
Figure 5-11: Illustration of external loading on PACE mock-up according to time (effect of creep is assumed neglected between RUN 2 and RUN 6) ... 168
Figure 5-12: Mesh of PACE 1450 and its boundary conditions ... 169
Figure 5-13: Scheme of computed Vmax ... 169
Figure 5-14: Ratio of distributed reinforcement along radial axe (a), circumferential axe (b), vertical axe (c) and prestressing wire along circumferential axe (d) ... 169
Figure 5-15: Evolution of temperature at the centre of specimen according to time (experimental results obtained from (Rospars, 2016)) ... 170
Figure 5-16: Comparison of prestressing force change during RUN 2 (experimental points obtained in (Hermann et al., 2009)) ... 171
Figure 5-17: Comparison of internal strain during RUN 2 (experimental results S1, S5, S10 obtained in (Hermann et al., 2009)) ... 171
Figure 5-18: Comparison of crack pattern at external surface of PACE during RUN 6 with numerical results (crack measure given by (Hermann et al., 2009)) ... 172
Figure 5-19: Mesh of a piece of VeRCoRs structure (angle about 4.5°) ... 173
Figure 5-20: Representation of computed Vmax (a) and ratio of distributed reinforcement in radial (b), tangential (c), vertical (d) direction ... 174
Figure 5-21: Comparison of measured (points) and numerical (curves) deformations at different points (red curve= RC modelling, black curve=Concrete modelling without reinforcement) ... 175
Figure 5-22: Structural effect of distributed reinforcement on the crack pattern of gusset structure... 175
Figure 5-23: 3D mesh of lower part of whole vessel VeRCoRs standing on the soil (only a half of modelled structure is presented here) ... 176
Figure 5-24: Representation of computed Vmax (a) and ratio of distributed reinforcement in radial (b), tangential (c), vertical (d) direction for a half of modelled structure ... 177
Figure 5-25: Comparison of measured (points) and numerical (blue curve) deformations at different points ... 177
Figure 5-26: Comparison of crack patterns from models (concrete and reinforced concrete) with experimental measurements on intrados of gusset 5 days after casting ... 178
xvi
Figure 5-27: Comparison of crack patterns from models (concrete and reinforced concrete) with experimental measurements on extrados of gusset 5 days after casting ... 178 Figure 5-28: Numerical crack pattern of VeRCoRs gusset 5 days after casting (25 cracks in total) ... 179 Figure A-1: Technical data sheet of cement ... A-1 Figure A-2: Technical data sheet of aggregate 0/4 ... A-2 Figure A-3: Technical data sheet of aggregate 4/11 ... A-3 Figure A-4: Technical data sheet of aggregate 8/16 ... A-4 Figure A-5: Technical data sheet of superplasticizer (a) ... A-5 Figure A-6: Technical data sheet of superplasticizer (b) ... A-6
xvii
List of Tables
Table I-1: Experimental campaign program of MACENA project ... 6
Table 1-1: Number of meshed elements ... 24
Table 1-2: Chemical oxide composition of Clinker ... 25
Table 1-3. Formulation of VeRCoRs concrete ... 25
Table 1-4: Construction procedure of VeRCoRs ... 26
Table 1-5: Boundary condition model parameters (EDF, 2014) ... 27
Table 1-6: Hydration kinetics parameters ... 28
Table 1-7. Thermal parameters of concrete (EDF, 2014) ... 28
Table 1-8: Hydric parameters of similar concrete (Mensi et al., 1988) ... 28
Table 2-1: Transport mechanisms in the concrete ... 35
Table 2-2: Mass capacity of concrete component (Neville, 2000) ... 40
Table 2-3: Parameters for Van Genuchten’s relation of relative permeability ... 61
Table 2-4: Main functions introduced for the simulation ... 63
Table 2-5: Intrinsic parameters of model ... 64
Table 2-6: Material properties ... 64
Table 2-7: Different case studies of intrinsic permeability ... 69
Table 3-1: Exponents of De-Schutter law for material parameters ... 115
Table 3-2 : Concrete characteristics ... 124
Table 3-3 : Steel characteristics ... 124
Table 3-4: Mix design of VeRCoRs concrete ... 126
Table 3-5: Model parameters issued from literature (and common for similar concretes) and material parameters for the VeRCoRs’s concrete (in bold and red symbol) ... 129
Table 4-1 : Experimental mechanical properties of prestressing wires (tensile tests) (Toumi Ajimi et al., 2017) ... 142
Table 4-2: Model parameters and material parameters (in bold and red symbol) for prestressing wires T15.2 at 𝑇𝑟𝑒𝑓 = 20℃ ... 152
2
I.
GENERAL INTRODUCTION
I. 1. Industrial context ... 4
I. 2. ANR-PIA MACENA project ... 5
I. 3. Problematic of study ... 7
I. 4. Objectives and Methodology ... 8
General Introduction
4
I. 1. Industrial context
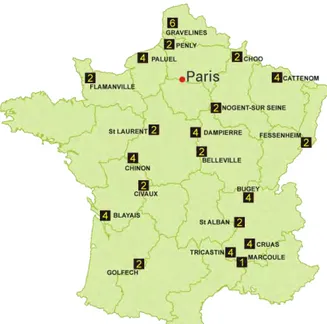
The first nuclear power plant in France was opened in 1962. Actually, France has 58 nuclear reactors operated by Electricité de France (EDF), with a total capacity of 63.2 GWe, supplying 436 TWh in 2014 equivalent to 77.5% of the electricity used in France (see Figure I-1) (Bottin, 2017).
Figure I-1: Nuclear Power Plants in France. The numbers indicate the number of reactors at a particular plant site (IAEA, 2016)
France becomes then the world’s largest electricity producer from nuclear energy after the United States. But the French Nuclear industry has to face with two main problems: first the ageing of its nuclear power plants which some of them arrive at their design lifetime, and secondly there is an increasing demand of safety demonstration following the severe accidents of Chernobyl (in Ukraine, 1986) and Fukushima (in Japan, 2011). Therefore, the different nuclear agencies and the French government work together incessantly to control the nuclear risk. As can be seen in Figure I-2, a number of research programs sorted in dimension and complexity are realised to enhance the knowledge of prestressed concrete in order to predict more accurately the behaviour of a double wall concrete vessel in case of “Loss-of-coolant accident” (LOCA). If such an accident happens, the vapour will be stopped by the double concrete wall system and redirected to filters which work under a 4 bars relative pressure. At this pressure level, the vapour temperature inside the vessel can reach 180°C and be maintained until two weeks. This vapour pressure and temperature loading constitute the internal conditions in the scenario of LOCA.
General Introduction
5
Figure I-2: Research project in the framework of previous activities (Hermann et al., 2009)
In the context of life extension of nuclear containment structures, EDF decided in 2010 to build a 1/3 scaled mock-up VeRCoRs (Realistic verification of reactor containment) (EDF, 2014) in order to study the ageing mechanism in concrete and prestressing losses of a 1300 MWe double-wall reactor building, which are the main phenomena that could modify the tightness of an inner containment in prestressed and reinforced concrete.
The French National Project CEOS.fr (2009) has been initiated to further research on the influence of Thermo-Hydro-Mechanical (THM) effect and size effect on the behaviour of massive structures in order to estimate the strains and concrete crack pattern. In this context, the “Non Destructive Evaluation of nuclear plants containment” (ENDE) project and the “Confinement Assessment of a vessel during an Accident” (MACENA) project with nine partners (six research institutes and three industrials) supported by the French National Research Agency (ANR), work on tools to predict accurately the double wall mechanical behaviour in case of LOCA. The experimental campaigns and modelling works of MACENA project are based on VeRCoRs mock-up.
I. 2. ANR-PIA MACENA project
The major objective of research project MACENA is to provide an accurate finite element model able to predict if a vapour leakage would be possible in the condition of LOCA scenario. To respond to this objective, the project is organised into four work packages (WPs) (see Figure I-3).
This PhD thesis is funded by the French National Research Agency (ANR) in the framework of this project ANR-PIA MACENA. The present work is a part of WP1 (Assessment of structural state before an accident) and WP2 (Study of instantaneous and delayed mechanical
General Introduction
6
behaviour of concrete and relaxation of prestressing cables during an accident and simulation of the real structures at a different scale (PACE 1450, VeRCoRs)).
Figure I-3: Organisation chart of MACENA project (3SR Grenoble, CEA, IFSTTAR, IPRA Pau, LMDC Toulouse, CERIB, EDF R&D, NECS and OXAND, 2012)
The experimental campaign program of MACENA project aiming to investigate the behaviour of the prestressed concrete specimen under the conditions envisioned in the LOCA scenario is summarised in Table I-1. The main task of the present thesis is then to develop a THCM model able to cover the phenomena quantified in these experimental campaigns.
Table I-1: Experimental campaign program of MACENA project
Laboratory Experimental tests
IFSTTAR Nantes (Toumi Ajimi et al.,
2017)
Influence of temperature on the interface behaviour of steel-concrete Influence of temperature on the relaxation of prestressing cable T15.2 Influence of temperature on the tensile behaviour of prestressing cable
T15.2
Influence of temperature on the tensile behaviour of reinforced bars HA12 and HA16
SIAME (Kallel et al., 2017)
Influence of temperature and humidity on the instantaneous behaviour of concrete
General Introduction
7 LMDC
(Nguyen et al., 2017a, 2017b)
Creep of concrete cylinder under uniaxial compression (20, 40, 70°C – 50%, 80% HR, endogenous)
Creep of prestressed concrete beam under four-point bending test (20, 40, 70°C – 50%, 80% HR, endogenous)
Creep of non-reinforced concrete beam under four-point bending test (20, 40, 70°C – 50%, 80% HR, endogenous)
CERIB
(Daval, 2016) Creep under uniaxial compression and tension (100, 180°C)
I. 3. Problematic of study
This study concerns the double-wall reactor buildings without steel liner representing 24 out of the 58 nuclear reactors of EDF. Ageing mechanisms in concrete, for some nuclear power plants that have more than 50 years old, and prestressing losses have to be considered in the models, particularly because the internal concrete wall is prestressed with steel wires. With time, the prestress force is relaxed and on the other hand, the concrete, constantly compressed by the wires, leading to a concrete shrinkage and creeps in compression which contributes also to the loss of pre-stress. Previous studies about the delayed mechanical behaviour of concrete have indicated an increase of delayed strains with temperature rise: the basic creep can be multiplied by 10 at 80°C, and coupling between creep and heating can lead to damage and to transient thermal creep (Cagnon, 2015; Ladaoui et al., 2013). This phenomenon can be observed also on the relaxation of wires with temperature rise and different initial pre-stress (Toumi Ajimi et al., 2017). These phenomena could be significant if the LOCA induced conditions are maintained for several weeks. So, while the prestress is able to balance the tensile stress induced by the internal pressure in case of LOCA, the leak risk is consequently low. But if the concrete passes in tension even locally due to the loss of prestress, cracks can occur and thus there is a risk of radioactive leakage. Obviously, the concrete can resist itself to a tensile stress of a few MPa, but an estimation of the current tensile strength of a 50-year-old concrete is not so easy to know for different reasons. First, the concrete tensile strength depends on strain, it decreases when the strain exceeds the tensile strain, which leads to a progressive strain localisation and finally causes a localised crack. Therefore, once a tensile strain has been reached, for instance at an early age before the pre-stressing or during a decennial pressurisation test, the apparent tensile strength will be reduced. Another problem is the heterogeneity of concrete. The heterogeneous composition of concrete leads to different measured concrete characteristics of the specimens with the same concrete mix design. The variability (coefficient of variation) of the tensile strength measured on small specimens in several laboratory tests varies from 10 % to 20%. This heterogeneity of concrete leads to a
General Introduction
8
reduction of the tensile strength, which is known as “scale effect” and it is impossible to neglect in the case of large structures as shown during the CEOS.fr (2009) project.
I. 4. Objectives and Methodology
As mentioned above, several phenomena influencing the cracking occurrence have to be considered to predict the risk of radioactive vapour leak in case of LOCA (summarised in Figure I-4) (Sellier et al., 2016). The material characteristics of nuclear containment building can be modified by the loading prior to the LOCA, leading possibly to a reduction of tensile strength and early age cracking, and the loading during the LOCA, i.e. increase of temperature and vapour relative pressure. Each of these phenomena can occur independently and its consequences in terms of mechanical damage, inelastic strains and chemical evolution are most of the time irreversible. Thus, the material properties just before the LOCA depend on the solicitation history since the concrete pouring. Several computational strategies can be adapted to consider the damage accumulation, for instance several models can be chained, a first one dedicated to the prediction of early age cracking, a second one considering concrete ageing, delayed strains and wires relaxation, and a last one able to take into account the effects of temperature and vapour pressure in order to assess the cracking patterns during the LOCA. Therefore, chaining several models leads rapidly to numerical complications in terms of continuities of material state between two consecutive modelling, particularly when the internal state variables are not exactly the same between two consecutive models (for instance the damage variable can be a tensor in a model and a scalar in another one; the permanent strains can be split in a different number of tensors according to the model used). To avoid these problems of links between elementary models, a better alternative strategy consists to consider all the afore-mentioned phenomena relative to a given material in a single constitutive model. The main advantage is the continuity, along with the numerical modelling, of the internal state variables, which considers then automatically the damage accumulation until the LOCA. The principal objective of this thesis focuses on the constitutive model clarified in LMDC Toulouse (France) to consider the different phenomena involved in the concrete behaviour since its pouring until the LOCA. These phenomena will be discussed based on the literature review and the experimental campaign. Finally, this finite element model is applied on the real structures at a different scale, i.e. PACE mock-up, and VeRCoRs mock-up.
General Introduction
9
Figure I-4: Phenomena to consider for a LOCA analysis (Sellier et al., 2016)
To achieve this, a scientific approach has been adopted and divided into several studied steps from laboratory tests to large massive structures as shown in Figure I-5. Briefly, the behaviour of concrete, steel and prestressing wires as well as the behaviour of the concrete-reinforcement interface under the effect of temperature and humidity (only on concrete) have been studied separately. Once a coupling of THCM phenomena is achieved, the modelling of different structures can be done. The heterogeneity of structures at different scales will be considered thank to the statistical scale effect method derived from the CEOS.fr works (CEOS.fr, 2016; Sellier and Millard, 2014).
General Introduction
10
I. 5. Organisation of the thesis manuscript
More specifically, the major objective of this thesis is to propose a THCM model able to simulate to the massive prestressed concrete structures to predict their strains and cracking patterns. Figure I-6 illustrates a numerical methodology adapted to control the structure throughout its entire service lifetime. The chained and weakly coupled THCM model, remaining representative of the multi-physical behaviour of the structure, predicts the spatiotemporal evolution of the temperature, saturation degree and mechanical states since the casting date until the operational visit (VCs and VDs).
Figure I-6: Global scheme of THCM model
Hence, the manuscript is organised into five chapters:
Chapter 1 deals with the THC behaviour of early age concrete in nuclear containment building using a multiphasic hydration model. The fact that the large/complex structures have to be cast sequentially at a different time is inevitable. So, a proposed approach which consists on modelling the sequential casting of concrete without re-meshing the structure between each stage of casting is described. An inverse analysis with an adiabatic test is done to characterise the model parameters for the VeRCoRs concrete. Furthermore, in order to validate the methodology, it is also applied to concrete mock-up VeRCoRs to compare the evolution of temperature in the structure. The results are the temperature, porosity and water content fields which constitute the entry data for the next chapters.
Chapter 2 is dedicated to the proposal and test of an alternative method for modelling the temperature effect on the thermo-hydric transport in saturated-unsaturated media. Two
General Introduction
11
particularities are considered in this model: first, the effect of temperature on water retention curves; secondly, a continuous description of saturated and unsaturated media based on a formulation using only the temperature and liquid pressure as a state variable, even in unsaturated conditions. This TH modelling is developed in order to give a fast estimation of the temperature and saturation degree of concrete structures subjected to temperature rise and having a different saturated state. It allows characterising the concrete structure state in various TH conditions, particularly when the LOCA induced conditions occur. For the validation purpose, an experimental campaign found in the literature is considered: a test of MAQBETH mock-up (Ranc et al., 2003) with a variation of temperature up to 200°C close to the LOCA conditions in terms of temperature.
Chapter 3 gathers some literature reviews that studied on the instantaneous and delayed behaviour of concrete subjected to different environmental conditions, a coupling of THCM phenomena and their modelling. Moreover, the experimental campaign of MACENA projects is presented along with the numerical modelling. This chapter leads to three important aspects which have to be considered for an accurate concrete numerical modelling: effect of hydration, effect of humidity on the instantaneous and delayed behaviour of concrete, and damage of concrete subjected to temperature rise. Last but not least, the influence of temperature on the interface of reinforcement-concrete is presented and an alternative method to consider the structural effect of reinforcement in the massive structure, called “Distributed reinforcement” method, will be illustrated with a validation of proposed methodology on a three-point bending beam.
Chapter 4 presents an incremental model for prestressing steel relaxation under the various levels of loading and temperature. It calculates the delayed strain of prestressing wires involved in the relaxation phenomenon and takes the non-linear coupling of temperature and loading effects into account. The constitutive equations of the proposed model and its numerical implementation are described. Furthermore, the simulations of the experimental campaign of IFSTTAR/SMC (carried out in the framework of the MACENA project) for all the kinds of thermo-mechanical conditions envisioned during experiments are shown.
Chapter 5 aims to present the application of the THCM model to prestressed and reinforced concrete real structures of different dimensions. This chapter is divided into two main sections. The first section presents the method to model the scale effect. The second section focuses on the modelling of PACE 1450 structure which is a representative of nuclear containment wall and the nuclear containment vessel VeRCoRs.
12
CHAPITRE I
1.
THC simulation of early-age concrete
nuclear containments
« La vie, c’est comme une bicyclette, il faut avancer pour ne pas perdre l’équilibre » Albert
Einstein
1. 1. Introduction ... 14 1. 2. State of the art ... 15 1. 2. 1. Effect of hydration on THC behaviour of concrete at early-age ... 15 1. 2. 2. Modelling of hydration of concrete ... 16 1. 2. 2. 1. Hydration kinetic law ... 18 1. 2. 2. 2. Water mass balance equation ... 20 1. 2. 2. 3. Heat balance equation and boundary conditions ... 20 1. 3. Strategy for concreting sequence modelling ... 21 1. 4. Application to the lower part of vessel mock-up VeRCoRs ... 23 1. 4. 1. Presentation of nuclear containment mock-up VeRCoRs ... 23 1. 4. 2. Formulation of VeRCoRs concrete and cement ... 25 1. 4. 3. Environmental conditions ... 26 1. 4. 4. Identification of model and material parameters ... 27 1. 4. 5. Validation of model on the structure ... 29 1. 5. Conclusion ... 31
Chapter I: THC simulation of early-age concrete structure
14
1. 1. Introduction
Concrete generates heat as the cementitious material hydrates, and for thin structures heat dissipates almost as quickly as is generated, but, in case of large-scale structures such as nuclear containment vessels walls, temperature rise due to hydration heat is very important (i.e. more than 50°C), so management of concrete temperatures is necessary to prevent damages, minimize delayed deformations and reaches specifications. In fact, hardening of young concrete is associated with chemical processes accompanied by significant temperature and volume changes. In the early stage, the hydration process is highly exothermal and the generated heat may result in significant temperature changes. Therefore, concrete, for massive structures, are poured in successive layers at a different time to limit the high rise of temperature and facilitate the construction. However, additional checks are also required for the analysis of staged construction because the strains in the young concrete layer are restrained by the previous concrete layers and tensile stresses arise and induce the early cracking if the stress becomes greater than the strength of the material. Consequently, structural damage may occur before the main loading such as during LOCA, and the durability and serviceability of the construction may be significantly reduced.
This chapter is dedicated then to the study and modelling of the early age properties of VeRCoRs structures since setting time, corresponding to work of WP1 (Assessment of structural state before an accident) in the framework of ANR-PIA MACENA project (cf. INTRODUCTION). It is recalled that the 1/3 scale nuclear containment mock-up VeRCoRs is finely instrumented with more than 500 sensors so that the comparison of its behaviour is possible from the beginning of the construction. This nuclear reactor building is constructed in different stages such as pedestal foundation, basement, gusset, wall and dome. The evolution of temperature of this structure was evaluated by means of a thermocouple from the start of construction. Analysis of the temperature field due to hydration of concrete is a highly non-linear problem due to several reasons. The sequential casting is time-dependent and the filling sequences of the formwork are superimposed at different times. The thermal heat exchange between the concrete and the atmosphere is affected by the formwork, wind flow and external temperature. All these transient boundary conditions have to be taken into account in the finite element model. The experimental measurements enable to test and validate the numerical models for reproducing the most likely behaviour of the structure. In this work, a multiphasic hydration model is used to simulate the thermo-hydro-chemical behaviour of early-age
Chapter I: THC simulation of early-age concrete structure
15
concrete. This study is essential to assess the initial state of the structure before LOCA accident because it provides the input data for the mechanical modelling in the next chapters.
1. 2. State of the art
1. 2. 1. Effect of hydration on THC behaviour of concrete at early-age
Nuclear reactor containments are huge structures where the staged construction is unavoidable. During the construction of the walls, concrete lifts are about 2 m high, and the duration between lifts is about 15 days. The origins of the risk of early cracking for concrete may be distinguished by two features, internal restraint and external restraint. First, the internal restraint is induced by differential thermal dilation between the phases of concrete, cement paste and aggregate characterized by distinct values of the coefficient of thermal expansion. Moreover, it may be induced by the gradient of temperature between the centre and surface of concrete elements caused by the heat release during the hydration reaction. The thermal gradient results in the thermal strains and autogenous strains. While young concrete does not present a sufficient stiffness, stresses induced by these strains are very small compared to the strength. However, as soon as the stiffness increases, stresses appear and cracking may develop. Secondly, new concrete layer presents thermal and autogenous strains, while the strains of the old concrete layer have no more significant. Thus, the strains in the young concrete layer are externally restrained by the old concrete layer and tensile stresses arise.
One of the most important factors associated with thermal cracking in concrete is the evolution and distribution of the temperature increase at any time after casting. The temperature increase is due to the heat released by the hydration of the cement. To measure the heat of hydration of cement, adiabatic or semi-adiabatic calorimeters are used with tested concrete specimens of the same mix that was used on site. Such method aims at determining the evolution of the adiabatic temperature increase under conditions which are very similar to those at the centre of a large structure. The measurement method consists of introducing into the calorimeter a sample of fresh concrete just after the mixing and measuring the temperature of the specimen. Semi-adiabatic calorimeters rely on some form of insulation around the sample to slow down the rate of heat loss. And quasi-adiabatic calorimetry (NF EN 196-9) performed on the concrete specimen is used for the standardized determination of cement hydration heat.
Chapter I: THC simulation of early-age concrete structure
16
This input is essential for predicting, by numerical simulation, the thermo-hydro-chemical behaviour of structures. Knowing the hydration kinetic is essential to estimate the mechanical and rheological behaviour of concrete during its setting and hardening.
1. 2. 2. Modelling of hydration of concrete
Two levels of numerical models for predicting the development of hydration exist: microscopic and macroscopic model. Model of Jennings (Jennings and Johnson, 1986), DUCOM (MAEKAWA et al., 1996), HYMOSTRUC3D (Van Breugel, 1995), CEMHYD3D (Bentz, 1997; Bentz and Garboczi, 1991) and Wang (Wang et al., 2010) were based on microstructure modelling aiming at describing the microstructure evolution of cement during hardening with great realism but its computation was time-consuming, which is not appropriate for applications in massive structure modelling. As our study focuses on temperature and hydration development in massive structures, macroscopic models would be more interesting.
Several macroscopic models dealing with concrete hydration at the early age have been proposed (De Schutter, 1999; De Schutter and Taerwe, 1996; Kishi and Maekawa, 1994; Powers and Brownyard, 1947). These models can reproduce the combined hydration of concrete but do not explicitly consider the effect of water content on hydration. This effect is essential because it modifies not only the final degree of hydration (Hansen, 1986; Powers and Brownyard, 1947) but also the hydration kinetics (Bentz, 2006). Thus, models coupling hydration development and water content variation were suggested (Bentz, 2006; Oh and Cha, 2003). Waller (Waller, 1999) adapted a chemical affinity model of Ulm and Coussy (Ulm and Coussy, 1998) in order to take the effects of initial W/C ratio and mineral addition content into account. However, this asymptotic method cannot consider the desiccation or rehydration effects during hydration.
These considerations lead us to choose a multiphasic hydration model developed by Lacarrière (Buffo-Lacarrière et al., 2007) and recently extended by (El Bitouri et al., 2016; Kolani et al., 2012). This model considers, at any instant, the effects of temperature and water content on the hydration of several solid phases (clinker and mineral additions) and drying or rehydration effect. It is well suited to the prediction of early age thermo-hydro-chemo-mechanical behaviour because it takes into account coupling between the hydration development and water and temperature variations (which are needed to predict the strains that develop at an early age in concrete in endogenous conditions). It has been validated on several structures
(Buffo-Chapter I: THC simulation of early-age concrete structure
17
Lacarrière et al., 2007, 2011, 2014) and extended to consider the hydration of slag-bended cement (Kolani et al., 2012) and to take the long-term stoichiometry variation observed in low-pH cement (hydration of silica fume and variation of C/S ratio in C-S-H) into account (El Bitouri et al., 2016). The main interest of using this hydration model is that only three parameters (𝑘, 𝑟𝑘, 𝑛) are calibrated for the hydration kinetic law of each phase and they can be
characterized easily through Langavant semi-adiabatic calorimeter tests and/or isothermal calorimeter tests.
The hydration kinetic laws for different components, the total water mass balance equation and the heat balance are summarized by Eq. (1-1).
( , , , ) ( ) ( ) ( ) ( ) i i W thi i i thi i i F W T CH W div D grad W W f c T div grad T Q f
(1-1)With i=1 for the clinker, i >1 for the pozzolanic or hydraulic additions, α is the degree of hydration, W is the total water content of the concrete (in m3/m3 of concrete), T is the temperature, CH is the quantity of portlandite of the cement paste, Dw is the water transfer
coefficient, Wthi is the water needed for total hydration of anhydrous phase 𝑖, fi is the quantity
of anhydrous phase 𝑖, ρ is density, c is specific heat, λ is thermal conductivity and Qthi is the
heat produced by complete hydration of anhydrous phase 𝑖.
In addition, in real conditions, the thermal and hydric balance inside the materials is modified by the exchange at the contact between concrete and environment (air, solar radiation, and formwork …) which can be treated in this model via the boundary conditions.
The necessary input data for this model are: binder composition (including the mineral additions), concrete formulation, thermal characteristics (conductivity, capacity), temperature of the fresh concrete, and environmental conditions (formwork, wind, solar radiation, air temperature).
Chapter I: THC simulation of early-age concrete structure
18
1. 2. 2. 1. Hydration kinetic law
The hydration kinetic law below (Eq. (1-2)), proposed by (Buffo-Lacarrière et al., 2007) was modified by (Kolani et al., 2012) to simulate the hydration of slag-blended cement. It takes into account not only the thermal activation of the reactions following the Arrhenius law but also the phenomena that control them. At the beginning of hydration, the reactions are driven by dissolution-precipitation phenomena, hydration is accelerated due to supersaturation of interstitial solution (Taylor, 1990). When hydrate formation become preponderant, corresponding to a critical degree of hydration, the hydration kinetics is decreased by the difficulty of contact between water and anhydrous grains surrounded by a hydrated layer.
sup
i k gi i i h S Pi i
(1-2)
With k is a calibration constant depending on the anhydrous grinding, i g is the chemical i
activation term, iaccounts for the water accessibility to anhydrous phases, h is the thermal i
activation, S describes the interaction between portlandite and mineral additions, and i Psup
accounts for the delayed effect of superplasticizers or is used to reproduce a casting sequence. Regarding the chemical activation, the clinker dissolution is driven by the quantity of clinker present in interstitial solution followed by the precipitation of new hydrates (Taylor, 1990). This effect is modelled by the following expression for each phase “𝑖”
clinker
clinker 0 0 clinker min , mineral addition c p ps p i c p p C i W W g C i W (1-3)Where cis the degree of hydration of clinker, Cp0Clinker is the initial volumetric concentration
of clinker in the paste, Wpis the volumetric concentration of water in the paste and we define
the water content threshold Wpsas the maximum volumetric concentration of water in the paste for a water to cement ratio of 0.4. This value is derived from calibration of the proposed model on different types of clinker. When the water content exceeds this value, the water has no additional dilution effect and hence a reduction in kinetics.
When hydration advances, layers of hydration products formed around each anhydrous phase cause the difficulty of the access of free water to anhydrous grains, consequently reduce the hydration kinetics. This phenomenon can be expressed by Eq. (1-4).
Chapter I: THC simulation of early-age concrete structure 19 1 exp i n m i k r n r (1-4)
Where n is a fitting parameter which controls the shape of the hydration kinetic law, rkis also
a fitting parameter that represents the characteristic thickness of hydrate layers beyond which hydration kinetics decrease, and rmi is the current thickness of hydrate layers around anhydrous grains “𝑖”. The latter can be evaluated through Eq. (1-5) which considers the influence of porosity, water content and quantity of anhydrous grains.
hydi i anhi P m p p P C r W
C (1-5)With CPanhiis anhydrous volumetric concentration in the paste, CPhydiis the volumetric
concentration of hydrate produced from grains of phase 𝑖, p is the porosity of the paste and p
W is the volumetric concentration of water in the paste. The volumetric concentration of anhydrous phases and hydrates are determined using Eq. (1-6) and (1-7).
,0
(1
)
i i Panh i paste im
C
V
(1-6) ,0 i phyd i i i paste i m C R V
(1-7)With Vpaste,0is the initial paste volumetric concentration in concrete, R is volume ratio between i
hydrates and anhydrous phase for grains of phase 𝑖,
iis anhydrous phase density, and m is ithe initial mass of anhydrous phase 𝑖. Paste porosity is determined by Eq. (1-8).
1 i i p Panh Phyd i C C
(1-8)The effect of temperature on the hydration kinetics is modelled using the Arrhenius law as followed:
1
1
exp
i i refEa
h
R T T
(1-9)Where Ea is the activation energy of phase 𝑖, 𝑅 is the gas constant (8.314 𝐽/𝑚𝑜𝑙.𝐾) and i
Chapter I: THC simulation of early-age concrete structure
20
1. 2. 2. 2. Water mass balance equation
Two important phenomena for water content in concrete are water consumption by hydration or pozzolanic reactions and water exchanges with the environment, which are resolved via the water mass balance equation in Eq. (1-1). The hydric diffusion coefficient governing water transport depends on water content in the paste porosity, which can be modelled using an expression in Eq. proposed by (Mensi et al., 1988) with Dw0 and pare model parameters.
0exp
w w
D W D p W (1-10)
Environmental conditions such as drying due to convection or by fixed water content are considered as boundary conditions (Eq. (1-11)):
0 0 c air face w face imposed h W W n D gradW W W (1-11)Where hcis the convective exchange coefficient, Wairis the water content in the ambient air, face
W is the water content on the external face of the concrete subjected to exchange and Wimposed is the water content imposed on the external face (humid curing for instance).
1. 2. 2. 3. Heat balance equation and boundary conditions
The temperature evolution is affected by heat production from hydration and boundary conditions (imposed temperature, convection, or solar radiation). Exchanges by convection and radiation can be considered using the Eq. (1-12).
0
c r c r eq ext face n gradT H T T (1-12)Where is concrete thermal conductivity, c r is the global convection and radiation flow, Text is the ambient temperature, Tfaceis the temperature at the face of concrete, and Heqis the equivalent heat transfer coefficient defined by Eq. (1-13). The latter considers convective and radiative exchanges and heat transfer through formwork using classical thermal serial modelling (Figure 1-1). This serial model is used in a steady state as the thermal capacity of formwork material is not integrated.
1 1 f eq c r f c r rad air e H H H H H (1-13)
![Figure 2-18: Dependence of thermal properties of concrete on temperature 00.20.40.60.811.204080120160200λ /λ 0 [W/m.K]T[ C](Bary, 2012) (Eurocodes, 2004)(DTU, 1987)(Kim et al, 2003)(Vodak et al, 1997)Proposition800900100011001200050100150200 250C [J/kg.K]T [C]EC2Proposition22002240228023202360240024400100200300400500ρc[Kg/m3]T [C](Nguyen, Y.T., 2013)Proposition](https://thumb-eu.123doks.com/thumbv2/123doknet/2223187.15119/77.893.109.787.446.1083/dependence-properties-concrete-temperature-eurocodes-proposition-proposition-proposition.webp)