HAL Id: hal-01543930
https://hal.archives-ouvertes.fr/hal-01543930
Submitted on 21 Jun 2017
HAL is a multi-disciplinary open access
archive for the deposit and dissemination of
sci-entific research documents, whether they are
pub-lished or not. The documents may come from
teaching and research institutions in France or
abroad, or from public or private research centers.
L’archive ouverte pluridisciplinaire HAL, est
destinée au dépôt et à la diffusion de documents
scientifiques de niveau recherche, publiés ou non,
émanant des établissements d’enseignement et de
recherche français ou étrangers, des laboratoires
publics ou privés.
Power-Aware Regeneration Algorithm in Flex-grid
Networks
Matthieu Kanj, Esther Le Rouzic, Bernard Cousin
To cite this version:
Matthieu Kanj, Esther Le Rouzic, Bernard Cousin. Power-Aware Regeneration Algorithm in Flex-grid
Networks. 43rd European Conference on Optical Communication (ECOC 2017), Sep 2017,
Gothen-burg, Sweden. �hal-01543930�
Power-Aware Regeneration Algorithm in Flex-grid Networks
Matthieu Kanj(1), Esther Le Rouzic(2), Bernard Cousin(1)(3), (1)bcom, Network Interfaces Lab, Cesson-Sevigne, France. [email protected] (2)Orange Labs Lannion, Lannion, France. [email protected]
(3)IRISA Labs, University of Rennes 1, Rennes, France. [email protected]
Abstract Flex-grid technology increases network links capacity and optical power levels, creating power saturation problem in legacy amplifiers. We demonstrate that optimizing regeneration sites allows reducing the optical power of highly loaded links, avoiding amplifiers saturation over the existing fixed-grid networks.
Introduction
Flex-Grid is a promising technology that allows better spectral efficiency and spectrum usage in optical networks. It offers the possibility to create additional channels in the same available band-width (C band) and thus improving network ca-pacity. However, this capacity increase may not be sustainable, because of the associated in-crease in optical amplification power1. In fact, the increasing number of optical channels gives rise to a power saturation problem in legacy am-plifiers when migrating from fixed-grid to flex-grid networks2,3.
We demonstrated in2,3 that avoiding satura-tion problem is possible through adapting chan-nels optical power. This adaptation is possible by converting the OSNR margins (OSN Rmargin) into optical power attenuation over optical links1,4. However, this power saturation can always arise over highly loaded links as demonstrated in5, es-pecially when there is no sufficient exploitable OSNR margins.
In fact, the OSN Rmargin is an important pa-rameter to optimize network performance and to increase its capacity as demonstrated in many works in the literature6,7. It gives the possi-bility to optimize different transmission parame-ters, such as modulation format, optical power, baud/bit rates and coding scheme. In this work, we consider only the channel power adaptation, in order to reduce the power level over highly loaded links and avoid power saturation. The higher is the OSN Rmargin, the higher is the power attenu-ation that can be applied to an optical channel5.
In this paper, we will show how regeneration sites impact the OSNR margins of established channels. Then, we present through an exam-ple the execution result of the developed power-aware regeneration algorithm (PAR). Finally, the performance of the algorithm is evaluated.
Power-aware regeneration algorithm
Let’s assume that an optical channel must be es-tablished between a node A and a node F as shown in Figure 1. Moreover, we assume that signal regeneration is required in intermediate nodes. Therefore, depending on the goal of the applied regeneration algorithm, several regenera-tion sites can be designated accordingly.
Fig. 1: Selected regeneration sites with traditional algorithm
The goal of the PAR algorithm is to reduce the blocking due to power saturation while guarantee-ing the minimum number of regeneration sites. In fact, this goal can be achieved through max-imizing the OSN Rmargin of the candidate light-path over the segment containing the optical link having the highest power level. This link is identi-fied through its power ratio (Wl= Preal,l/Pmax,l), which is equal to the current aggregated link power (Preal,l) divided by the maximum power level (Pmax,l) allowed over the link l (as defined by the link design5).
Figure 1shows the execution result of the tra-ditional regeneration placement algorithm8(TR) for a candidate optical channel between node A and F. In this case, the regeneration sites (i.e., C and E) are computed by exploiting the maximum reach of the optical transceiver, guar-anteeing minimum number of regeneration sites (i.e., minimum cost). In this example, the high-est power attenuation is performed over the seg-ment EF, since it have the highest OSN Rmargin (OSN Rmargin,EF = 10dB).
The PAR algorithm solution will place a regen-erator in node B and D as shown in Figure 2.
This regeneration combination allows having min-imum number of regeneration sites, and a maxi-mum OSN Rmarginover the transparent segment including the critical link AB (W = 0.5).
Fig. 2: Selected regeneration sites with PAR algorithm
Therefore, if we consider the selected regener-ation sites of the Figure2, the power attenuation that can be applied over the link AB is higher than the one that can be applied with the regenera-tion sites of Figure 1 (OSN Rmargin,AC = 1 dB < OSN Rmargin,AB = 10 dB). Thus, the added optical power over the link AB is minimized after the establishment of the optical channel, which was not the case with the TR algorithm.
Functional description of PAR algorithm Algorithm 1 PAR algorithm pseudo code Input: Tab Regen[n], OSN Rl, critical link, n, M. Output: New placement of regeneration sites.
1: if (Critical link is in the last segment) (i.e. from
a downstream point of view) then
2: Exit PAR algorithm
3: else
4: i ← 0
5: while M > 0 do
6: M ← M − 1
7: Shift Upstream( T ab Regen(n − i) )
8: i ← i + 1
9: end while 10: end if
The PAR algorithm takes as an input the re-generation sites computed by the TR algorithm (Tab Regen[n]), the OSNR of every link consti-tuting the optical path (OSN Rl), the critical link, the number of regeneration sites n and a vari-able M . The critical link is identified through its power ratio calculated at the time of reception of channel connection request, and M is the number of transparent segments in the downstream direc-tion relative to the critical link (M = 2 in Figure1). The algorithm tests first if the critical link is in the last segment. If yes, there is nothing to do, since TR algorithm guarantees maximum OSN Rmargin for the last segment. If the critical link is in other segment, the algorithm will shift as much as pos-sible the regeneration sites n − i in the upstream direction (e.g., Tab Regen(2-0) = E in Figure1).
Simulation setup and scenarios
In order to evaluate the PAR algorithm, we im-proved our distributed GMPLS-based network
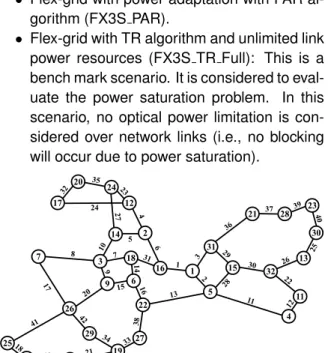
simulator5 to take into account of optical regen-eration. Simulations are performed over the Eu-ropean backbone network of Figure3, consider-ing the same link design (80 channels of 50 GHz per link over a fixed-grid network infrastructure), filtering penalties, channels types and minimum acceptable OSNR (15 dB) as in5. In order to sim-plify the analysis of results, only 100 Gbit/s optical channels (occupying 37.5 GHz each) are estab-lished in simulated scenarios. Three scenarios are considered:
• Flex-grid with power adaptation with TR algo-rithm (FX3S TR).
• Flex-grid with power adaptation with PAR al-gorithm (FX3S PAR).
• Flex-grid with TR algorithm and unlimited link power resources (FX3S TR Full): This is a bench mark scenario. It is considered to eval-uate the power saturation problem. In this scenario, no optical power limitation is con-sidered over network links (i.e., no blocking will occur due to power saturation).
Fig. 3: European backbone network with indexed links
Scenarios were simulated considering a dynamic connection establishment, where optical connec-tions are established and released automatically. Connection requests are dynamically generated following a Poisson process, where every source-destination pair of each request is randomly cho-sen among all network nodes according to a uni-form distribution. The inter-arrival and holding times for every request follow an exponential dis-tribution with averages of 1/λ, and 1/µ, respec-tively. The connection holding time 1/µ is fixed to 100 s. The offered network load is obtained by varying 1/λ.
Simulation results and discussions
We consider the blocking probability as an eval-uation criterion. It is expressed as the ratio be-tween the number of blocked lightpaths and the number of requested lightpaths. Simulation result for blocking probability is plotted as a function of the total network load defined as N × λ/µ, where
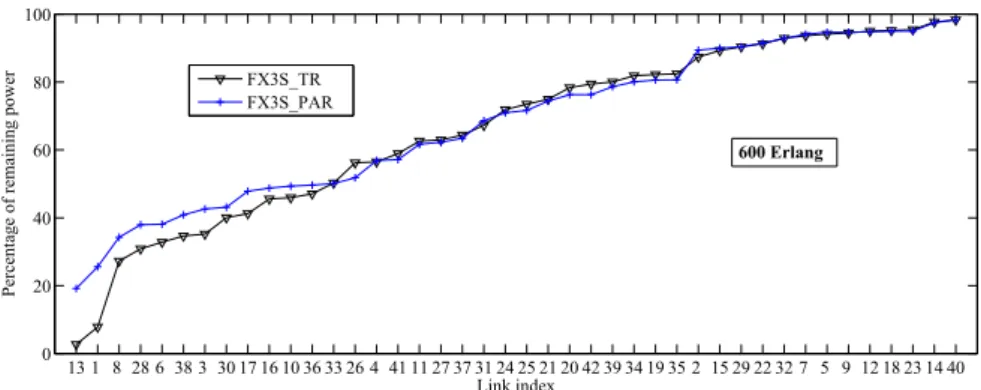
Fig. 5: Percentage of the remaining optical power per link
Fig. 4: Blocking probability versus Network load
N = 32 is the number of network nodes, and the load is expressed in Erlang. We can notice from Figure 4, that the scenario FX3S PAR us-ing the PAR algorithm have less blockus-ing in com-parison with FX3S TR scenario. This indicates first that the PAR algorithm succeeded to reduce the aggregated optical power level over the highly powered links that were causing the power sat-uration problem. Moreover, it can be seen that FX3S PAR performs the same blocking probabil-ity as FX3S TR Full scenario. This means that the power saturation problem is no longer occur-ring and thus the spectral limitation is the only rea-son of blocking.
This analysis is confirmed in Figure 5, where we plotted the remaining optical power level of network links. Figure5 shows the percentage of the remaining optical power over each link of the network before and after the use of the PAR algo-rithm. We have in black the percentage of the re-maining optical power (sorted in ascending order) for FX3S TR scenario, and in blue the percentage of the remaining optical power for the same links for FX3S PAR scenario. It can be noticed that the PAR algorithm succeeded in reducing the optical power level of the highly loaded links (i.e. the links having the lowest remaining optical power), con-sequently increasing their remaining power level (e.g., link 13 and 1). In fact, the PAR algorithm
balances the power level distribution over network links: the power level of the highly used links is reduced while the power level of lightly-used link is increased. This result demonstrates the ad-vantage of exchanging OSN Rmarginbetween the transparent segments constituting an optical path allowing OSNR margins to be transferred to the links that need it most.
Conclusions
In this paper, we have addressed the power sat-uration problem when migrating to flexible net-works. We have proposed a power-aware regen-eration algorithm that allows reducing the power level over highly loaded links and thus avoiding amplifiers saturation. Simulations revealed that adding power information in the regeneration al-gorithm of the control plane allows optimizing the power level of network links and thus exploiting more efficiently their power resources. More inter-estingly, we have shown that optimizing regener-ation sites can be an effective way to exploit more efficiently the OSNR margins of optical links in or-der to increase network capacity.
References
[1] J. L. Aug ´e., “Can we use flexible transponders to reduce margins?,” Proc. OFC, pp. 1–3, 2013.
[2] D. Amar et al., “On the legacy amplifier limitation in flexgrid optical networks,” Proc. PS, pp. 172–174 (2015). [3] M. Kanj et al., “Optical power control to efficiently handle
flex-grid spectrum gain over existing fixed-grid network in-frastructures,” Proc. ICNC, pp. 1–7, Kauai(USA), 2016. [4] Y. Pointurier., “Design of low-margin optical networks,”
IEEE/OSA JOCN., Vol.9, no. 1, pp. 9–17 (2017).
[5] M. Kanj et al., “Optical power control in GMPLS con-trol plane,” IEEE/OSA JOCN., Vol.8, no. 8, pp. 553–568
(2016).
[6] D. J. Ives et al., “Assessment of options for utilizing SNR margin to increase network data throughput,” Proc. OFC, M2I.3, pp. 1–3, Los Angeles (2015).
[7] D. J. Ives et al., “Adaptive Transceivers in Nonlinear Flexi-ble Networks,” Photon. Netw. Commun., Vol.29, no. 3, pp.
244–256 (2015).
[8] N. Sambo et al., “Accounting for Shared Regenerators in GMPLS-Controlled Translucent Optical Networks,” J. Lightwave Technol., Vol. 27, no. 19, pp. 4338–4347