Minimum Number of Assessment Times to Compare Chemical
Control Treatments for Papaya Fruit Anthracnose
José R. Liberato1, 2, Cosme D. Cruz3, Joseli S. Tatagiba4 & Laércio Zambolim1
1Departamento de Fitopatologia, Universidade Federal de Viçosa, CEP 36571-000, Viçosa, MG, Brazil; 2Current address: Department of Primary Industries and Fisheries, Plant Pathology Building, 80 Meiers Road, Indooroopilly, Brisbane, Qld
4068, Australia, e-mail: joserliberato@ig.com.br; 3Departamento de Biologia Geral, Universidade Federal de Viçosa, CEP 36571-000, Brazil; 4Incaper, Cx. Postal 62, CEP 29900-970, Linhares, ES, Brazil
(accepted for publication on 10/08/2004) Corresponding author: José R. Liberato
LIBERATO, J.R., CRUZ, C.D., TATAGIBA, J.S. & ZAMBOLIM, L. Minimum number of assessment times to compare chemical control treatments for papaya fruit anthracnose. Fitopatologia Brasileira 29:659-662 2004.
ABSTRACT
The chemical treatment evaluation in the field to control post-harvest fruit anthracnose (Colletotrichum gloeosporioides) requires a suitable disease incidence assessment on harvested papaya (Carica
papaya) fruits. The minimum number of papaya fruit harvests was
determined for valid treatment comparison in field trials for anthracnose chemical control. Repeatability analysis was done using previously published data. The coefficient determination (R2) estimate
range, using four methods, and based on means of 12 assessment times, was 92.58 ≤ R2≤ 94.45%. The number of assessment times
required for R2=90% varied from seven to nine. The R2 values of 85.1
≤ R2≤ 91.3% estimated by ANOVA suggested that any seven
successive assessment times were sufficient for treatment comparison.
Additional keywords: repeatability analysis, Carica papaya,
field control.
Número mínimo de épocas de avaliações para comparar tratamentos de controle químico da antracnose do mamoeiro
Estudos de controle químico da antracnose (Colletotrichum
gloeosporioides) em mamoeiro (Carica papaya), no campo, requerem
avaliação da intensidade da doença em frutos após a colheita. Determinou-se o número mínimo de épocas de avaliação (colheitas) necessárias para comparação adequada de tratamentos. A análise de
RESUMO
repetibilidade foi aplicada a dados previamente publicados. Estimativas usando quatro métodos resultaram em coeficientes de determinação (R2), baseados na média de 12 épocas de avaliações, de 92,58 ≤ R2≤
94,45% e o número de épocas de avaliações requerido para obter R2 =
90%, variou de sete a nove. O R2 estimado por ANOVA indicou que
quaisquer sete épocas de avaliação sucessivas foram suficientes para comparação entre tratamentos, apresentando 85,1 ≤ R2≤ 91,3%.
In Brazil, papaya (Carica papaya L.) is cultivated in about 40,800 ha (FAO, 2003) mostly with cultivar Sunrise Solo. Harvesting begins about ten months after seeding and the average productive life is about two years with yields up to three fruits per week. Post-harvest anthracnose caused by Colletotrichum gloeosporioides (Penz.) Penz. & Sacc. is the major fungal disease leading to fruit losses of up to 90% in a disease-favoring season (Tatagiba et al., 2002). During the development period of about five months (Calegario, 1997), the fungus infects immature fruit and remains quiescent until harvest maturity (Dickman & Alvarez, 1983). Anthracnose symptoms begin to appear during transport and marketing. Field spraying with fungicides during fruit formation is one of the most effective ways of controlling this disease (Liberato & Zambolim, 2002). Field trials are resource intensive; therefore, it is imperative to determine the minimum number of assessment times (fruit harvests) necessary to assess anthracnose incidence on the harvested fruit during the production period for a reliable comparison among treatments. In a system where the initial ranking of the treatments remains consistent over the successive evaluations, fewer assessments may suffice to provide reliable
data for their comparison. The consistency of treatment ranking during successive assessment times is called repeatability (Turner & Young, 1969).
According to Falconer & Mackay (1996), when disease incidence is measured repeatedly over time in each plot, the phenotypic variance (VP) can be analyzed into a variance component within plots, measuring the differences between the incidences of the same plot, and a variance component between plots, measuring the permanent differences between plots. The within-plot component (VEt) is entirely due to environment as it is caused by temporary environmental differences between successive evaluations. The inter-plot component is partly environmental (VEp) and partly genetic (VG, genotypic variance), where the environmental part is the result of circumstances permanently affecting the plot. Thus VP = VG + VEp + VEt. The partitioning of the VP, expressed by the repeatability is thus divided into two components, VEt and (VG + VEp). The repeatability coefficient is: r = (VG + VEp) / VP, which represents the correlation between repeated measurements in the same plot. It expresses the proportion of the variance of single measurements that is due to permanent, or non-localized, 659 Fitopatol. bras. 29(6), nov - dez 2004
J.R. Liberato et al
660 Fitopatol. bras. 29(6), nov - dez 2004
differences between plots, both genetic and environmental. The repeatability analysis has three main uses; one of them shows the quantitative accuracy improvement resulting from the temporal repetition of measurements. When the repeatability is high, thus low VEt, multiple measurements do not significantly improve accuracy. Contrarily, if the repeatability is low, multiple measurements can substantially increase accuracy (Falconer & Mackay, 1996).
The repeatability coefficient has been used in plant or animal breeding to determine the necessary number of assessment times to compare treatments with a certain accuracy and minimum resources (Dias & Kageyama, 1998; Silveira et al., 1998; Ferreira et al., 1999; Di Renzo et al., 2000). This study was done to determine the minimum number of successive assessments (successive harvests) required to reliably evaluate the effect of field fungicide application to control the post-harvest anthracnose of papaya fruits.
The data used in this study were obtained by Tatagiba et al. (2002), who evaluated the efficacy of field applications with 11 treatments (ten fungicides and one unsprayed control) to control papaya post-harvest anthracnose. In summary, the trial was done in a completely randomized block design with four replications of eight plants (cv. Improved Sunrise Solo Line 72/12). The fungicides were sprayed bi-weekly or monthly, from March 1997 (beginning of flowering) to March 1998. Harvest was initiated in September, by harvesting nine fruits/plot (color-break stage), at two-week intervals, to give a total of 12 assessments times (harvests). The disease incidence was evaluated ten to 12 days after harvesting on fruits stored at room temperature.
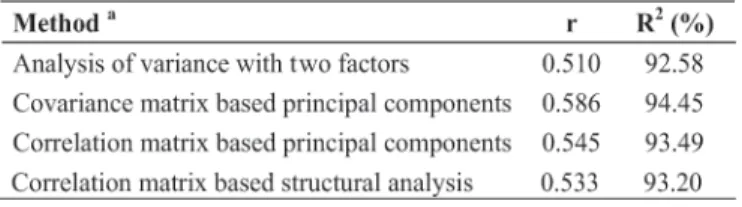
To evaluate for estimation consistency, the repeatability coefficient was estimated by four methods: ANOVA, principal components based on covariance or correlation matrix, and correlation matrix based structural analysis, as described by Mansour et al. (1981) and Cruz & Regazzi (1997), using the software packages “GENES” (Cruz, 2001; http://www.ufv.br/dbg/genes/genes.htm). The minimum number of assessment times (n0) necessary for predicting the true treatment value, based on pre-established determination coefficients (R2) was obtained according to Cruz & Regazzi (1997):
Where, r is the estimated repeatability coefficient and n is the number of successive assessment times.
Writing the equation above in terms of n, the numbers of harvests (renamed n0) needed to assess the anthracnose incidence with a specified determination value can be calculated through the following equation:
The repeatability coefficient estimates ranged from 0.51 to 0.59 (Table 1). The treatment comparison based on
the mean of 12 assessment times had an accuracy of 92.6 ≤ R2≤ 94.5 depending upon the estimation method (Table 1). Based on fruit anthracnose incidence, the minimum number of assessment times for treatment comparison varied from seven to nine for R2 = 90%, depending upon the estimation method (Table 2). After calculating the minimum number of assessment times, the sequence of successive assessment time (initial, mid or end of fruit set) was determined, by repeatability analysis of all possible sets of two to 12 successive assessments. The R2 estimated by ANOVA showed that any seven successive assessments are equally good for an accuracy of 85.1≤ R2≤ 91.3% (Figure 1). The similarity among the repeatability coefficients obtained by different analysis methods suggests consistency among estimations. High repeatability coefficients indicate low chance of significant interaction between treatments and assessment times; therefore, the real value of treatment performance can be predicted using less assessment times (harvests). There was no significant interaction between treatments and assessment times as estimated by repeated measures ANOVA (Tatagiba et al., 2002).
The R2 shows the accuracy of analysis predicting real value of treatment performance (obtained with infinite assessment times) based on n assessment times. The R2 is the square of correlation between the average of n successive assessment times and the real value of treatment performance (Cruz & Regazzi, 1997). In this study, a high accuracy level was obtained with n=12, but this number could be reduced to any successive seven to nine assessment times, without affecting accuracy of treatment comparison, thus saving labor and costs. However, when only two successive assessment times were considered, R2 ranged from 21.9 to 87.3% (Figure 1), which indicates that further reduction of assessment times can reduce the accuracy of treatment performance estimates. Since the data regarding post-harvest disease on fruits were collected from distinct harvest times (distinct fruits in each assessment time), they do not characterize a cumulative growth curve. Therefore, Tatagiba et al. (2002) did not compare treatments with the growth curve models or area under the disease progress curve (AUDPC) suggested by Campbell & Madden (1990), but instead carried out repeated-measures ANOVA (Madden, 1986; Winer et al., 1991). Nevertheless, the repeatability analysis may be useful for data
1)
-(n
r
1
r
n
R
2+
=
r
)
R
-(1
r)
-(1
R
n
2 2 0=
TABLE 1 - Repeatability coefficients (r) and determination
coefficient (R2) estimated by different methods for anthracnose
incidence on papaya (Carica papaya ) fruits sprayed with 11 fungicide treatments during 12 biweekly harvests
Minimum number of assessment times to compare chemical control...
661 Fitopatol. bras. 29(6), nov - dez 2004
that characterize a cumulative growth curve, as in foliar disease epidemics.
The pathosystem characteristics, high disease incidence during the trial period, and the fungicide sprays (treatments) some months before and during disease assessments, all appear to have contributed to the similarity of potential for treatment discrimination by all the assessment times. These factors may not occur in foliar diseases of annual crops where, the evaluations at the beginning of the epidemics can not discriminate the treatment effects, and the ranking of efficacy of systemic and protectant fungicides may not be the same at the beginning and at the end of the epidemic. In such pathosystems, it is advisable to investigate the possibility of discarding the initial evaluations for estimating the repeatability coefficient.
The repeatability analysis can be useful to determine the minimum number of assessment times, but the timing and frequency of disease assessments will be determined by the pathosystem and the objectives of the assessment (Campbell & Madden, 1990). Obviously, the set of the successive assessment times should be obtained during the
TABLE 2 - Minimum number of harvests (n0) associated with determination coefficient (R2) estimated different
methods for anthracnose incidence on papaya (Carica papaya) fruits sprayed with 11 fungicide treatments during 12 biweekly harvests
a Mansour et al. (1981) and Cruz & Regazzi (1997).
Number of assessment times
FIG. 1 - Determination coefficient (R2) related to number of
successive harvests of papaya (Carica papaya) fruits for evaluation of anthracnose incidence, estimated by analysis of variance with two factors (Mansour et al., 1981; Cruz & Regazzi, 1997).
R
2 (%)
disease favorable period (when the disease intensity is high in control plots). In this study, the weather conditions affected treatment efficacy but not their ranking over time (Tatagiba et al., 2002).
The repeatability coefficient may differ under other environmental or experimental conditions, but the concept itself is useful to estimate an adequate number of assessment times for papaya fruit anthracnose. Repeatability analysis after each assessment time may also indicate the final disease assessment when R2 reaches a pre-established value.
LITERATURE CITED
CALEGARIO, F.F. Características físicas e químicas do fruto de mamão (Carica papaya L.) em desenvolvimento. (Tese de Mestrado). Viçosa. Universidade Federal de Viçosa, 1997. CAMPBELL, C.L. & MADDEN, L.V. Introduction to Plant Disease Epidemiology. New York. John Wiley. 1990.
CRUZ, C.D. & REGAZZI, A.J. Modelos biométricos aplicados ao melhoramento genético. 2 ed. Viçosa. Universidade Federal de Viçosa. 1997.
CRUZ, C.D. Programa genes: versão windows; Aplicativo computacional em genética e estatística. Viçosa. Universidade Federal de Viçosa. 2001.
DI RENZO, M.A., IBAÑEZ, M.A., BONAMICO, N.C. & POVERENE, M.M. Estimation of repeatability and phenotypic correlations in Eragrostis curvula. Journal of Agricultural Science 134:207-212. 2000.
DIAS, L.A.S. & KAGEYAMA, P.Y. Repeatability and minimum harvest period of cacao (Theobroma cacao L.) in Southern Bahia. Euphytica 102:29-35. 1998.
DICKMAN, M.B. & ALVAREZ, A.M. Latent infection of papaya caused by Colletotrichum gloeosporioides. Plant Disease 67:748-750. 1983.
FALCONER, D.S. & MACKAY, T.F.C. Introduction to quantitative genetics. 4th ed. London. Longman. 1996.
FA0. A folder on the Internet (last updated: 09 January 2003, url: http://apps.fao.org)
FERREIRA, R.P., BOTREL, M.A., PEREIRA, A.V. & CRUZ, C.D. Avaliação de cultivares de alfafa e estimativas de repetibilidade de caracteres forrageiros. Pesquisa Agropecuária Brasileira 34:995-1002. 1999.
J.R. Liberato et al
662 Fitopatol. bras. 29(6), nov - dez 2004
por fungos, bacterias e fitonematóides em mamoeiro. In: Zambolim, L., Vale, F.X.R., Monteiro, A.J.A. & Costa H (Eds.) Controle de doenças de plantas fruteiras. v.2. Viçosa. Universidade Federal de Viçosa. 2002. pp.1023-1169.
MADDEN, L.V. (1986) Statistical analysis and comparison of disease progress curves. In: Leonard, K.J. & Fry, W.E. (Eds) Plant disease epidemiology. v.1. New York. Macmillan Publishing. pp.55-84. MANSOUR, H., NORDHEIM, E.V. & RUTLEDGE, J.J. Estimations of repeatability. Theoretical Applied Genetic 60:151-156. 1981.
SILVEIRA, R.D., LANA, J.T.O., CAMPOS, L. & CRUZ, C.D.
Determinação do intervalo entre medições para avaliação de colônias de Apis mellifera. Revista Ceres 45:161-169. 1998.
TATAGIBA, J.S., LIBERATO, J.R., ZAMBOLIM, L., VENTURA, J.A. & COSTA, H. Controle e condições climáticas favoráveis à antracnose (Colletotrichum gloeosporioides) do mamoeiro. Fitopatologia Brasileira 27:186-192. 2002.
TURNER, H.N. & YOUNG, S.S.Y. Quantitative genetics in sheep breeding. Ithaca. Cornell University Press. 1969.
WINER, B.J., BROWN, D.R. & MICHELS, K.M. Statistical principles in experimental design. 3rd ed. New York. McGraw-Hill.
1991.