Université de Montréal
The potential utility of age, triage score, and
disposition data contained in emergency
department electronic records for influenza-like
illness surveillance in Montreal
par Noémie Savard
Département de médecine sociale et préventive Faculté de médecine
Mémoire présenté à la Faculté de médecine
en vue de l’obtention du grade de Maître ès sciences (M.Sc.) en santé communautaire
Mars 2013
Université de Montréal
Faculté des études supérieures et postdoctorales
Ce mémoire intitulé :
The potential utility of age, triage score, and disposition data contained in emergency department electronic records for influenza-like illness surveillance in
Montreal
Présenté par : Noémie Savard
a été évalué par un jury composé des personnes suivantes :
Julio C. Soto, président-rapporteur David Buckeridge, directeur de recherche
Robert Allard, co-directeur Lucie Bédard, co-directrice Clément Dassa, membre du jury
Résumé
La surveillance de l’influenza s’appuie sur un large spectre de données, dont les données de surveillance syndromique provenant des salles d’urgences. De plus en plus de variables sont enregistrées dans les dossiers électroniques des urgences et mises à la disposition des équipes de surveillance. L’objectif principal de ce mémoire est d’évaluer l’utilité potentielle de l’âge, de la catégorie de triage et de l’orientation au départ de l’urgence pour améliorer la surveillance de la morbidité liée aux cas sévères d’influenza. Les données d’un sous-ensemble des hôpitaux de Montréal ont été utilisées, d’avril 2006 à janvier 2011. Les
hospitalisations avec diagnostic de pneumonie ou influenza ont été utilisées comme mesure de la morbidité liée aux cas sévères d’influenza, et ont été modélisées par régression binomiale négative, en tenant compte des tendances séculaires et saisonnières. En comparaison avec les visites avec syndrome d’allure grippale (SAG) totales, les visites avec SAG stratifiées par âge, par catégorie de triage et par orientation de départ ont amélioré le modèle prédictif des
hospitalisations avec pneumonie ou influenza. Avant d’intégrer ces variables dans le système de surveillance de Montréal, des étapes additionnelles sont suggérées, incluant l’optimisation de la définition du syndrome d’allure grippale à utiliser, la confirmation de la valeur de ces prédicteurs avec de nouvelles données et
l’évaluation de leur utilité pratique.
Mots-clés : Dossiers électroniques; Influenza; Santé publique; Surveillance; Surveillance syndromique; Syndrome d’allure grippale; Urgence; Vigie sanitaire
ii
Abstract
Surveillance of influenza relies on a wide array of data, including
emergency department based syndromic surveillance data. An increasing number of variables are recorded in emergency department electronic records and are available for surveillance. The main objective of this research is to evaluate the potential utility of age, triage scores, and disposition data for enhanced monitoring of the burden of severe influenza cases. Data from a subset of Montreal hospitals was used, from April 2006 to January 2011. Pneumonia and influenza
hospitalizations were taken as a measure of the burden of severe influenza cases, and were modeled using a negative binomial regression approach, taking into account seasonal and secular trends. Age-, triage score-, and disposition-stratified influenza-like illness visits improved the fit of predictive models for pneumonia and influenza hospitalization, as compared to overall influenza-like illness visits. Before integration of these variables into the Montreal surveillance system, additional steps are suggested, including the optimization of an influenza-like illness syndrome definition, the confirmation of the value of these predictors using new data, and the evaluation of their practical utility.
Keywords : Emergency department; Electronic records; Influenza; Influenza-like illness; Public health; Surveillance; Surveillance, syndromic
iii
Table of contents
List of tables ... v
List of figures ... vii
List of abbreviations ... ix
Acknowledgements / Remerciements ... xiii
Chapter 1: Introduction ... 1
1.1. Context ... 1
1.2. General objective ... 4
Chapter 2: Review of literature ... 7
2.1. ILI syndrome definition ... 7
2.2. Influenza-related hospitalizations and mortality – An overview ... 17
2.3. Relationship between ILI emergency department visits and influenza-related hospitalizations and mortality ... 19
2.4. Methodological considerations ... 28
2.5. Gaps in knowledge and specific objective ... 31
Chapter 3: Methodology ... 33
3.1. Study setting ... 33
3.2. ED ILI-visits: choice of syndrome definitions ... 36
3.3. Value of age, triage score, and disposition data for predicting influenza-related hospitalizations ... 40
Chapter 4: The potential utility of age, triage score, and disposition data to improve emergency department-based surveillance of influenza-like illness in Montréal, Canada: a time series analysis from 2006 to 2011 ... 45
4.1. Abstract ... 47 4.2. Background ... 48 4.3. Methods ... 49 4.4. Results ... 52 4.5. Discussion ... 60 4.6. Conclusion ... 63 4.7. References ... 65
iv
4.8. Supplementary material ... 69
Chapter 5: Additional results ... 77
5.1. Descriptive statistics: number of ED visits and use of the electronic system… ... 77
5.2. Descriptive statistics: ILI visits ... 79
5.3. Correlations ... 83
Chapter 6: Discussion ... 85
6.1. Results, implications, and limits ... 85
6.2. System limitations ... 86
6.3. Recommendations ... 88
Chapter 7: Conclusion ... 91
References ... 93
v
List of tables
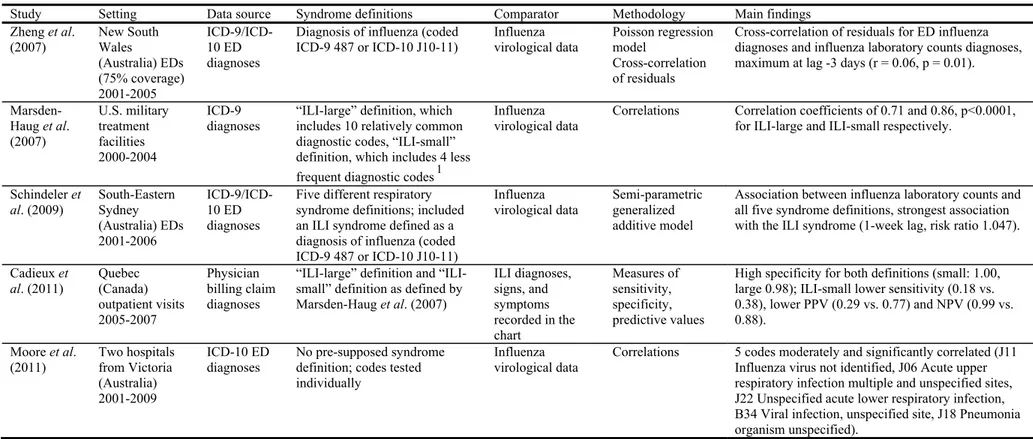
Table 2-I. Studies evaluating ILI syndrome definitions based on ED diagnoses
... 10
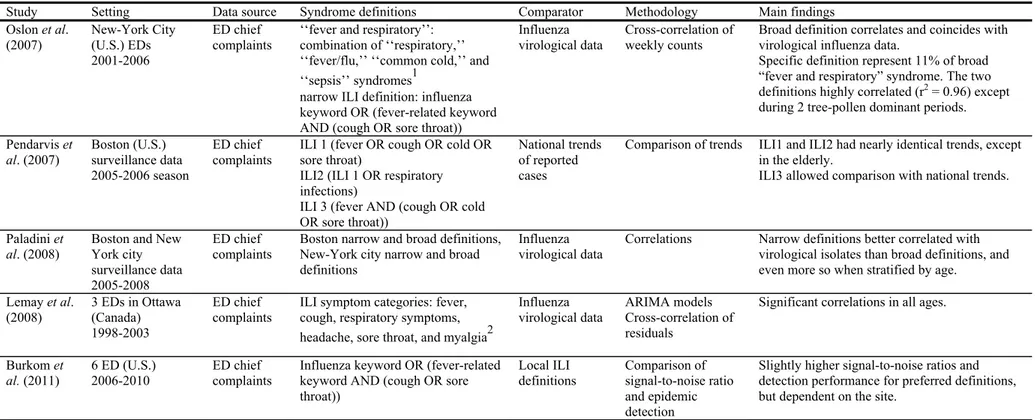
Table 2-II. Studies evaluating ILI syndrome definitions based on ED chief complaints ... 11
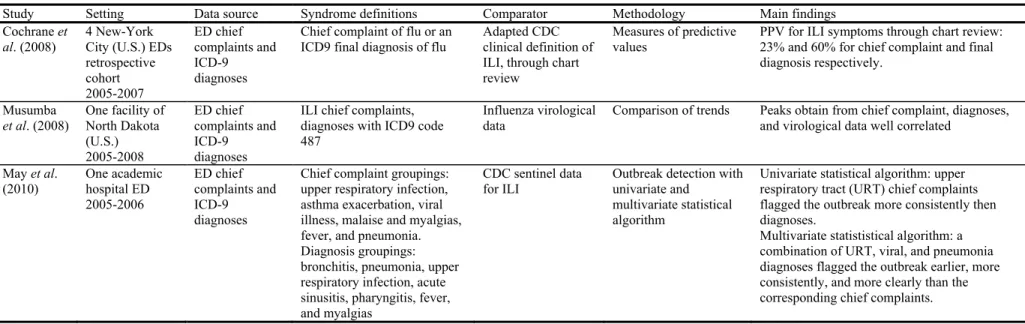
Table 2-III. Studies evaluating ILI syndrome definitions based on ED diagnoses and chief complaints ... 12
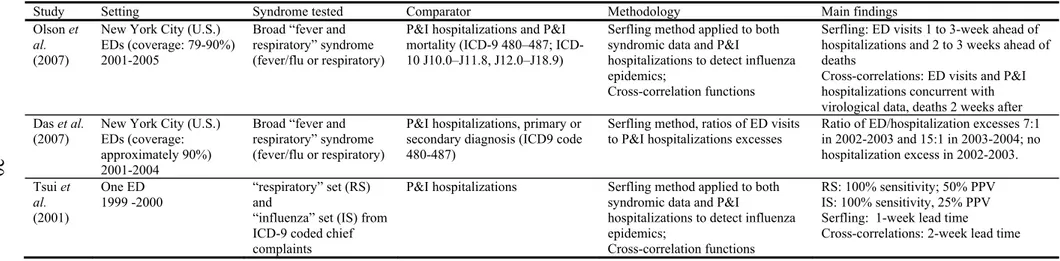
Table 2-IV. Studies evaluating the association between overall ILI ED visits and influenza-related hospitalizations and mortality ... 20
Table 2-V. Studies evaluating the association between age-stratified ILI ED visits and influenza-related hospitalizations and mortality ... 21
Table 2-VI. Studies evaluating the use of ED disposition data for ILI/respiratory syndrome surveillance ... 22
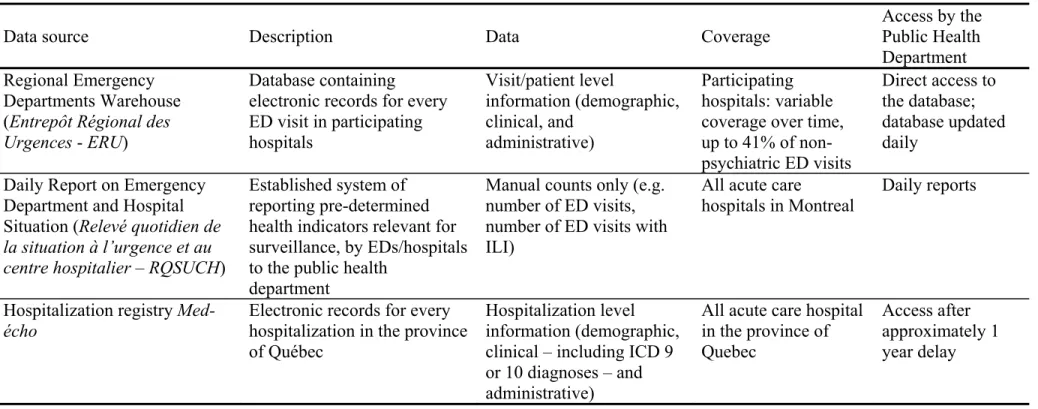
Table 3-I. Comparison of data sources ... 34
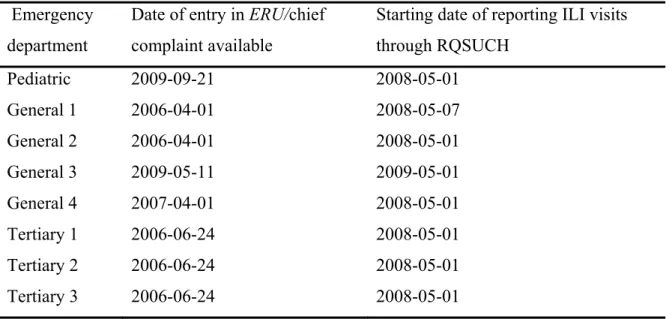
Table 3-II. Date of entry into ERU and RQSUCH systems, per ED ... 35
Table 3-III. Keywords for ILI syndrome definitions ... 38
Table 4-I. Mean number of weekly influenza-like illness emergency department visits according to visit characteristics, hospitals participating to ERU, June 25, 2006 to January 29, 2011 ... 53
Table 4-II. IRR of overall P&I hospitalizations, for each SD increase in ILI visits, hospitals participating to ERU, June 25, 2006 to January 29, 2011 ... 57
Table 4-III. Mean number of weekly influenza-like illness – sensitive definition - emergency department visits, according to visit characteristics, hospitals participating to ERU, June 25, 2006 to January 29, 2011 ... 71
Table 4-IV. IRR of overall P&I hospitalizations, for each unit increase in ILI visits (specific definition), hospitals participating to ERU, June 25, 2006 to January 29, 2011 ... 72
vi
Table 4-V. IRR of overall P&I hospitalizations, for each unit increase in ILI visits (sensitive definition), hospitals participating to ERU, June 25, 2006 to January 29, 2011 ... 73 Table 4-VI. IRR of overall P&I hospitalizations, for each SD increase in ILI-Se visits, hospitals participating to ERU, June 25, 2006 to January 29, 2011 ... 74 Table 4-VII. Akaike’s information criterion (AIC) of predictive models for
pneumonia and influenza hospitalizations, hospitals participating to ERU, June 25, 2006 to January 29, 2011 ... 75 Table 5-I. Number of emergency department (ED) visits, proportion with
chief complaint, and number of chief complaint per visit in ERU, from date of entry to November 14, 2011 ... 78 Table A1-I. Number of emergency department (ED) visits: daily mean per
period of analysis, ERU ... i Table A1-II. Proportion of emergency department (ED) visits with chief
complaints recorded: daily mean per period of analysis, ERU ... ii Table A1-III. Mean number of chief complaint codes per emergency
department (ED) visits, per period of analysis ... iii Table A1-IV. Number of emergency department (ED) visits obtained from
ERU and RQSUCH: daily mean, percent agreement, and outliers ... iv Table A1-V. Proportion of emergency department (ED) visits with ILI-Sp:
daily mean per period of analysis, ERU ... v Table A1-VI. Proportion of emergency department (ED) visits with ILI-Se:
daily mean per period of analysis, ERU ... v Table A1-VII. Proportion of emergency department (ED) visits with ILI-R:
daily mean per period of analysis, RQSUCH ... vi Table A1-VIII. Proportion of emergency department (ED) visits with
influenza-like illness (ILI), according to data source and syndrome definition ... vi
vii
List of figures
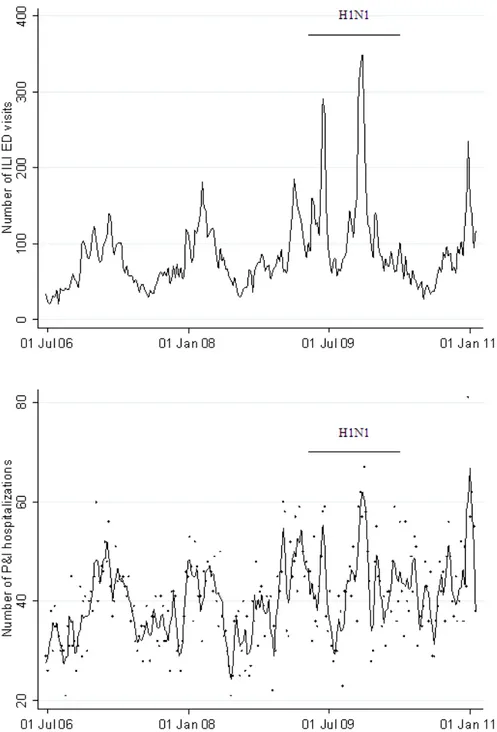
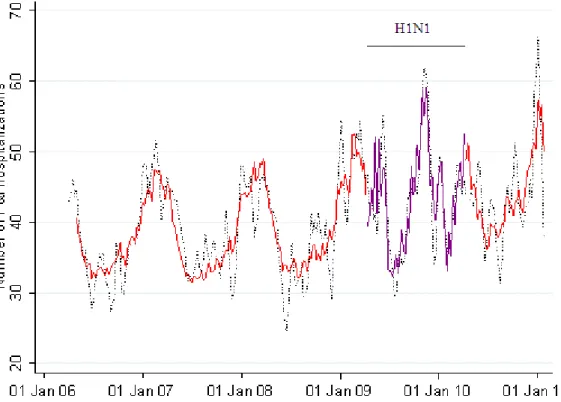
Figure 4-1: Weekly emergency department (ED) visits with influenza-like illness (ILI) and pneumonia and influenza (P&I) hospitalizations, hospitals participating to ERU, June 25, 2006 to January 29, 2011 ... 54 Figure 4-2. Baseline model of weekly pneumonia and influenza (P&I)
hospitalizations, hospitals participating to ERU, June 25, 2006 to January 29, 2011 ... 56 Figure 4-3. Akaike’s information criterion (AIC) of predictive models for
pneumonia and influenza hospitalizations, hospitals participating to ERU, June 25, 2006 to January 29, 2011 ... 59 Figure 4-4. Weekly emergency department (ED) visits with influenza-like
illness (ILI), hospitals participating to ERU, June 25, 2006 to January 29, 2011 ... 69 Figure 4-5. Akaike’s information criterion (AIC) of predictive models for
pneumonia and influenza hospitalizations, using ILI-Se visits, hospitals participating to ERU, June 25, 2006 to January 29, 2011 ... 70 Figure 5-1. Proportion of emergency department (ED) visits with influenza-like illness (ILI), according to emergency department, data source, and syndrome definition ... 80 Figure 5-2. Lowess-smoothed time series of daily proportion of emergency
department (ED) visits with influenza-like illness (ILI), total and selected EDs, 2006 to 2011 ... 82 Figure 5-3. Correlation between ERU-derived syndrome components and
RQSUCH-obtained influenza-like illness (ILI) counts ... 84 Figure A1-1. Average daily number of emergency department (ED) visits,
viii
Figure A1-2. Proportion of emergency department (ED) visits with chief complaint recorded: daily mean stratified per year and ED, 2006 to 2011 ... ii Figure A1-3. Mean number of chief complaint codes per emergency
department (ED) visits, stratified per year and ED ... iii Figure A1-4. Smoothed time series of daily proportion of emergency
ix
List of abbreviations
ARIMA Autoregressive integrated moving average CDC Center for Disease Control and Prevention
CI Confidence interval
CTAS Canadian Triage Acuity Score
Distribute Distributed Surveillance Taskforce for Real-time Influenza Burden Tracking and Evaluation
DSP Direction de santé publique (Public Health Department)
ED Emergency department
ERU Entrepôt régional des urgence (Regional Emergency Department Warehouse)
ESSENCE Electronic Surveillance System for the Early Notification of Community-based Epidemics
GLM Generalized linear model
ICD International Classification of Diseases
ILI Influenza-like illness
ILI-R Influenza-like illness as reported in RQSUCH ILI-Se Sensitive definition of influenza-like illness ILI-Sp Specific definition of influenza-like illness NPV Negative predictive value
NYC New York City
P&I Pneumonia and influenza PPV Positive predictive value
RQSUCH Relevé quotidien de la situation à l’urgence au centre hospitalier (Daily Report on Emergency Department and Hospital Situation)
SD Standard deviation
URT Upper respiratory tract U.S. United-States
xi
xii
xiii
Acknowledgements / Remerciements
J’aimerais remercier mes directeurs David Buckeridge, Robert Allard et Lucie Bédard, pour leur aide constante et leurs judicieux conseils.
I would also like to thank the whole McGill Surveillance Lab team, for their regular comments and suggestions. Special thanks to Aman Verma for his much appreciated help with SQL.
J’aimerais finalement remercier André Bilodeau, de l’équipe Surveillance épidémiologique et vigie de la Direction de santé publique de Montréal, pour son aide précieuse avec les banques de données.
Chapter 1: Introduction
1.1.
Context
1.1.1. Influenza syndromic surveillance
Influenza remains a disease of public health importance, because of its annual morbidity and mortality and its pandemic potential (Nicholson et al. 2003). The World Health Organization (WHO) considers influenza surveillance important for ensuring rapid detection of epidemics, characterizing circulating virus, guiding vaccine development, planning appropriate public health control measures, and evaluating the burden of disease and associated costs (World Health Organization 2006).
Influenza surveillance systems exist at multiple levels, from international to local, to address a range of objectives, from informing vaccine production to guiding local outbreak response (Brammer et al. 2009). The sources of data for surveillance vary from system to system, but often multiple sources are used within a system. These sources are sometimes understood as being either traditional or syndromic.
Syndromic surveillance generally differs from traditional surveillance in terms of specificity, frequency of data collection and analysis, timeliness, and objectives (Shmueli and Burkom 2010; Tsui et al. 2008). Whereas traditional surveillance uses data such as laboratory confirmed influenza diagnoses, cases of influenza-like illness (ILI) reported by sentinel physicians, and cause-specific mortality, syndromic surveillance data are prediagnostic and nonspecific, describing symptoms or care-seeking behaviors. Syndromic surveillance data sources include emergency department chief complaints, outpatient clinic visits, medication sales, and school/work absenteeism (Fricker 2011; Shmueli and Burkom 2010). These data are usually collected daily, as opposed to weekly or more infrequently for traditional surveillance. Finally, syndromic data tend to be
2
timelier than traditional data, with respect to disease event occurrence, consistent with the objective of providing early event detection (Tsui et al. 2008).
In recent years, the surveillance community has recognized another objective for syndromic surveillance, namely, situation (or “situational”) awareness; however, this concept is poorly and not consistently defined
(Buckeridge 2011). One definition is the activity of “monitoring disease trends or other markers of community health in situations where there is a need for prompt information” (Buehler et al. 2008). Specific objectives may include assessing the absence or limited size of unusual disease events, assessing and monitoring disease burden, detecting virulence shifts, tracking known events, and anticipating
demands and planning for health care services (Buehler et al. 2009; Burkom 2011; Hanni 2011; van den Wijngaard et al. 2011). In any case, whether for early event detection or situational awareness, the focus of syndromic surveillance is typically on achieving near “real-time” surveillance (Buehler et al. 2008).
Syndromic surveillance of influenza – in particular using emergency department (ED)-based data – can provide information that is timelier than laboratory data (Buehler et al. 2009; Dailey et al. 2007; Schindeler et al. 2009; Zheng et al. 2007). It can potentially represent a greater number of encounters than traditional surveillance data, and provide additional details relative to time, age, and geographical trends (Buehler et al. 2009). Monitoring influenza is considered by some public health practitioners to be one of the greatest utilities of syndromic surveillance (Buehler et al. 2008).
1.1.2. Surveillance of severe cases
Monitoring severe events due to influenza, such as influenza-related hospitalizations or influenza-related mortality, is an important aspect of situation awareness during an influenza epidemic. However, hospitalization and mortality data may not be available to public health departments in a timely manner for prospective surveillance purposes; hence the motivation to find other data sources reflective of the burden of severe influenza cases.
3
In contrast to hospitalization and mortality data, records of emergency department (ED) visits are available in many public health settings through existing syndromic surveillance systems. Many public health agencies monitor these ED visits for influenza-like-illness (ILI), but due to variations in care seeking behavior and other factors, ED visits do not necessarily represent severe disease. Existing syndromic surveillance systems that use ED visit data are therefore limited in their ability to monitor severe cases of influenza.
However, the severity of illness for patients presenting to EDs is
increasingly captured in electronic information systems. For example, indicators such as standardized triage scores and disposition information could be used to enhance surveillance of the burden of severe influenza disease. In addition, a wide array of patient or encounter characteristics may be captured in electronic records. Among these, age has been used to identify subgroups whose ILI visits correlate with later counts of hospitalizations or mortality. (Brownstein et al. 2005; Chan et al. 2011; Olson et al. 2007; Sebastian et al. 2008). Thus, in addition to markers of severity such as triage score and disposition, demographic information such as age may contribute to monitoring and potentially predicting the burden of severe influenza cases.
1.1.3. Montreal Context
The Montreal Public Health Department (Direction de santé publique de Montréal, DSP) is responsible for a population of 1.85 million . It conducts routine influenza surveillance using multiple sources of data, both traditional and
syndromic.
The syndromic component includes ED-based data. The DSP currently receives daily counts of ILI visits from all EDs in its jurisdiction, through the Daily Report on Emergency Department and Hospital Situation (Relevé quotidien de la situation à l’urgence et au centre hospitalier – RQSUCH). These data are created by daily manual entry, in each hospital, of the number of patients
4
registering to the ED with influenza-like illness symptoms, and are transmitted to the DSP, where they are analyzed daily.
The DSP also has access to detailed ED data for a subset of the Montreal hospitals, via the Regional Emergency Departments Warehouse (Entrepôt Régional des Urgences - ERU). These data are extracted routinely from triage information systems in each ED and loaded into a data warehouse at each institution before being transferred at least daily to the regional data warehouse. Records from this source contain data on each ED visit in participating hospitals, including chief complaint, ED diagnosis, age, sex, triage category, and disposition information. This data source is not currently used for surveillance in Montreal. Counts of ILI visits may be derived from either the chief complaint or the diagnosis. The DSP is considering adopting this source in place of the RQSUCH data for many reasons, including automated reporting and analysis of visits by factors such as age, severity of illness, and patient geography.
1.2.
General objective
A principal interest in adopting the ERU source for surveillance lies in the variables that are available for analyses, such as age, triage score, and disposition information. However, the value of these variables, except for age, has been
subjected to very little assessment in the literature. The main objective of this work is therefore to evaluate the potential utility of age, triage scores, and
disposition data for enhanced monitoring and prediction of the burden of severe influenza cases in Montreal, using the ERU database as a source of ILI ED visit counts.
1.2.1. Usefulness
This study will help identify variables that may be useful for enhancing influenza surveillance in Montreal and elsewhere. Judiciously choosing data sources and variables to be used in a surveillance system is important, considering
5
that the information available is constantly growing, but that resources for analysis are limited. In this respect, even negative results – that age or severity markers contained in ERU do not appear associated with influenza-related hospitalization – will be useful, in that they will influence decisions regarding what data to include when building a surveillance system using this data source.
Monitoring severe illness, in addition to the burden of symptomatic, less severe illness, is warranted, especially in a context of limited resources. Not all seasonal epidemics have the same severity or affect the same group of individuals, in terms of hospitalization and mortality rates (Thompson et al. 2006). Timely identification of the most severe ones may influence the timing and intensity of public health measures, such as vaccination promotion and communications with clinicians for enhanced awareness of influenza circulation, and may contribute to the planning of heath care resources.
A timely indication of the burden of severe illness may be particularly warranted during an influenza pandemic. During a pandemic period, care-seeking behavior may change, in part due to messages relayed by the media, and it is possible that more individuals with benign symptoms present to the ED. It would therefore be of interest to distinguish those with a more severe presentation, which are more likely to reflect the burden of severe disease in the population. Timely knowledge of the severity of a pandemic may guide decisions regarding the need to implement measures beyond those used for seasonal influenza, for example the opening of influenza clinics. On the other hand, the absence or limited number of severe cases may be used for public reassurance.
Chapter 2: Review of literature
This review of the literature contains four sections: 1) a review ILI
syndrome definitions that were developed or tested, in order to orient the choice of a definition for this work; 2) a short overview of the use and methods of
measurement of influenza-related hospitalizations and mortality, to inform the choice of an indicator of severe influenza burden for this study; 3) a review of studies reporting the relationship between ED-based influenza syndromic
surveillance data and influenza-related hospitalizations and deaths – with a section on studies evaluating the use age, triage scores, and disposition as indicators of interest; and 4) methodological considerations for modeling time-series.
2.1.
ILI syndrome definition
2.1.1. Overview
Based on emergency department chief complaints and discharge diagnoses, various syndrome definitions have been suggested for influenza – as illustrated in Tables 2-I to 2-III. When the data are coded, ILI definitions typically consist of a list of codes, such as ICD-9 or ICD-10 codes. When the data are in free-text form, the syndrome definition can consist of a list of findings (typically signs and symptoms), with or without combination rules; a free-text classifier is then required to apply the definition, taking into account synonyms, acronyms, abbreviations and misspellings (Chapman et al. 2010; Dara et al. 2008). In addition, statistical classifiers can be developed from a labeled training set (Olszewski 2003).
There are also various clinical definitions used for sentinel surveillance of ILI, consisting of clinical symptoms, signs, or history elements that a patient must have in order to meet the definition. Although not identical, they tend to be similar
8
among surveillance systems (Thursky et al. 2003). For instance, the Center
for Disease Control and Prevention (CDC) definition for ILI is fever ≥37.8°C with cough or sore throat, in the absence of known cause other than influenza (Center for Disease Control and Prevention 2011). In Canada, it is defined as acute
respiratory illness with fever and cough and one or more of sore throat, arthralgia, myalgia, or prostration, which is likely due to influenza (Public Health Agency of Canada 2012).
Here, we distinguish between “clinical case definition”, where a health care professional directly assessing a patient applies the case definition – such as general practioners participating in sentinel surveillance – from “syndromic case definition”, applied to data already taken out of the clinical context – such as ED chief complaints and diagnoses. This is mainly for clarity’s sake: although the terms “clinical case definition” (Boivin et al. 2000; Carrat et al. 1999) and
“syndrome definition” (Cadieux et al. 2011; Chapman et al. 2010) have been used, we have not found this distinction made explicitly in the literature.
In this review, we include studies testing syndrome definitions based on electronically recorded 1) diagnoses, 2) chief complaints, or 3) both, in an outpatient setting – either community-based physician visit or ED visit. The studies included validate one (or more) syndrome definition(s) against a clinical ILI case definition or influenza laboratory test results as a gold standard, or compare definitions according to other criteria such as detection of influenza season. The studies included are summarized in Tables 2-I to 2-III. Most of these validation studies are ecological, comparing time series of ILI ED visits against time series of positive influenza tests (or another influenza-related event), thus precluding conclusions regarding the validity of the syndrome definition at the case level. Associations observed in time series studies may be due to the seasonal or secular variation of measured or unmeasured ecological confounders. Were the association with these confounders to change, the validity of the ILI syndrome may be affected. Record-level studies, on the other hand, allow for individual-level assessment of a syndrome definition’s validity. However, a valid definition at the
9
individual level may not directly translate into the most sensitive or specific definition at the population level, and may not provide for the most timely monitoring of influenza activity.
Table 2-I. Studies evaluating ILI syndrome definitions based on ED diagnoses
1 ILI-large: 079.99 viral infection NOS, 382.9 otitis media NOS, 460 nasopharyngitis, acute, 461.9 acute sinusitis, unspecified, 465.9 infectious upper respiratory, multiple sites, acute
NOS, 466.0 bronchitis, acute, 486 pneumonia, organism NOS, 490 bronchitis NOS, 780.6 fever, 786.2 cough
ILI-small: 465.0 laryngopharyngistis, acute, 487.0 influenza with pneumonia, 487.1 influenza with respiratory manifestations NEC, 487.8 influenza with manifestation NEC Study Setting Data source Syndrome definitions Comparator Methodology Main findings
Zheng et al.
(2007) New South Wales (Australia) EDs (75% coverage) 2001-2005 ICD-9/ICD-10 ED diagnoses
Diagnosis of influenza (coded
ICD-9 487 or ICD-10 J10-11) Influenza virological data Poisson regression model Cross-correlation of residuals
Cross-correlation of residuals for ED influenza diagnoses and influenza laboratory counts diagnoses, maximum at lag -3 days (r = 0.06, p = 0.01). Marsden-Haug et al. (2007) U.S. military treatment facilities 2000-2004 ICD-9
diagnoses “ILI-large” definition, which includes 10 relatively common diagnostic codes, “ILI-small” definition, which includes 4 less frequent diagnostic codes1
Influenza
virological data Correlations Correlation coefficients of 0.71 and 0.86, p<0.0001, for ILI-large and ILI-small respectively. Schindeler et
al. (2009) South-Eastern Sydney (Australia) EDs 2001-2006
ICD-9/ICD-10 ED diagnoses
Five different respiratory syndrome definitions; included an ILI syndrome defined as a diagnosis of influenza (coded ICD-9 487 or ICD-10 J10-11)
Influenza
virological data Semi-parametric generalized additive model
Association between influenza laboratory counts and all five syndrome definitions, strongest association with the ILI syndrome (1-week lag, risk ratio 1.047). Cadieux et al. (2011) Quebec (Canada) outpatient visits 2005-2007 Physician billing claim diagnoses
large” definition and “ILI-small” definition as defined by Marsden-Haug et al. (2007) ILI diagnoses, signs, and symptoms recorded in the chart Measures of sensitivity, specificity, predictive values
High specificity for both definitions (small: 1.00, large 0.98); ILI-small lower sensitivity (0.18 vs. 0.38), lower PPV (0.29 vs. 0.77) and NPV (0.99 vs. 0.88). Moore et al. (2011) Two hospitals from Victoria (Australia) 2001-2009 ICD-10 ED diagnoses No pre-supposed syndrome definition; codes tested individually
Influenza virological data
Correlations 5 codes moderately and significantly correlated (J11 Influenza virus not identified, J06 Acute upper respiratory infection multiple and unspecified sites, J22 Unspecified acute lower respiratory infection, B34 Viral infection, unspecified site, J18 Pneumonia organism unspecified).
Table 2-II. Studies evaluating ILI syndrome definitions based on ED chief complaints
Study Setting Data source Syndrome definitions Comparator Methodology Main findings Oslon et al.
(2007) New-York City (U.S.) EDs 2001-2006
ED chief
complaints ‘‘fever and respiratory’’: combination of ‘‘respiratory,’’ ‘‘fever/flu,’’ ‘‘common cold,’’ and ‘‘sepsis’’ syndromes1
narrow ILI definition: influenza keyword OR (fever-related keyword AND (cough OR sore throat))
Influenza
virological data Cross-correlation of weekly counts Broad definition correlates and coincides with virological influenza data. Specific definition represent 11% of broad “fever and respiratory” syndrome. The two definitions highly correlated (r2 = 0.96) except
during 2 tree-pollen dominant periods. Pendarvis et
al. (2007) Boston (U.S.) surveillance data 2005-2006 season
ED chief
complaints ILI 1 (fever OR cough OR cold OR sore throat) ILI2 (ILI 1 OR respiratory infections)
ILI 3 (fever AND (cough OR cold OR sore throat))
National trends of reported cases
Comparison of trends ILI1 and ILI2 had nearly identical trends, except in the elderly.
ILI3 allowed comparison with national trends. Paladini et
al. (2008) Boston and New York city surveillance data 2005-2008
ED chief
complaints Boston narrow and broad definitions, New-York city narrow and broad definitions
Influenza
virological data Correlations Narrow definitions better correlated with virological isolates than broad definitions, and even more so when stratified by age.
Lemay et al. (2008) 3 EDs in Ottawa (Canada) 1998-2003 ED chief complaints
ILI symptom categories: fever, cough, respiratory symptoms, headache, sore throat, and myalgia2
Influenza virological data
ARIMA models Cross-correlation of residuals
Significant correlations in all ages. Burkom et al. (2011) 6 ED (U.S.) 2006-2010 ED chief complaints
Influenza keyword OR (fever-related keyword AND (cough OR sore throat)) Local ILI definitions Comparison of signal-to-noise ratio and epidemic detection
Slightly higher signal-to-noise ratios and detection performance for preferred definitions, but dependent on the site.
1 ‘‘sepsis’’: sepsis, bacteremia, cardiac arrest, unresponsive, unconscious, or dead on arrival, ‘‘common cold’’: stuffy nose or nasal or cold symptoms, ‘‘respiratory’’: pneumonia, shortness
of breath, bronchitis, upper respiratory tract infection, difficulty breathing, pleurisy, croup, cough, dyspnea, and chest cold, ‘‘fever/flu’’: fever, chills, malaise, body aches, viral syndrome, and influenza, excluding acute gastroenteritis, enteritis, or diarrhea.
2 Fever: febrile, fever, temperature, hot, shiver, feeling hot, elevated temperature, high temperature, chills, shakes, rigors; cough: cough; respiratory symptoms: pneumonia, pneumonitis,
difficulty breathing, diff. breathing, trouble breathing, shortness of breath, sob, dyspnoea, short of breath, flu, flulike illness, influenza, bronchitis, bronchiolitis, wheezing, wheeze, respiratory infection, respiratory illness; headache: headache, head ache, migraine; sore throat: sore throat, throat ache, throat pain; myalgia: muscle pain, muscle ache, body ache, body pain, prostration, weak, weakness, malaise, tired, fatigue
Table 2-III. Studies evaluating ILI syndrome definitions based on ED diagnoses and chief complaints
Study Setting Data source Syndrome definitions Comparator Methodology Main findings Cochrane et
al. (2008)
4 New-York City (U.S.) EDs retrospective cohort 2005-2007 ED chief complaints and ICD-9 diagnoses
Chief complaint of flu or an ICD9 final diagnosis of flu
Adapted CDC clinical definition of ILI, through chart review
Measures of predictive values
PPV for ILI symptoms through chart review: 23% and 60% for chief complaint and final diagnosis respectively. Musumba et al. (2008) One facility of North Dakota (U.S.) 2005-2008 ED chief complaints and ICD-9 diagnoses
ILI chief complaints, diagnoses with ICD9 code 487
Influenza virological data
Comparison of trends Peaks obtain from chief complaint, diagnoses, and virological data well correlated
May et al. (2010) One academic hospital ED 2005-2006 ED chief complaints and ICD-9 diagnoses
Chief complaint groupings: upper respiratory infection, asthma exacerbation, viral illness, malaise and myalgias, fever, and pneumonia. Diagnosis groupings: bronchitis, pneumonia, upper respiratory infection, acute sinusitis, pharyngitis, fever, and myalgias
CDC sentinel data for ILI
Outbreak detection with univariate and
multivariate statistical algorithm
Univariate statistical algorithm: upper respiratory tract (URT) chief complaints flagged the outbreak more consistently then diagnoses.
Multivariate statististical algorithm: a combination of URT, viral, and pneumonia diagnoses flagged the outbreak earlier, more consistently, and more clearly than the corresponding chief complaints.
13
2.1.2. Syndrome definition based on diagnosis
Schindeler et al. (2009) tested five different respiratory syndrome definitions using data from emergency departments in South-Eastern Sydney, Australia, over the 2001 to 2006 influenza seasons. The syndrome tested included an ILI syndrome defined as a diagnosis of influenza (coded ICD-9 487 or ICD-10 J10-11). Although there was an association between influenza laboratory counts and all five syndrome definitions, the strongest association was with the ILI syndrome defined above, with a 1-week lag (syndrome preceding virological data) and a risk ratio of 1.047 (95% CI 1.042-1.052). Using that same ILI syndrome definition and data from approximately three quarters of New South Wales ED data, Zheng et al. (2007) found a weak but statistically significant
cross-correlation of residuals for ED influenza diagnoses and influenza laboratory counts diagnoses, with a maximum at lag -3 days (r = 0.06, p = 0.01), and with a cluster of positive correlations at minus 2-5 days.
Others have developed and tested syndrome definitions. Marsden-Haug et al. (2007) started with a set of 29 ICD-9 codes for ILI surveillance used by ESSENCE – a surveillance system initially developed by the U.S. Department of Defense (Lewis et al. 2002). For each code, using U.S. military treatment facilities data from 2000 to 2004, they assessed: 1) positive predictive value (PPV) for positive influenza laboratory test (through linked data from 2002-2004, in an individual level study design); 2) correlations with laboratory counts (ecological); 3) and a measure of signal-to-noise ratio. Using the results of these analyses, they created two ILI syndrome definitions: one “ILI-large” definition, which includes 10 relatively common diagnostic codes, and one “ILI-small” definition, which includes 4 less frequent diagnostic codes. The correlation with weekly virological counts was 0.71 and 0.86 (p<0.0001) for the ILI-large and ILI-small definitions, respectively. The ILI-small definition was most correlated with the CDC sentinel data.
14
Cadieux et al. (2011) used Québec outpatient physician billing claim diagnoses from 2005-2007 to validate these “large” and “small” syndromic definitions of ILI against phone physician-assisted chart reviews (N=1,098). They validated the syndromic definitions against corresponding diagnoses and signs and symptoms recorded in the chart, and found high specificity for both definitions (small: 1.00, large 0.98; 95% CI within 0.01); ILI-small had lower sensitivity (0.18, CI 0.12-0.26 vs. 0.38, CI 0.35-0.41), lower positive predictive value (PPV) (0.29, CI 0.16-0.41 vs. 0.77, CI 0.73-0.81), and higher negative predictive value (NPV) (0.99, CI 0.99-0.99 vs. 0.88, CI 0.87-0.89).
Moore et al. (2011) developed a syndrome definition without any a-priori assumptions. They assessed correlation of all ED ICD-10 coded diagnoses in two hospitals from Victoria, Australia, and mandatorily reported virological data, from 2001-2009. The diagnostic codes correlated with a coefficient greater than 0.3 were kept in the definition, which in its final version included 5 codes (J11 Influenza virus not identified, J06 Acute upper respiratory infection multiple and unspecified sites, J22 Unspecified acute lower respiratory infection, B34 Viral infection, unspecified site, J18 Pneumonia organism unspecified).
2.1.3. Syndrome definition based on chief complaint
Lemay et al. (2008) used a syndrome definition derived from the Canadian clinical ILI definition, including fever, cough, respiratory symptoms, headache, sore throat, and myalgia. They applied this definition to chief complaints from 3 EDs in Ottawa, Canada, from 1998-2003, fitted an ARIMA model to both ILI counts and influenza laboratory counts, and performed cross-correlation of residuals. They performed age-stratified analyses, and found significant
correlations in all age groups. In children, the sub-classifications fever, cough, and respiratory symptoms were also correlated with virological data in many seasons.
Olson et al. (2007) used a broad syndrome definition, applied to New-York city EDs’ chief complaints during the 2001-2002 to 2005-2006 seasons, which they termed ‘‘fever and respiratory’’ syndrome, and which is composed of the
15
hierarchical and mutually exclusive syndromes ‘‘respiratory,’’ ‘‘fever/flu,’’ ‘‘common cold,’’ and ‘‘sepsis’’. Counts using this definition correlated and coincided with virological influenza data. They found that the narrow ILI definition “influenza keyword” OR (“fever-related keyword” AND (cough OR sore throat)) represented 11% of the broad “fever and respiratory” syndrome. The two definitions were highly correlated (r2 = 0.96) except during tree-pollen dominant periods.
Burkom et al. (2011) compared this narrow standardized definition to the application of local “preferred” definitions in the Distribute project participating sites, from 2005 to 2009. Distribute was a North American effort to demonstrate the feasibility of a collaborative influenza surveillance network (Olson et al. 2011). Overall, the preferred definitions yielded more cases and stronger signals, but also produced more background noise. In terms of signal-to-noise ratio and detection performance, the balance was slightly in favour of preferred definitions, although it depended on the hospital. However, the standardized definition allowed obtaining comparable ratios of ILI/total visits across hospitals. Of note,
contribution of each component (fever/cough or fever/sore throat or flu) varied according to site, age group, and season.
Pendarvis et al. (2007) compared 3 definitions using the Boston
surveillance data during the 2005-2006 season: ILI 1 (fever OR cough OR cold OR sore throat) and ILI2 (ILI 1 OR respiratory infections) had nearly identical trends, except in the elderly; ILI 3 (fever AND (cough OR cold OR sore throat)) allowed comparison with national trends. Comparing the Boston narrow and broad definitions, as well as the New-York City narrow and broad definitions, from 2005 to 2008, Paladini et al. (2008) found that narrow definitions were better correlated with virological isolates than broad definitions, and even more so when stratified by age.
16
2.1.4. Comparison of ED diagnosis vs. chief complaint
May et al. (2010) compared the performance of chief complaints and diagnoses at time of disposition from one academic hospital ED to detect the onset of influenza epidemic for the 2005-2006 season. Diagnosis was the same as the chief complaint 29% and 24% of the time, for respiratory and viral chiefcomplaints, respectively. “Upper respiratory tract” (URT) chief complaints (URT symptoms or “flu”) followed the ILI trends from the CDC sentinel network better than URT diagnoses, and, using a univariate statistical algorithm, flagged the outbreak more consistently. On the other hand, in a multivariate statististical algorithm, a combination of URT, viral, and pneumonia diagnoses flagged the outbreak earlier, more consistently, and more clearly than the corresponding URT, viral, and pneumonia chief complaints.
Cochrane et al. (2008) compared visits in 4 New-York City EDs with a chief complaint of flu or an ICD9 final diagnosis of flu, to an adapted CDC clinical definition of ILI through chart review. PPV for ILI symptoms through chart review were 23% (95% CI 18-28%) and 60% (95% CI 51-69%) for chief complaint and final diagnosis respectively. Out of 512 visits with either flu chief complaint or diagnosis, 19 had both.
Using ED visits from one facility of North Dakota over 3 seasons,
Musumba et al. (2008) found that ILI chief complaints, diagnoses with ICD9 code 487, and influenza positive test results had peaks that were well correlated.
2.1.5. General considerations
Overall, more sensitive syndromic definitions of ILI (sometimes including respiratory syndrome elements) tend to be well correlated with more specific syndromic definitions of ILI (that are closer to the clinical definitions) (Olson et al. 2007; Pendarvis et al. 2007). Specific definitions might be more correlated with virological isolates (Marsden-Haug et al. 2007; Paladini et al. 2008; Schindeler et al. 2009) and with sentinel surveillance data (Marsden-Haug et al. 2007).
17
2.2.
Influenza-related hospitalizations and
mortality – An overview
Outcomes often used to assess the burden of an influenza epidemic or pandemic are the rates of hospitalization or mortality due to influenza (Simonsen et al. 1997; Thompson et al. 2004; Zhou et al. 2012). However, hospitalizations and deaths due to influenza cannot usually be measured directly, because 1) patients with influenza can have various cardiovascular and respiratory
presentations and many will never undergo virological testing, 2) tests performed after a certain time in the progression of the disease will be negative, and 3) hospitalisations and deaths are often due to secondary complications of influenza, or to underlying conditions exacerbated by influenza, and in such cases influenza is not likely to be written on the discharge summary or death certificate (Brammer et al. 2009; Thompson et al. 2006). Many methods have therefore been developed to model and estimate the burden of influenza.
One simple way that has been used to estimate hospitalizations or deaths due to influenza is the rate difference method, where rates during a period of influenza circulation are compared to rates during periods of no circulation; the difference is attributed to influenza (Beard et al. 2006; Chiu et al. 2002; Izurieta et al. 2000; Neuzil et al. 2000). Another approach is to use Serfling-type models, which serve to estimate the excess of hospitalisations or deaths due to influenza, as compared to a modeled seasonal baseline (Serfling 1963; Simonsen et al. 1997). Statistically significant excesses are said to be above epidemic threshold. Others yet have used multivariate modeling approaches, including generalized linear regression models and autoregressive integrated moving average (ARIMA) models (Hardelid et al. 2012; Mangtani et al. 2006; Nicholson 1996; Nunes et al. 2011; Thompson et al. 2004; Upshur et al. 1999; Wong et al. 2006; Zhou et al. 2012).
Estimates of influenza-related hospitalizations or deaths may vary according to the method used. Studies that compared rate difference, Serfling, generalized linear regression (with Poisson or negative binomial distributions),
18
and/or ARIMA methods to estimate influenza-attributable hospitalizations or mortality found either moderate (Thompson et al. 2009) or important inter-method differences (Gilca et al. 2009; Newall et al. 2010; Yang et al. 2011). These
differences stress the need to validate statistical methods against epidemiological data. One study compared rate difference and Poisson regression methods, and validated the results against rates of laboratory confirmed cases in a prospectively recruited pediatric population hospitalized with acute respiratory disease (Yang et al. 2011). They found Poisson regression to outperform the rate difference method.
In addition to the choice of method, the choice of health outcome will impact the estimate of the influenza-attributable burden of hospitalizations and mortality. An outcome commonly chosen to represent influenza-related
hospitalizations and/or mortality is pneumonia and influenza (P&I) diagnoses (Berenbaum et al. 2007; Chan et al. 2011; Das et al. 2007; Muscatello et al. 2008; Olson et al. 2007; Schanzer et al. 2011; Sebastian et al. 2008; Simonsen et al. 1997; Tsui et al. 2001). However, some have suggested that P&I mortality is an underestimate of excess mortality due to influenza (Brammer et al. 2009; Simonsen et al. 1997). Simonsen et al. (1997) suggest that excess in overall mortality is a more accurate measure of the burden of influenza. Alternatively, excess overall mortality might be an overestimate of the impact of influenza, and respiratory and cardiovascular deaths might be a better measure (Brammer et al. 2009). A similar reasoning would apply to influenza-related hospitalizations, whereby P&I hospitalizations might be an underestimate of influenza-related hospitalizations. However, it remains a common measure of influenza-related hospitalizations (Berenbaum et al. 2007; Chan et al. 2011; Das et al. 2007; Olson et al. 2007; Sebastian et al. 2008; Tsui et al. 2001), thus allowing inter-study comparisons.
19
2.3.
Relationship between ILI emergency
department visits and influenza-related
hospitalizations and mortality
This review of the literature includes studies that evaluate the association between ILI ED visits (measured with chief complaint or diagnosis) and influenza-related hospitalizations or mortality. Studies are included that look at overall ILI ED visits as well as ILI ED visits grouped by age, triage score, or disposition. Measures of interest include measures of association, prediction, timeliness, and validity (sensitivity, specificity and predictive value), at the ecological or
individual level. Tables 2-IV to 2-VI summarize the studies that were included in this review of the literature.
Table 2-IV. Studies evaluating the association between overall ILI ED visits and influenza-related hospitalizations and mortality
Study Setting Syndrome tested Comparator Methodology Main findings Olson et
al.
(2007)
New York City (U.S.) EDs (coverage: 79-90%) 2001-2005
Broad “fever and respiratory” syndrome (fever/flu or respiratory)
P&I hospitalizations and P&I mortality (9 480–487; ICD-10 JICD-10.0–J11.8, J12.0–J18.9)
Serfling method applied to both syndromic data and P&I
hospitalizations to detect influenza epidemics;
Cross-correlation functions
Serfling: ED visits 1 to 3-week ahead of hospitalizations and 2 to 3 weeks ahead of deaths
Cross-correlations: ED visits and P&I hospitalizations concurrent with virological data, deaths 2 weeks after Das et al.
(2007) New York City (U.S.) EDs (coverage: approximately 90%) 2001-2004
Broad “fever and respiratory” syndrome (fever/flu or respiratory)
P&I hospitalizations, primary or secondary diagnosis (ICD9 code 480-487)
Serfling method, ratios of ED visits
to P&I hospitalizations excesses Ratio of ED/hospitalization excesses 7:1 in 2002-2003 and 15:1 in 2003-2004; no hospitalization excess in 2002-2003. Tsui et al. (2001) One ED 1999 -2000 “respiratory” set (RS) and
“influenza” set (IS) from ICD-9 coded chief complaints
P&I hospitalizations Serfling method applied to both syndromic data and P&I
hospitalizations to detect influenza epidemics;
Cross-correlation functions
RS: 100% sensitivity; 50% PPV IS: 100% sensitivity, 25% PPV Serfling: 1-week lead time
Cross-correlations: 2-week lead time
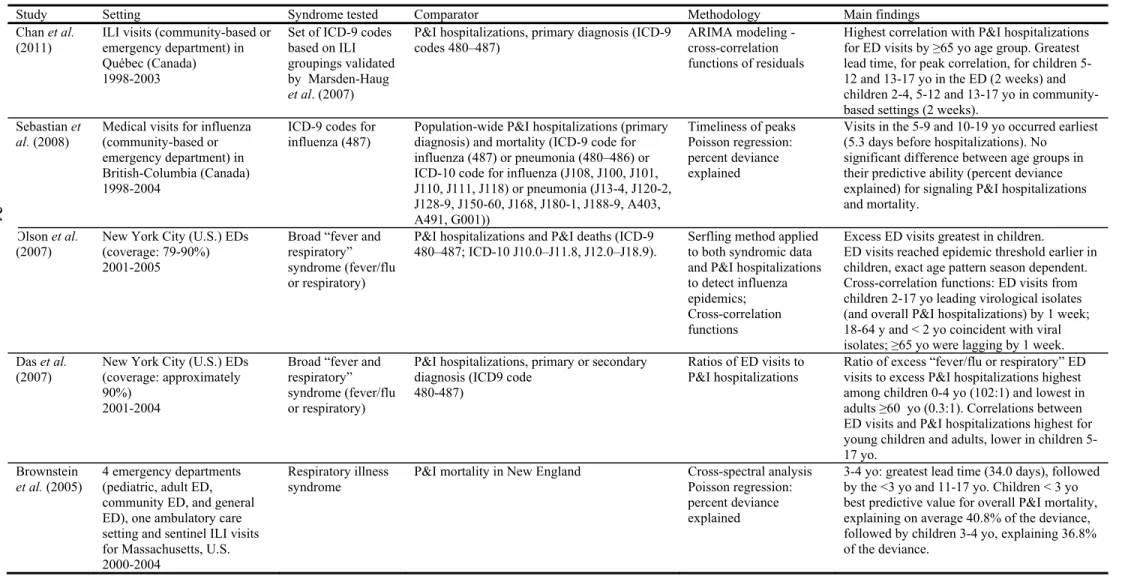
Table 2-V. Studies evaluating the association between age-stratified ILI ED visits and influenza-related hospitalizations and mortality
Study Setting Syndrome tested Comparator Methodology Main findings Chan et al.
(2011) ILI visits (community-based or emergency department) in Québec (Canada)
1998-2003
Set of ICD-9 codes based on ILI groupings validated by Marsden-Haug
et al. (2007)
P&I hospitalizations, primary diagnosis (ICD-9
codes 480–487) ARIMA modeling - cross-correlation functions of residuals
Highest correlation with P&I hospitalizations for ED visits by ≥65 yo age group. Greatest lead time, for peak correlation, for children 5-12 and 13-17 yo in the ED (2 weeks) and children 2-4, 5-12 and 13-17 yo in community-based settings (2 weeks).
Sebastian et
al. (2008)
Medical visits for influenza (community-based or emergency department) in British-Columbia (Canada) 1998-2004
ICD-9 codes for influenza (487)
Population-wide P&I hospitalizations (primary diagnosis) and mortality (ICD-9 code for influenza (487) or pneumonia (480–486) or ICD-10 code for influenza (J108, J100, J101, J110, J111, J118) or pneumonia (J13-4, J120-2, J128-9, J150-60, J168, J180-1, J188-9, A403, A491, G001)) Timeliness of peaks Poisson regression: percent deviance explained
Visits in the 5-9 and 10-19 yo occurred earliest (5.3 days before hospitalizations). No
significant difference between age groups in their predictive ability (percent deviance explained) for signaling P&I hospitalizations and mortality.
Olson et al.
(2007) New York City (U.S.) EDs (coverage: 79-90%) 2001-2005
Broad “fever and respiratory” syndrome (fever/flu or respiratory)
P&I hospitalizations and P&I deaths (ICD-9
480–487; ICD-10 J10.0–J11.8, J12.0–J18.9). Serfling method applied to both syndromic data and P&I hospitalizations to detect influenza epidemics; Cross-correlation functions
Excess ED visits greatest in children.
ED visits reached epidemic threshold earlier in children, exact age pattern season dependent. Cross-correlation functions: ED visits from children 2-17 yo leading virological isolates (and overall P&I hospitalizations) by 1 week; 18-64 y and < 2 yo coincident with viral isolates; ≥65 yo were lagging by 1 week. Das et al.
(2007)
New York City (U.S.) EDs (coverage: approximately 90%)
2001-2004
Broad “fever and respiratory” syndrome (fever/flu or respiratory)
P&I hospitalizations, primary or secondary diagnosis (ICD9 code
480-487)
Ratios of ED visits to P&I hospitalizations
Ratio of excess “fever/flu or respiratory” ED visits to excess P&I hospitalizations highest among children 0-4 yo (102:1) and lowest in adults ≥60 yo (0.3:1). Correlations between ED visits and P&I hospitalizations highest for young children and adults, lower in children 5-17 yo.
Brownstein
et al. (2005)
4 emergency departments (pediatric, adult ED, community ED, and general ED), one ambulatory care setting and sentinel ILI visits for Massachusetts, U.S. 2000-2004
Respiratory illness syndrome
P&I mortality in New England Cross-spectral analysis Poisson regression: percent deviance explained
3-4 yo: greatest lead time (34.0 days), followed by the <3 yo and 11-17 yo. Children < 3 yo best predictive value for overall P&I mortality, explaining on average 40.8% of the deviance, followed by children 3-4 yo, explaining 36.8% of the deviance.
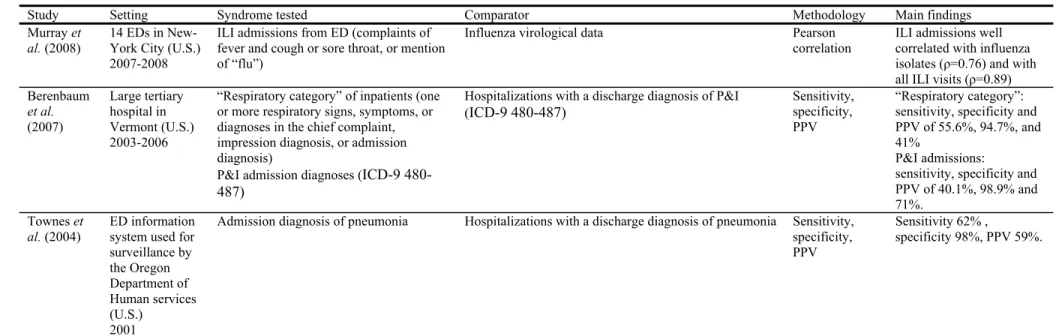
Table 2-VI. Studies evaluating the use of ED disposition data for ILI/respiratory syndrome surveillance
Study Setting Syndrome tested Comparator Methodology Main findings
Murray et
al. (2008)
14 EDs in New-York City (U.S.) 2007-2008
ILI admissions from ED (complaints of fever and cough or sore throat, or mention of “flu”)
Influenza virological data Pearson correlation
ILI admissions well correlated with influenza isolates (ρ=0.76) and with all ILI visits (ρ=0.89) Berenbaum et al. (2007) Large tertiary hospital in Vermont (U.S.) 2003-2006
“Respiratory category” of inpatients (one or more respiratory signs, symptoms, or diagnoses in the chief complaint, impression diagnosis, or admission diagnosis)
P&I admission diagnoses (ICD-9 480-487)
Hospitalizations with a discharge diagnosis of P&I
(ICD-9 480-487) Sensitivity, specificity, PPV
“Respiratory category”: sensitivity, specificity and PPV of 55.6%, 94.7%, and 41%
P&I admissions:
sensitivity, specificity and PPV of 40.1%, 98.9% and 71%.
Townes et
al. (2004) ED information system used for surveillance by the Oregon Department of Human services (U.S.) 2001
Admission diagnosis of pneumonia Hospitalizations with a discharge diagnosis of pneumonia Sensitivity, specificity, PPV
Sensitivity 62% ,
specificity 98%, PPV 59%.
23
2.3.1. Overall ILI ED visits
Tsui et al. (2001) applied the Serfling method to counts of ICD-9 coded chief complaints, using a “respiratory” set (RS) and an “influenza” set (IS), as a method to detect influenza epidemics. As a gold standard, they used pneumonia and influenza (P&I) to which they also applied the Serfling method. Over a one year period (December 1999 – December 2000), RS signaled 3 times and IS 4 times. When evaluated against the P&I signals, both RS and IS had a 100% sensitivity; RS had a 50% PPV while IS had a 25% PPV. Both RS and IS signaled 1 week earlier than P&I; when measured with cross-correlation functions, the lead time was 2 weeks.
Olson et al. (2007) used a similar method applied to ED visits in
participating New York City (NYC) hospitals with a broad “fever and respiratory” syndrome, NYC P&I hospitalizations and P&I deaths (ICD-9 480–487; ICD-10 J10.0–J11.8, J12.0–J18.9). Coverage was 79-90% of NYC for the ED data. During the 2001-2002 and 2003-2004 seasons, detection using the Serfling method on ED visits identified epidemics 1 week before P&I hospitalizations and 3 weeks before P&I deaths. In 2002-2003, ED visits signaled 2 weeks before deaths. In 2004-2005, ED visits signaled 3 weeks before P&I hospitalizations. Using cross correlation function on the most severe 2003-2004 season, they found ED visits and P&I hospitalizations to have highest correlation with virological data at lag 0, with high correlation coefficient for ED visits; P&I deaths were correlated with a 2-week lag (deaths occurring after virological data). Ratios of excess ED visits (fever/flu or respiratory) to excess P&I hospitalizations in NYC were also reported elsewhere (Das et al. 2007). These ratios were 7:1 in 2002-2003 and 15:1 in 2003-2004; there were no hospitalization excesses in 2002-2003.
2.3.2. Age-stratified ILI ED visits
In their study using NYC “fever and respiratory” ED visits, P&I
24
impact on, and timeliness of ED visits per age group. They found that in general, the burden of excess ED visits was greatest in children, and ED visits reached epidemic threshold earlier in children then in other age groups, although the exact age pattern was season dependent. The age group whose ED visits reached epidemic threshold first varied according to the season: < 2 and 2-4 year-olds in 2001-2002; 13-17 year-year-olds in 2003-2004 and; 2-4, 5-12, 13-17 year-year-olds in 2004-2005. Using cross-correlation functions on the 2003-2004 season, ED visits from children aged 2-4, 5-12 and 13-17 years were leading virological isolates and P&I hospitalizations by 1 week; visits from adults aged 18-39 and 40-64 years and from children aged < 2 years were coincident with viral isolates; and visits from adults aged ≥65 years were lagging by 1 week. Das et al. (2007) report that the ratio of excess “fever/flu or respiratory” ED visits to excess P&I
hospitalizations is highest among children aged 0-4 years (102:1) and lowest in adults aged ≥60 years (0.3:1). Correlations between ED visits and P&I
hospitalizations were highest in seasons 2001-2002 and 2003-2004 for young children and adults (r2 > 0.90). It was lower in children aged 5-17 years (r2 = 0.56) and weakest during the mild 2002-2003 season.
Sebastian et al. (2008) examined the relationship between medical visits for influenza (community-based or ED) per age group with P&I hospitalizations and mortality. They used data from the province of British-Columbia, Canada, over the 1998-1999 to 2003-2004 seasons. They found the 10-19 year-olds group to have the lowest rates of influenza medical visit, P&I hospitalization, and P&I mortality. Children aged <2 years and adults aged ≥65 years had the highest hospitalization rate, followed by children aged 2-4 years. Children aged <6 months and adults aged ≥65 years had the highest mortality rate. They assessed the
timeliness of the peak of influenza medical visits per age group with respect to population-wide P&I hospitalizations. They found peak in visits for the 5-9 and 10-19 year-olds to occur earliest (5.3 days before hospitalizations), followed by those aged 2-4 years (3.5 days), 6-24 months, 20-49 years and 50-64 years (1.8 days), <6 months (0 days) and ≥65 years (-1.8 days). Using a regression model
25
with Poisson distribution, they found no significant difference between age groups in their predictive ability (percent deviance explained) for signaling P&I hospitalizations and mortality.
Chan et al. (2011) used cross-correlation functions to assess the
relationship between ILI visits, per age group and per setting (community-based or ED), with overall P&I hospitalizations, in the province of Québec, Canada, from 1998 to 2003. The highest correlation with P&I hospitalizations was for ED visits by ≥65 years-olds. The greatest lead time for peak correlation, where ED visits preceded hospitalizations, was for children aged 5-12 and 13-17 years in the ED (2 week lead time) and children aged 2-4, 5-12 and 13-17 years in community-based settings (2 week lead time). The earliest significant correlation occurred at 3 weeks for ED visits for the 5-12 year-olds and for community-based settings for the 2-4 and 13-17 year-olds. The peak correlation for ED visits for the <2, 2-4, 18-39, 40-64 and ≥65 year age groups occurred at a lag of 0; the earliest significant
correlation varied between 1 and 2 weeks. In community-based setting, peak correlation occurred at 1 week before hospitalizations for the <2 and 18-39 year-olds, and at 0 week for the 40-64 and ≥65 year-olds; the earliest significant correlation was between 1 and 2 weeks. The age group with the greatest lead time differed from year to year, being most often the 2-4, 5-12 and 13-17 year age groups.
Brownstein et al. (2005) studied timeliness of visits with respiratory illness syndrome from different age groups and their predictive value for P&I mortality. They used visits at 4 emergency departments (pediatric, adult ED, community ED, and general ED), one ambulatory care setting, and sentinel ILI visits for Massachusetts, over 2 to 4 years depending on the setting, and assessed those counts against overall P&I mortality in New England between 2000 and 2004. Using cross-spectral analysis, they found visits by the 3-4 year-olds to have the greatest lead time (34.0 days, 95% CI 14.5-53.5), followed by the <3 and 11-17 year-olds (27.5 days, 95% CI 13.6-41.3 and 22.2-32.8 respectively) and the 5-10 year-olds (23.0 days, 95% CI 2.9-43). Children aged < 3 years had the best
26
predictive value for overall P&I mortality, explaining on average 40.8% of the deviance (95% CI 20.1-61.5), followed by children aged 3-4 years, explaining 36.8% of the deviance (95% CI 14.4-56.1), although 95% confidence intervals overlapped.
2.3.3. Triage category-stratified ILI ED visits
Triage systems are used in the ED to prioritize patients based on the urgency of their condition. The Canadian Triage and Acuity Scale (CTAS) is used throughout Canada (Christ et al. 2010). CTAS scores were found to be predictive of individual patient outcomes, such as admission, length of stay, resource utilization, and mortality (Dong et al. 2007; Jimenez et al. 2003).
Information on triage category is being used by some public health practitioners for the purpose of enhancing syndromic surveillance systems. For instance, in New-South-Wales, they include sub-analyses by age, sex, triage category, and discharge status in their daily reports (Zheng et al. 2007). However, the added value of such sub-analyses has not been reported. Similarly, the
Kingston, Frontenac and Lennox & Addington (KFL&A) Public Health jurisdiction (Ontario, Canada) used CTAS as part of their pilot syndromic
surveillance system. They found it generally useful to monitor for unusual severity of illness; however, specifics on how it was useful (for instance how it may
influence decision making) has not been reported (Moore et al. 2008). The review of the literature has not revealed any study validating or evaluating the use of triage category information for enhancing surveillance of influenza.
2.3.4. Disposition-stratified ILI ED visits
Following an ED medical encounter, patients may be discharged home, admitted to the hospital, transferred to another facility, or die. No study was identified that explicitly stratified patients according to disposition; however, a few studies focused on patients admitted from the ED. Among those, none strictly
27
fulfilled the initial inclusion criteria for this review, that is, studies that
evaluate the association between ILI ED visits (measured with chief complaint or diagnosis, with stratification by disposition) and influenza-related hospitalizations or mortality. Therefore, inclusion criteria were loosened to allow studies looking at any respiratory syndrome and studies using virological data as a gold standard.
The review of literature identified two studies that tested the use of admission data (a combination of ED syndromic and diagnositic data, and disposition data) to monitor for influenza or respiratory related hospitalization (Berenbaum et al. 2007; Townes et al. 2004). Both studies used hospital discharge diagnosis as a “gold standard”. One study tested admission data against virological data in an ecological design (Murray 2008). The rationale behind using ED
disposition/admission data for surveillance, as opposed to hospital discharge data, is that there can be an important reporting lags for the latter (Berenbaum et al. 2007; Murray 2008).
Townes et al. (2004) describe the ED information system used for surveillance by the Oregon Department of Human services, in which they use discharge disposition as a variable of “severity of illness”. Among variables of “severity of illness” (blood pressure, temperature, pulse, respiratory rate, oximetry, disposition and type of ward), disposition was the only one that was always
recorded. They compared ED discharge disposition data with hospital discharge data considered as a “gold standard”. Over the year of 2001, ED visits with an admission diagnosis of pneumonia were 62% sensitive and 98% specific for hospitalizations with a discharge diagnosis of pneumonia; the PPV was 59%.
Berenbaum et al. (2007) used a combination of ED and disposition data to evaluate a potential source of prospective surveillance of influenza-related
hospitalizations. Using admission and discharge records from a large tertiary hospital in Vermont, from 2003-2006, they evaluated a “respiratory category” of inpatients and a category comprised of P&I admission diagnoses, against a gold standard of hospitalizations with a discharge diagnosis of P&I. They defined the “respiratory category” of inpatients as those with one or more respiratory signs,
28
symptoms, or diagnoses in the chief complaint, impression diagnosis or
admission diagnosis. The respiratory category had a sensitivity, specificity and PPV of 55.6%, 94.7%, and 41% for hospitalizations with P&I diagnosis. P&I admissions had a sensitivity, specificity and PPV of 40.1%, 98.9% and 71% for hospitalizations with P&I diagnosis.
Murray et al. (2008) used ED disposition data to compare ILI admissions with ED and virological data, for 14 EDs in NYC from 2007-2008. They found ILI hospitalizations to be well correlated with influenza isolates (ρ=0.76) and with all ILI visits (ρ=0.89).
No study has been identified that evaluates the predictive value of disposition data for influenza-related hospitalizations on a population basis – in particular, its added value over the use of all visits with ILI/respiratory chief complaints or diagnoses for prediction of hospitalization counts with varying lead times.
2.4.
Methodological considerations
To evaluate the association between counts of ILI ED visits (overall or stratified) and counts of influenza-related hospitalizations or mortality, studies identified in this review have looked at 1) timeliness, 2) strength of association, or 3) predictive value, and have used a variety of methods. To look at timeliness of association, without a measure of strength of association, the relative timeliness of peaks of counts has been used (Sebastian et al. 2008). To assess timeliness of epidemic detection, the Serfling method has been used to generate signals, with sensitivity, specificity and predictive values as measures of performance (Olson et al. 2007; Tsui et al. 2001). Others have used cross-spectral analysis as a more complex approach to timeliness (Brownstein et al. 2005). Cross-correlations of time series have been used to obtain a measure of both timeliness and strength of association: either cross-correlations of the original time series (Olson et al. 2007; Tsui et al. 2001) or cross-correlation of residuals after applying an autoregressive