HAL Id: hal-00693555
https://hal-upec-upem.archives-ouvertes.fr/hal-00693555
Submitted on 20 Feb 2013
HAL is a multi-disciplinary open access
archive for the deposit and dissemination of
sci-entific research documents, whether they are
pub-lished or not. The documents may come from
teaching and research institutions in France or
abroad, or from public or private research centers.
L’archive ouverte pluridisciplinaire HAL, est
destinée au dépôt et à la diffusion de documents
scientifiques de niveau recherche, publiés ou non,
émanant des établissements d’enseignement et de
recherche français ou étrangers, des laboratoires
publics ou privés.
Iron (III)-silica interactions in aqueous solution: Insights
from X-ray absorption fine structure spectroscopy
Gs Pokrovski, J. Schott, F. Farges, Jl Hazemann
To cite this version:
Gs Pokrovski, J. Schott, F. Farges, Jl Hazemann. Iron (III)-silica interactions in aqueous solution:
In-sights from X-ray absorption fine structure spectroscopy. Geochimica et Cosmochimica Acta, Elsevier,
2003, 67 (19), pp.3559–3573. �10.1016/S0016-7037(03)00160-1�. �hal-00693555�
doi:10.1016/S0016-7037(03)00160-1
Iron (III)-silica interactions in aqueous solution: Insights from X-ray absorption fine
structure spectroscopy
GLEBS. POKROVSKI,1,* JACQUESSCHOTT,2FRANC¸ OISFARGES,3,4and JEAN-LOUISHAZEMANN5
1Institut des Sciences de la Terre d’Orle´ans (ISTO), CNRS (UMR 6113), 1A rue de la Fe´rollerie, 45071 Orle´ans cedex 2, France 2Ge´ochimie: Transferts et Me´canismes, CNRS (UMR 5563)-OMP-Universite´ Paul-Sabatier, 38 rue des Trente-Six Ponts, 31400 Toulouse, France
3Laboratoire des Ge´omate´riaux, Universite´ de Marne la Valle´e and FRE CNRS 2455, 77454 Marne la Valle´e cedex 2, France 4Surface and Aqueous Geochemistry Group, Department of Geological and Environmental Sciences, Stanford University,
Stanford, CA 94305-2115, USA
5LGIT and Laboratoire de Cristallographie, CNRS, B.P. 166, 38042 Grenoble, France (Received August 28, 2002; accepted in revised form February 17, 2003)
Abstract—The influence of aqueous silica on the hydrolysis of iron(III) nitrate and chloride salts in dilute
aqueous solutions (mFe ⬃ 0.01 mol/kg) was studied at ambient temperature using X-ray absorption fine
structure (XAFS) spectroscopy at the Fe K-edge. Results show that in Si-free iron nitrate and chloride solutions at acid pH (pH ⬍ 2.5), Fe is hexa-coordinated with 6 oxygens of H2O- and/or OH-groups in the first
coordination sphere of the metal, at an Fe-O distance of 2.00 ⫾ 0.01 Å. With increasing pH (2.7 ⬍ pH ⬍ 13), these groups are rapidly replaced by bridging hydroxyls (-OH-) or oxygens (-O-), and polymerized Fe hydroxide complexes form via Fe-(O/OH)-Fe bonds. In these polymers, the first atomic shell of iron represents a distorted octahedron with six O/OH groups and Fe-O distances ranging from 1.92 to 2.07 Å. The Fe octahedra are linked together by their edges (Fe-Fe distance 2.92–3.12 Å) and corners (Fe-Fe distance ⬃3.47
⫾ 0.03 Å). The Fe-Fe coordination numbers (Nedge ⫽ 1–2; Ncorner ⫽ 0.5– 0.7) are consistent with the
dominant presence of iron dimers, trimers and tetramers at pH 2.5 to 2.9, and of higher-polymerized species at pH ⬎ 3.
At pH ⬎ 2.5 in the presence of aqueous silica, important changes in Fe(III) hydrolysis are detected. In 0.05-m Si solutions (pH ⬃ 2.7–3.0), the corner linkages between Fe octahedra in the polymeric complexes disappear, and the Fe-Fe distances corresponding to the edge linkages slightly increase (Fe-Feedge⬃ 3.12–3.14
Å). The presence of 1 to 2 silicons at 3.18 ⫾ 0.03 Å is detected in the second atomic shell around iron. At basic pH (⬃12.7), similar structural changes are observed for the iron second shell. The Fe-Si and Fe-Fe distances and coordination numbers derived in this study are consistent with (1) Fe-Si complex stoichiometries Fe2Si1-2and Fe3Si2-3at pH ⬍ 3; (2) structures composed of Fe-Fe dimers and trimers sharing one or two edges
of FeO6-octahedra; and (3) silicon tetrahedra linked to two neighboring Fe octahedra via corners. At higher
Si concentration (0.16 m, polymerized silica solution) and pH ⬃ 3, the signal of the Fe second shell vanishes indicating the destruction of the Fe-Fe bonds and the formation of different Fe-Si linkages. Moreover, ⬃20 mol.% of Fe is found to be tetrahedrally coordinated with oxygens in the first coordination shell (RFe-O⫽ 1.84
Å). This new finding implies that Fe may partially substitute for Si in the tetrahedral network of the silica polymers in Si-rich solutions.
The results of this study demonstrate that aqueous silica can significantly inhibit iron polymerization and solid-phase formation, and thus increase the stability and mobility of Fe(III) in natural waters. The silica “poisoning” of the free corner sites of iron-hydroxide colloids should reduce the adsorption and incorporation of trace elements by these colloids in Si-rich natural waters. Copyright © 2003 Elsevier Ltd
1. INTRODUCTION
The motivation of this study is the improved quantification of the interactions of iron with silica in aquatic surface envi-ronments. Such information is crucial to better understand the effect of aqueous silica on the geochemical cycle of iron and related trace elements. Iron (III) oxides and hydroxides play an important role in a variety of environmental and industrial processes, such as chemical weathering, soil formation, and water treatment for purification and consumer use. Colloidal and amorphous Fe(III) oxy-hydroxides are important adsor-bents for many toxic organic and inorganic substances in nat-ural waters, and thus they significantly influence the fate and
toxicity of trace cations and anions in aquatic environments (e.g., Tessier et al., 1985; Manceau et al., 2000; Pokrovsky and Schott, 2002).
Silicic acid, Si(OH)4, is a major component of natural
wa-ters, attaining concentrations as high as 100 mg/L. There is ample evidence of silica-iron association in both surficial and hydrothermal processes. Important amounts of silica are incor-porated into natural Fe-hydroxide precipitates such as ferrihy-drite (Carlson and Schwertmann, 1981; Schwertmann and Tay-lor, 1989; Konhauser and Ferris, 1996). A strong chemical affinity between Fe(III) and Si is demonstrated by the forma-tion, under both natural and laboratory conditions, of iron silicates like nontronite, ferric chlorites/serpentines and smec-tites (e.g., Decarreau et al., 1987; Bailey, 1988; Toth and Fritz, 1997; Drief et al., 2001, and references therein). The presence of silica in solution significantly influences Fe(III) hydrolysis and precipitation. For example, aqueous silica inhibits goethite * Author to whom correspondence should be addressed at present
address: Ge´ochimie: Transferts et Me´canismes CNRS (UMR 5563)-OMP-Universite´ Paul Sabatier, 38 rue des 36 Ponts, 31400 Toulouse, France ([email protected]); LL107-108-Bailey.
Pergamon Printed in the USA. All rights reserved
0016-7037/03 $30.00 ⫹ .00
formation from solution and prevents colloidal Fe(III) hydrox-ides from coagulating (Schenk and Weber, 1968; Anderson and Benjamin, 1985; Vempati and Loeppert, 1989). The formation of ferryhydrite over lepidocrocite during oxidation of Fe2⫹
solutions is favored in the presence of silicic acid (e.g., Schwert-mann and ThalSchwert-mann, 1976; Mayer and Jarrel, 1996). Despite that several studies have been devoted to adsorption and incor-poration of aqueous silica onto Fe(III) (oxy)hydroxides (McPhail et al., 1972; Sigg and Stumm, 1980; Hansen et al., 1994a, 1994b; Davis et al., 2002), little is known about the molecular structure of iron-silicate surface complexes and the position of silicon atoms in the iron (III) solids. Quantitative information about the stoichiometry and stability of Fe-Si com-plexes in aqueous solution is limited to FeSiO(OH)3
2⫹
that forms at acid pH between Fe3⫹
and monomeric Si(OH)4
(We-ber and Stumm, 1965; Olson and O’Melia, 1973; Reardon, 1979). Structural aspects of the interactions between silicic acid and ferric iron hydroxide complexes during Fe(III) hydrolysis are, however, poorly known. The aim of the present work is to use X-ray Absorption Fine Structure (XAFS) measurements at the Fe K-edge to characterize the local environment around Fe in dilute aqueous solutions in the presence of dissolved silica over a wide range of pH.
In many studies dealing with iron hydrolysis in concentrated solutions (⬎0.1 m) and surface complexation of cations and anions with Fe(III) oxy-hydroxides and colloids (e.g., Combes et al., 1989, 1990; Waychunas et al., 1993; Bottero et al., 1994; Manceau and Charlet, 1994; Rose et al., 1997a; Manceau et al., 2000, and references therein), XAFS spectroscopy was the chosen method because it provides quantitative information at the atomic scale about the local structural environment of Fe and other elements in any system, including their aqueous and surface complexes (ligand’s identity and number, and inter-atomic distances). Until now, however, the exact structural position of silicon in Fe-dominated solids or solutions could not be detected by XAFS spectroscopy, because the weak signal from the light silicon backscaterers at the Fe K-edge (⬃7100 eV) is usually masked by the presence of heavier atoms (Fe) in concentrated iron solutions (e.g., Doelsh et al., 2000) or Si-bearing iron hydroxides (Manceau et al., 1995). Although lim-ited information about the structural environment around sili-con (and similar light elements like Al, P; e.g., Rose et al., 1997a; Ildefonse et al., 1998; Gehlen et al., 2002) can be also obtained at the Si K-edge (⬃1800 eV), the low energy provides a short spectral range, and usually requires high Si concentra-tions and heroic efforts to diminish the absorption by the sample environment. In contrast, currently available third-gen-eration synchrotron radiation sources allow XAFS analyses in the fluorescence mode at iron K-edge at Fe concentrations as low as 10⫺2 to 10⫺3 m. Although such concentrations are
higher than those usually encountered for Fe in natural waters, they are low enough to significantly slow down Fe(III) poly-merization and precipitation, and to allow accurate character-ization of Fe-Si interactions (complexation) which can be eas-ily masked by Fe-Fe condensation and solid-phase formation at higher Fe concentrations. Therefore, it is expected that the XAFS results obtained in this study should help in the refine-ment of aqueous and surface complexation models of Fe(III)aq/Fe hydroxides with silica and other trace oxy-anions
which could be used for better understanding of the behavior of iron in natural waters and its role in the scavenging of inorganic and organic compounds.
2. MATERIAL AND METHODS 2.1. Sample Preparation
Iron(III)-bearing aqueous solutions for XAFS (X-ray Absorption Fine Structure) experiments were prepared by dissolving weighted amounts of hydrated ferric nitrate (Fe(NO3)3·9H2O, 99.99%, Aldrich Chemicals) or ferric chloride (⬃0.6-m FeCl3aqueous solution, Merck Chemicals) in doubly de-ionized water. The iron content of the initial solutions was checked by flame Atomic Absorption and was found to be close to the theoretical concentration within 2% of the total value. The pH of the solutions was adjusted by adding 1-m nitric (HNO3) or hydrochloric (HCl) acid, or 1-m tetramethylammonium hydroxide (N(CH3)4OH) Titrisol solutions; it was measured before and after each experiment with a combination pH glass electrode (SCHOTT-H61) calibrated on the activity scale using the NIST tartrate, phthalate, phosphate and borate buffers (pH20°C⫽ 1.69, 4.00, 6.87 and 9.21, respectively) and 0.1-m HCl and 0.01-m NaOH solutions (pH20°C⫽ 1.11 and 12.12, respectively). Silicic acid (H4SiO4) was introduced into the Fe-bearing solutions as weighted amounts of a 0.67-m Si solution, prepared by equilibration of amorphous silica powder (SiO2· 2.2H2O) at ambient temperature in a 0.5-m tetramethylammonium hydroxide solution. Tetramethylammonium was chosen in this study as the major cation, because of its extremely low complexing affinity for metals in aqueous solution (Wesolowski et al., 1995) even in comparison to other commonly used background cations (Na⫹
, K⫹
). The influence of (CH3)4N
⫹
on Fe hydrolysis and Fe-Si complexing in solution can thus be neglected when analyzing XAFS spectra. To avoid possible poly-merization and/or precipitation during sample preparation, solutions were vigorously stirred using a magnetic stirrer during mixing and pH adjustment, and then immediately filtered through a 0.2-m Millipore filter. This procedure was expected to eliminate possible heterogeneous nucleation sites and, thus, to delay significantly colloidal and solid-phase formation (see below). Measurements were started within 1 h, and completed usually within 5 h after solution preparation. Iron and silica concentrations in the experimental solutions used for XAFS experiments were 0.01 and 0.05 m, respectively (with exception of a single FeCl3solution containing 0.16 m silica). Such high silica con-centrations were chosen to allow unambiguous detection of the light silicon backscaterers (see below). The pH of most solutions ranged from 1 to 3, which corresponds to H/Fe and OH/Fe hydrolysis total molal ratios from ⬃10 to ⬃0.1, and from ⬃0.1 to ⬃4 (depending on Si concentration), respectively. At pH ⬎ 3 in both Si-free and Si-bearing solutions, rapid precipitation of Fe-hydroxide was observed; however, at strongly basic pH (pH ⫽ 12–13, OH/Fe ⬎ 5–10) this precipitate dissolved yielding a clear purple solution whose XAFS spectrum was also recorded (Tables 2– 4). Monomeric silica, total Si and total Fe concentrations were determined using the molybdate blue colorimetric method (Koroleff, 1976), ICP-MS (Inductively Coupled Plasma Mass Spectrometry; see details in Pokrovski and Schott, 1998), and flame atomic absorption spectroscopy (Pokrovski et al., 2002a), respectively. Selected solutions before and after XAFS measurements were filtered through a 0.2-m filter, diluted to 5 to 20 ppm of Fe and Si, and stabilized by 2 wt.% HNO3for analyses of total Fe and Si performed after the XAFS session. Monomeric silica was analyzed as a function of pH (2.00, 3.65 and 10.95) and time elapsed (from few minutes to 5 h) after preparation in 0.05-m Si solutions prepared exactly in the same manner as the experimental ones. Each of these solutions was diluted at constant pH to 7 to 10 ppm of Si with aqueous HNO3or N(CH3)4OH and analyzed for Si(OH)4with an Autoanalyser II Tech-nicon colorimeter (molybdate blue method) from 2 min to 1 h after dilution. This procedure allows, even at alkaline pH where the kinetics of depolymerization is very fast, to measure only monomeric silicic acid (and, possibly, silicic acid dimers) present in the initial concen-trated solution (Koroleff, 1976; Iler, 1979; Dietzel and Usdowski, 1995). Analyses performed on solutions before and after XAFS spectra acquisition showed no changes in total Si and Fe concentrations in the limit of the analytical uncertainties (⫾5% of total concentration).
Silicic acid remained essentially monomeric (⬃90% of total Si) in the alkaline solutions during experiments. This is in agreement with equi-librium calculations using the stabilities of silicate oligomers formed in basic solutions (Baes and Mesmer, 1976). In acid solutions, silica polymerization occurred within few minutes, and only 15 to 20% of total Si was found to be monomeric, depending on solution pH (2–3.65) and time (few minutes to 5 h). Nevertheless, the structural environment of Fe derived from the XAFS spectra was found to be insensitive to the degree of silica polymerization (see below). In a solution with the highest Si concentration (0.16 m) at pH 3, a silica gel was observed after measurements. No significant pH changes (⫾0.1– 0.2 pH unit) were recorded after experiments for all solutions. Although the major-ity of solutions at pH ⬎ 2 were significantly supersaturated with respect to Fe oxy-hydroxides (␣-FeOOH, amorphous Fe[OH]3), the constancy of Fe and Si concentrations and pH, measured before and after exper-iments on solutions filtered through 0.2-m membrane filters, indicates that no precipitation of Fe (or Fe-Si) solid phases occurred during measurements. However, the presence of nano-particles of such phases or colloids, which could have passed through the 0.2-m filter, cannot be completely excluded on the bases of chemical analyses only. Nev-ertheless, XAFS analysis indicates that such particles were likely to be insignificant in our solutions. First, successive EXAFS scans, recorded in this study during at least 3 to 5 h for all solutions, were very similar for each given sample and were without suspicious noise and flaws, thus demonstrating that the local atomic environment of Fe remains the same in the experimental solutions. Second, as it will be shown below (section 3), the number of Fe-Fe neighbors derived from the EXAFS spectra of acid solutions corresponded to the dominant presence of small Fe polymeric species, and was much lower than what would be expected for Fe-bearing solid/colloidal particles. This indicates that no significant solid-phase formation occurred over at least the time of measurements (⬍5 h).
2.2. XAFS Spectra Acquisition and Data Reduction
XAFS spectra (including the X-ray absorption near edge structure region or XANES, and the extended X-ray absorption fine structure region or EXAFS) were collected at ambient temperature (20 ⫾ 1°C) in the fluorescence mode at the Fe K-edge (⬃7130 eV) over the energy range 7000 to 8000 eV on the collaborative research group IF BM32 beamline at the European Synchrotron Radiation Facility (ESRF, Grenoble, France). The storage ring was operated at 6 GeV with a 200 –150 mA current. The beam energy was selected using a Si(111) double crystal monochromator with dynamical sagittal focussing. The fluorescence spectra were collected using a Canberra 30-element solid-state detector. The solutions were placed in a special Teflon cell with Kapton-film windows. The cell handling and spectra acquisition pro-cedure were similar to those described in Pokrovski et al. (2000, 2002b). To obtain the necessary signal-to-noise ratio for quantifying next-nearest neighbors (Fe, Si) around the absorbing Fe atoms, three scans (of ⬃50 min/scan data collection time) for each solution were collected to high energy values (up to k ⫽ 14 –15 Å⫺1, where k is the photo-electron momentum). After acquisition, all scans for each sample were carefully inspected for each individual solid state detector and, if found reasonably free of beam intensity fluctuations and other flaws, were added together. Goethite, ␣-FeOOH, ferric iron nitrate, Fe(NO3)3·9H2O, epidote, Ca2(Al,Fe
3⫹)
3(Si2O7)(SiO4)(O,OH)2, and LiAlO2doped with 1 wt.% of Fe3⫹, which can serve as model com-pounds for Fe local environment (see Wilke et al., 2001), were recorded in the transmission mode to exclude self-absorption effects.
Data analysis was performed with the XAFS 2.6 package (Winterer, 1997) using the “standard” procedure (Teo, 1986). Details about spec-tra reduction can be found in Pokrovski et al. (2002b). Briefly, the before-edge spectral region (7000 –7100 eV) was fitted using a straight line and subtracting this from the whole spectrum. Then, the spectra were normalized for atomic absorption, based on the average absorp-Table 1. Structural parameters of the Fe(III) atomic environment in iron-bearing solids derived in this study from fitting Fe K-edge EXAFS spectra, and comparison with X-ray diffraction (XRD) data.
Compound, chemical formula
EXAFSa XRD Atom REXAFS (Å) NEXAFS 2 (Å2) Atom RXRD (Å) NXRD Ref. b
Iron (III) nitrate, Fe(NO3)3· 9H2O O 2.00 5.5 0.003 O1 1.974 2 HB
O2 1.986 4
Epidote, Ca2Al2.17Fe0.81Si3O12OH O1 1.88 1.7 0.002 O1 1.88 1
O2 2.00 1.8 0.001 O2 1.95 1
O3 2.24 1.7 0.015 O3 2.00 2
Al 2.95 2fc 0.004 O4 2.24 2 D
Si1 ⫹ Ca1 3.28 4f 0.007 Al1 2.99 2
Si2 3.46 2f 0.002 Si1 3.26–3.29 3 Ca2 3.74 3f 0.015 Ca1 3.29 1 Si2 3.46 2 Ca2 3.64–3.86 3 Goethite, ␣-FeOOH O1 1.94 3.1 0.005 O1 1.953 3 O2 2.08 2.5 0.006 O2 2.09 3 Fe1 3.03 2f 0.005 Fe1 3.01 2 S Fe2 3.28 2f 0.006 Fe2 3.28 2 Fe3 3.44 4f 0.008 Fe3 3.46 4 ␥-LiAlO2with 1 wt.% Fe3⫹ O 1.86 3.1 0.0005 O 1.82d 4d WR Al 3.15 4.2 0.007 Al 3.12 4 M
Error of EXAFS fit ⫾0.01 ⫾0.5 ⫾30%
aR ⫽ Fe-neighbor mean distance, N ⫽ Fe coordination number, 2⫽ squared Debye-Waller factor (relative to 2⫽ 0 adopted in the calculation of reference amplitude functions by FEFF, see text).
bReferences for XRD data: HB: Hair and Beattie (1977); D: Dollase (1971); S: Szytula et al. (1968); M: Marezio (1965), WR: Waychunas and Rossman (1983).
cf ⫽ parameter was fixed to crystallographic value during fit. dparameters derived from EXAFS fitting.
tion coefficient of the spectral region 7200 to 7400 eV. Pre-edge features were processed by subtracting a 2-degree polynomial fit to the absorption background, 2 eV from both sides of the prepeak, to deter-mine the pre-edge intensity (normalized to the main-edge), peak area and half-height width. Background above the edge was determined by fitting cubic spline functions. Energies were recalculated into k-space (Å⫺1) with E
0(i.e., the energy where k is zero) arbitrarily chosen at zero of the main edge first derivative. Normalized background-sub-tracted EXAFS spectra were weighted by k3, filtered over the k range from ⬃3 to 13–14 Å⫺1, and Fourier-transformed (Kaiser-Bessel win-dow with values of 2.5) to produce radial distribution functions (RDF) that isolate different atomic shells. To extract structural infor-mation, one or several RDF contributions were back-transformed into momentum space and modeled by least-square fitting. This gives the identity of the backscattering atoms (e.g., O, Si, or Fe), Fe-neighbor distance (R) and coordination number (N), and the Debye-Waller factor (2) for a given scattering path. In addition to these structural param-eters, a single nonstructural parameter, ⌬E0, was varied in initial fits to account for its estimate made by FEFF (see below). It was found that the optimal value of ⌬E0varied within ⬍ ⫾2 eV for most reference solids and aqueous samples. Raw EXAFS spectra were also fitted with multiple shells; they produced values of structural parameters similar to those extracted from fits of filtered signals for an individual shell. For
most spectra which showed weak second shell contributions around Fe, fits of the total EXAFS spectrum were, however, less robust and exhibited larger uncertainties than those for the individual shell fits. Consequently, the results of the latter models were considered to be more reliable and they are reported in this study. Theoretical backscat-tering amplitude and phase-shift functions for Fe-O and Fe-Si, Fe-Fe, and Fe-Cl pairs were computed using the FEFF 8 ab initio code (Ankudinov et al., 1998), assuming the local structure around Fe in andradite garnet, Ca3Fe2Si3O12(Hazen and Finger, 1989), ␣-FeOOH (Szytula et al., 1968), and FeOCl (Lind, 1970), respectively. The validity of the generated amplitude and phase functions was checked by fitting EXAFS spectra of Fe(III)-bearing solids. Interatomic distances and coordination numbers derived from fitting of model compounds are in close agreement with those obtained by X-ray Diffraction (XRD) in the limit of ⫾0.02 Å and ⫾0.5 atoms for first and next-nearest atomic shells (Table 1). The influence of anharmonic disorder in determining structural parameters was checked using the cumulant expansion method (Crozier et al., 1988; Farges, 1996; Farges et al., 1996; Soldo et al., 1998). The typical values of third- and fourth-order cumulants (C3 and C4) found when fitting the filtered signal for the Fe first coordination shell were of the order of 10⫺4and, consequently, too small to affect significantly R and N values derived from least-square fits without cumulants. As a result, to reduce the number of variables and thus the uncertainties on the derived parameters, we choose the harmonic approximation when extracting R, N and values for all Fe atomic shells. The influence of possible multiple scattering (MS) events within the Fe first and second coordination shells on the EXAFS spectra was also tested using the FEFF code, assuming local Tdand Oh geometries around Fe(III), as found in the model compounds investi-gated. However, we cannot exclude the possibility of unusual local geometries that can favor MS events. Nevertheless, with the exception of the most acid solutions (pH ⬃ 1), MS contributions were found to be negligible when fitting the next-nearest atomic shells.
3. RESULTS
3.1. XANES Analysis
3.1.1. Pre-Edge region
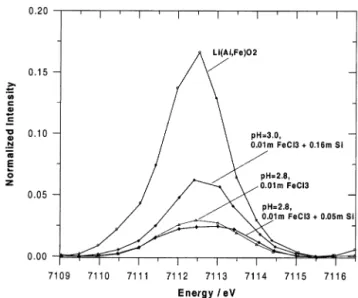
Normalized XANES spectra for selected Fe-bearing solu-tions and solids are presented in Figure 1. All spectra exhibit pre-edge features at 7112.5 ⫾ 0.2 eV (Table 2, Figs. 1 and 2), which are caused by electronic transitions from the 1s to 3d Fig. 1. XANES spectra at Fe K-edge of selected Fe-bearing solutions
and solids. The vertical dashed lines indicate the pre-edge feature and main edge of iron. Arrows labeled A and B denote different main-edge features discussed in the text.
Fig. 2. Pre-edge features of selected 0.01-m FeCl3solutions and ferric lithium aluminate. Note a significant enhancement of the pre-edge intensity for the 0.16-m Si solution, suggesting the presence of tetracoordinated Fe like in Li(Al,Fe)O2.
states in the iron atom (Apted et al., 1985; Combes et al., 1989, 1990; Wilke et al., 2001). The intensity, shape and position of the pre-edge features reflect the redox state and symmetry of Fe sites (Wilke et al., 2001). The normalized height, peak area, and half-width of these features for experimental solutions and reference solids are summarized in Table 2. Because of the relatively low spectral resolution provided by the Si(111) monochromator, these pre-edge features could not be modeled precisely into different components and, therefore, were treated as a single peak.
The pre-edge parameters of both Fe nitrate and chloride solutions at acid pH (pH ⬍ 2.2) are similar to that of Fe(NO3)3·9H2O (Table 2), in which Fe
3⫹
is octahedrally co-ordinated by six H2O (Hair and Beattie, 1977). This confirms
that a similar geometry around the Fe3⫹
cation exists in acid aqueous solution (Apted et al., 1985). With increasing pH, the intensity of the pre-edge feature grows slightly, most likely reflecting an increased distortion of centrosymmetry within the FeO6octahedron (although the appearance of minor amounts of
four- and/or five-coordinated Fe(III) species cannot be ex-cluded) (Combes et al., 1989; Wilke et al., 2001).
No significant differences in the pre-edge features were observed in the presence of 0.05-m Si at pH from 2.1 to ⬃13. By contrast, at higher silica concentration (0.16 m) at pH ⫽ 3, the pre-edge peak is enhanced by a factor of ⬃2 to 3 (Fig. 2). This enhancement indicates the presence of a tetrahedral envi-ronment for Fe in this solution, like in solid LiAlO2doped with
Fe(III), in which Fe is tetracoordinated by oxygens (Waychu-nas and Rossman, 1983). Assuming that the pre-edge peak height and area are proportional to the percentage of tetrahedral Fe (Combes et al., 1989; Peterson et al., 1997; Wilke et al., 2001), and using the values of corresponding parameters for
Li(Al,Fe)O2, the proportion of [4]
Fe in the 0.16-m Si solution can be estimated as ⬃22 ⫾ 5 mol%. This value is confirmed by the EXAFS analysis (see below).
3.1.2. Main-Edge region
Spectra of 0.01-m Fe nitrate and chloride silica-free and silica-bearing acid solutions (pH ⬍ 2.5) are similar in shape and white-line positions (⬃7131.5 eV) to that of hydrated iron nitrate Fe(NO3)3·9H2O suggesting the same Fe octahedral
co-ordination. In Si-free solutions of higher pH (pH ⬎ 2.5), the edge-crests are slightly shifted to lower energies (⬃7131.0 eV); the spectra’s shape is very similar to that of goethite (␣-FeOOH) having a feature at ⬃7148 eV (identified by arrow B in Fig. 1). Because the goethite structure is characterized by distorted FeO3(OH)3octahedra linked together by their edges
and corners (Manceau and Combes, 1988), similar structures could be expected in the iron oxy-hydroxide oligomer com-plexes formed at pH ⬎ 2.5 in solution. In the presence of 0.05-m Si at pH of ⬃2.8, the goethite features are partially suppressed, and the spectra shape more resembles those for acid solutions. These qualitative changes in the presence of silica at pH ⬎ 2.5 might indicate a more symmetrical Fe atomic environment in Fe-Si complexes like that at more acid pH. At higher silica concentration (0.16-m Si polymerized solution, pH
⫽ 3), the main-edge shape and position are significantly
dif-ferent from those for the 0.05-m Si solutions. The white-line position (7130 eV) and the after edge-crest feature (at ⬃7138 eV, marked by arrow A in Fig. 1) are very close to those observed in the spectrum of Li(Al,Fe)O2(Fig. 1, Table 2). This
similarity, together with the enhanced pre-edge feature (see Table 2. Pre-edge and main-edge parameters from iron K-edge XANES spectra of Fe(III)-bearing solids and solutions measured in this study.
Sample
Pre-edge Main edge
Centroid position (eV)
Normalized
height Peak area
Half-width (eV)
Main-edge crest energy (eV)
Solids
Fe(III) nitrate, Fe(NO3)3· 9H2O 7112.3 0.016 0.064 3.7 7131.5
Goethite, ␣-FeOOH 7112.7 0.020 0.068 3.4 7130.3
Epidote 7112.5 0.034 0.097 2.7 7127.6
LiAlO2doped with 1 wt.% Fe
3⫹ 7112.5 0.174 0.381 2.2 7129.0
Si-free solutions (0.01-m Fe)a
Fe(NO3)3⫹ 0.1 ⫽ m HNO3, pH 1.15, H/Fe ⫽ 10 7112.8 0.020 0.063 3.2 7131.6
FeCl3⫹ 0.1-m HCl, pH 1.10, H/Fe ⫽ 10 7112.8 0.020 0.063 3.2 7131.5 Fe(NO3)3, pH 2.10, H/Fe ⫽ 1 7112.6 0.020 0.070 3.5 7132.0 Fe(NO3)3, pH 2.36, OH/Fe ⫽ 0 7112.5 0.022 0.068 3.2 7131.3 Fe(NO3)3, pH 2.80, OH/Fe ⫽ 2.8 7112.5 0.032 0.078 2.5 7130.9 FeCl3, pH 2.80, OH/Fe ⫽ 2.8 7112.5 0.032 0.074 2.5 7130.9 Fe(NO3)3, pH 12.9, OH/Fe ⫽ 15 7112.5 0.026 0.101 3.9 7131.2
Si-bearing solutions (0.01-m Fe)a
Fe(NO3)3⫹ 0.05-m Si, pH 2.10, OH/Fe ⫽ 0 7112.6 0.023 0.095 4.0 7131.5
Fe(NO3)3⫹ 0.05-m Si, pH 2.80, OH/Fe ⫽ 2.0 7112.6 0.027 0.078 2.7 7130.5
FeCl3⫹ 0.05-m Si, pH 2.80, OH/Fe ⫽ 2.0 7112.6 0.024 0.078 2.7 7130.5
FeCl3⫹ 0.16-m Si, pH 2.95, OH/Fe ⫽ 4.0 7112.6 0.068 0.155 2.3 7130.3
Fe(NO3)3⫹ 0.05-m Si, pH 12.5, OH/Fe ⫽ 10 7112.5 0.029 0.117 4.0 7131.2
Error of deconvolution ⫾0.2 eV ⫾10% ⫾15% ⫾0.3 eV ⫾0.5 eV
aH/Fe and OH/Fe stand for the molal ratio of iron salt concentration to the total added acid (HNO
3or HCl) and base (N(CH3)4OH) concentration, respectively, during solution preparation (see text for details).
section 3.1.1), suggests the presence in this solution of iron in tetrahedral coordination.
3.2. EXAFS Analysis of Silica-Free Solutions
3.2.1. First atomic shell
Normalized k3
-weighted EXAFS spectra and their Fourier Transforms (FT) of the studied Si-free solutions are presented in Figures 3a and 3b. In strongly acid chloride and nitrate solutions (pH ⬍ 2.4), both EXAFS and FT spectra exhibit a single contribution from a first shell of oxygens around Fe. Modeling this signal yields 6.0 ⫾ 0.5 oxygens with a mean Fe-O distance of 2.00 ⫾ 0.01 Å. This is in agreement with the EXAFS measurements of Combes et al. (1989) on highly concentrated Fe(III) hydrolyzed solutions (mFe⬎ 0.1 m), and
consistent with the predominance of Fe(H2O)6 3⫹
and Fe(H2O)5OH
2⫹
(Baes and Mesmer, 1976). Including chlorine in the fit of the first shell contribution of the 0.01-m FeCl3⫹
0.1-m HCl solution slightly improves the fit quality, suggesting the possible presence of ⬃0.3 ⫾ 0.2 Cl atoms (Table 3). No Cl atoms were detected in the first Fe shell of FeCl3⫾ HCl (0.01
⬍ mCl⬍ 0.1) solutions at higher pH.
At pH from 2.4 to 2.8 in both nitrate and chloride solutions, the number of neighbors remains the same within errors as in
the strongly acid solutions (NFe-O⫽ 5.5 ⫾ 0.5), but the average
Fe-O distance decreases by 0.03 Å (RFeO⫽ 1.97 Å). The first
coordination sphere of Fe deviates a little from a regular octahedron, as indicated by an increase of the DW factor (from 0.005 to ⬃0.01, see Table 3).
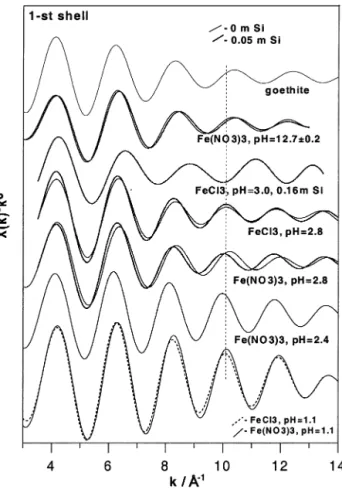
At basic pH, fits of the first Fe shell are consistent with two different Fe-O distances (1.92 and 2.05 Å), resembling closely the iron local environment in goethite (see Table 1). This is demonstrated in Figure 4. The EXAFS spectra of the first shell of both goethite and Fe basic solution are similar, but exhibit a distinct phase shift (indicated by the dashed line) in comparison to acid solutions.
3.2.2. Second and third atomic shells
At pH ⬍ 2, the minor feature observed at ⬃3.5 Å on the FT spectra (Fig. 3b, not corrected for phase shift) might correspond to both multiple scattering paths within the symmetrical FeO6
octahedron and the second solvation shell around Fe3⫹
, by analogy with EXAFS and WAXS (wide-angle X-ray scatter-ing) results on other trivalent cations like Cr3⫹
, In3⫹
, or Ga3⫹
(Lindqvist-Reis et al., 1998). At pH from 2 to 2.4, this contri-bution is hardly discernable, probably due to the distortion of the octahedral symmetry of the first Fe shell. The small lobes Fig. 3. k3-weighted EXAFS spectra at Fe-K edge of selected Si-free Fe nitrate and chloride solutions as a function of pH
(a); and their corresponding Fourier Transforms (not corrected for phase shift) (b). The vertical lines on (b) indicate Fe-Fe edge and double-corner linkages in the polymerized Fe oxy-hydroxide complexes.
visible at the FT’s of these solutions above ⬃3 Å are likely to be caused by the spectral noise. No second-shell iron atoms (NFe-Fe⬍ ⬃0.1) could be detected in our dilute solutions at pH
⬍ 2.4.
At pH from 2.5 to 3, and from 12 to 13, the spectra exhibit an important second shell feature (Figs. 3a and 3b). This feature is, in part, similar to that of ␣-FeOOH, and corresponds to several Fe-Fe pairs with distances ranging from 2.9 to 3.5 Å. The appearance of Fe-Fe contributions clearly demonstrates the formation of polymeric iron-hydroxide complexes. For an FeCl3solution at pH 2.8, the second shell feature was
success-fully fitted using two Fe-Fe subshells with distances of 3.04 and 3.46 Å (Table 4). For iron nitrate solutions at pH 2.8 and 12.7, the best fits were achieved with three Fe-Fe subshells, at 2.94,
⬃3.09, and 3.47 Å. These findings are in good agreement with
the previous studies by XAFS spectroscopy of the hydrolysis of more concentrated iron chloride and nitrate solutions (0.1 ⱕ
mFeⱕ 1.0). Two Fe-Fe distances at 3.01 to 3.05 and 3.44 to
3.47 Å were detected during hydrolysis of FeCl3(e.g., Combes
et al., 1989; Bottero et al., 1994), and at least three distances, at 2.88 to 3.05, 3.06 to 3.14, and 3.42 to 3.52 Å, in the case of Fe(NO3)3 hydrolysis (Rose et al., 1997b), in solutions with
OH/Fe molal ratios ⬎ 1.5. Four different Fe-Fe subshells, with distances ranging from 2.95 to 3.90 Å, were reported in a more recent study of iron hydroxide precipitates obtained by hydro-lysis of 0.2-mol/L FeCl3solutions (Doelsh et al., 2000). Based
on these studies and using the analogy with Fe oxy-hydroxide solids (Manceau and Combes, 1988, and references therein), whose structures consist of Fe-O/(OH)6octahedra sharing their
faces (RFe-Fe⫽ 2.89 Å in hematite), edges (RFe-Fe⫽ 2.95–3.30
Å in goethite, hematite, akaganeite, lepidocrocite) and/or dou-ble corners (RFe-Fe⫽ 3.40 –3.50 Å in goethite, hematite), the
Fe-Fe distances derived for the hydrolyzed solutions of the present study can be attributed to polymeric species with
edge-Table 3. Structural parameters of the first atomic shell of iron obtained from fitting Fe K-edge EXAFS spectra of 0.01 molal Fe(III)-nitrate and -chloride solutions with and without aqueous silica.a
Solution pH20°C Atomic pair R (Å) N (atom) 2(Å2) chi2
Si-free solutions
Fe(NO3)3, ⬃0.1-m HNO3 1.03 Fe-O 1.996 (0.002) 5.9 (0.3) 0.003 (0.0005) 1.36
Fe(NO3)3, ⬃0.1-m HNO3 1.15 Fe-O 1.994 (0.002) 6.1 (0.2) 0.004 (0.0005) 0.60
FeCl3, ⬃0.1-m HCl 1.10 Fe-O 2.002 (0.003) 6.0 (0.2) 0.004 (0.0005) 0.30 Fe-Cl 2.30 (0.03) 0.3 (0.2) 0.002 (0.001) Fe(NO3)3 2.10 Fe-O 2.00 (0.01) 5.5 (0.3) 0.005 (0.001) 1.20 Fe(NO3)3 2.36 Fe-O 2.02 (0.01) 5.0 (0.5) 0.005 (0.001) 0.23 Fe(NO3)3 2.80 Fe-O 1.98 (0.01) 5.9 (0.3) 0.009 (0.002) 0.55 FeCl3 2.80 Fe-O 1.97 (0.02) 5.5 (0.4) 0.010 (0.003) 0.60 Fe(NO3)3 12.9 Fe-O1 1.92 (0.03) 2.5 (0.5) 0.006 (0.002) 0.70 Fe-O2 2.05 (0.03) 2.8 (0.5) 0.006 (0.002) Si-bearing solutions Fe(NO3)3, 0.05 · m Si 2.10 Fe-O 2.00 (0.01) 5.6 (0.4) 0.005 (0.001) 0.43 Fe(NO3)3, 0.05 · m Si 2.80 Fe-O 1.995 (0.005) 5.9 (0.3) 0.009 (0.002) 0.57 FeCl30.05-m Si 2.80 Fe-O 1.99 (0.01) 6.2 (0.4) 0.010 (0.002) 0.46
FeCl3, 0.16-m Si (colloidal) 2.95 Fe-O1 1.84 (0.02) 1.1 (0.2) 0.0005 (0.0002) 0.60
Fe-O2 1.99 (0.02) 4.5 (0.5) 0.012 (0.002)
Fe(NO3)3, 0.05 · m Si 12.5 Fe-O1 1.93 (0.03) 3.7 (0.3) 0.005 (0.002) 0.76
Fe-O2 2.07 (0.02) 1.7 (0.3) 0.006 (0.002)
aR ⫽ Fe-neighbor mean distance, N ⫽ Fe coordination number, 2⫽ squared Debye-Waller factor, chi2⫽ N/(F ⫻ M) ⫻ ⌺(Y
exp2–Yfit2), where
N ⫽ number of independent data, F ⫽ degrees of freedom, M ⫽ number of data points fitted, and Yexp 2–Y
fit
2⫽ difference between squared experimental and fitted EXAFS absorption coefficient (X · k3) of the filtered signal for each point (Press et al., 1986). Typical R-window range of FT used for back-transform to isolate the first shell is 0.6 to 2.2 Å. Values in parentheses represent uncertainty for each parameter.
Fig. 4. EXAFS spectra of the first Fe atomic shell of selected 0.01-m Fe nitrate and chloride solutions at the indicated pH, with and without aqueous silica. The vertical line indicates phase shifts with increasing pH or Si concentration (see text for details).
and double corner-sharing Fe-O6octahedra. Although the 2.94
⫾ 0.01 Å distance found for our nitrate solutions is close to that
corresponding to Fe-Fe face-sharing in hematite (2.89 Å), the formation of edge-sharing structures during Fe hydrolysis at ambient temperature is unlikely (e.g., Combes et al., 1989; Jolivet et al., 1994). Hematite-like structures usually form from ferric gels at later stages of hydrolysis or after long aging times and at elevated temperatures that favors dehydration (e.g., Schwertmann and Taylor, 1989; Combes et al., 1990). The structures found in our dilute solutions are similar to those of Al(III), Ga(III), and Cr(III) hydroxide polymeric species formed in concentrated solutions (0.2–1.0 m) during the hydro-lysis of nitrate or chloride salts of these metals (Jolivet et al., 1994; Michot et al., 2000; Pokrovski et al., 2002b). Note that beyond the first Fe shells, all hydrolyzed solutions investigated in this study were reasonably modeled using two to three Fe-Fe contributions, in accordance to the degree of freedom for our filtered second shell spectra which ranges between 5 and 9 (Stern, 1993). The addition of a fourth Fe-Fe shell (for example at ⬃3.3 or 3.9 Å) led to highly correlated and often unreason-able Debye-Waller factors and coordination numbers and de-creased significantly the goodness of fit. Consequently, taking into account the signal-to-noise ratio and k-range of the spectra of the dilute solutions investigated in this study, a two- or three-shell model was kept throughout the analysis of Fe hy-drolysis.
3.3. EXAFS Analysis of Silica-Bearing Solutions
3.3.1. First atomic shell
In the presence of 0.05-m aqueous silica in strongly acid (pH
⬍ 2–2.5) and basic (pH ⬎ 12) solutions, no changes in the first
coordination shell of iron were detected in comparison with their Si-free analogs (Table 3), which is also in agreement with the XANES analysis (see above). In contrast, in the interme-diate pH region (2.7 ⬍ pH ⬍ 3), Fe-O6distances in 0.05-m Si
chloride and nitrate solutions are distinctly longer than in their Si-free counterparts (2.00 instead of 1.97 Å, see Table 3 and Fig. 4) and close to those in more acidic solutions. This is also in line with the XANES analysis and can be interpreted by a partial destruction of the relatively short Fe-O-Fe linkages between FeO6 octahedra and formation of longer Fe-OH or
Fe-O-Si bonds.
In a more concentrated Si solution (0.16-m Si) at pH 3, the EXAFS spectrum is distinctly different, exhibiting important phase shifts and amplitude changes compared to the spectra of less concentrated Si solutions at similar pH (Figs. 4 and 5). Modeling of this spectrum is consistent with the presence of two distinct sets of Fe-O distances: ⬃1.84 Å (N ⫽ 1) and 1.99 Å (N ⫽ 4 –5) (Table 3). The shorter Fe-O distance is very close to those found in tetrahedral sites of Fe3⫹
in Li(Al,Fe)O2
(Table 1) and Fe(III)-bearing micas (e.g., Dyar et al., 2001; Giuli et al., 2001). The derived Fe-O distances and coordination numbers imply the presence of ⬃20% Fe in a tetrahedral coordination, probably substituting for Si in the tetrahedral framework of the silica polymers formed in this solution. Note that the percentage of[4]
Fe deduced from the EXAFS analysis is in excellent agreement with that derived from the pre-edge data (see above).
3.3.2. Second and third atomic shells
In the spectra of acid solutions in the presence of 0.05-m Si (pH ⬍ 2.4), no second-shell Fe-Fe or Fe-Si contributions were detected in the limit of the spectral resolution (NFe-Fe⬍ ⬃0.1;
NFe-Si⬍ ⬃0.5 atoms).
At pH 2.8 in contrast, important changes occur in the spectra of both 0.01-m ferric nitrate and chloride solutions in the presence of 0.05-m aqueous silica. This is manifested by the disappearance, in the total EXAFS spectrum, of the feature at
⬃7.5– 8 Å⫺1
which corresponded to the Fe-Fe contributions in Si-free solutions, and by distinct phase shifts in the region 7 to Table 4. Structural parameters of the next-nearest atomic shells of iron obtained from fitting Fe K-edge EXAFS spectra of 0.01 molal Fe(III)-nitrate and -chloride solutions with and without aqueous silica.a
Solution pH20°C Atomic pair R (Å) N (atom) 2(Å2) chi2
Si-free solutions Fe(NO3)3 2.8 Fe-Fe1 2.93 (0.03) 0.5 (0.2) 0.007 (0.003) 0.25 Fe-Fe2 3.07 (0.02) 0.9 (0.4) 0.005 (0.003) Fe-Fe3 3.46 (0.01) 0.5 (0.1) 0.004 (0.002) FeCl3 2.8 Fe-Fe1 3.04 (0.01) 1.3 (0.2) 0.010 (0.003) 0.28 Fe-Fe2 3.46 (0.01) 0.5 (0.1) 0.005 (0.002) Fe(NO3)3 12.9 Fe-Fe1 2.95 (0.03) 0.8 (0.3) 0.006 (0.003) 0.30 Fe-Fe2 3.12 (0.03) 1.2 (0.3) 0.006 (0.003) Fe-Fe3 3.48 (0.04) 0.7 (0.3) 0.007 (0.002) Si-bearing solutions Fe(NO3)3, 0.05-m Si 2.8 Fe-Fe 3.12 (0.03) 0.9 (0.2) 0.007 (0.002) 0.20 Fe-Si 3.18 (0.03) 1.5 (0.5) 0.007 (0.002) FeCl3, 0.05-m Si 2.8 Fe-Fe 3.12 (0.02) 1.3 (0.2) 0.007 (0.002) 0.16 Fe-Si 3.17 (0.03) 2.0 (0.5) 0.007 (0.002) Fe(NO3)3, 0.05-m Si 12.5 Fe-Fe1 2.93 (0.02) 0.3 (0.2) 0.007 (0.003) 0.30 Fe-Fe2 3.11 (0.02) 1.5 (0.5) 0.007 (0.003) ⫾Fe-Si 3.17 (0.03) 2.0 (1.0) 0.007 f
aSee footnotes for Tables 1 and 3.
Typical R-window range of FT used for back-transform to isolate the next-nearest shells is 2.2 to 3.5 Å for Si-free solutions, and 2.15 to 3.3 Å for Si-bearing solutions.
9 Å⫺1(Fig. 5a). The contributions from the Fe-Fe edges at
⬃2.95 Å for nitrate solutions, and Fe-Fe double-corner
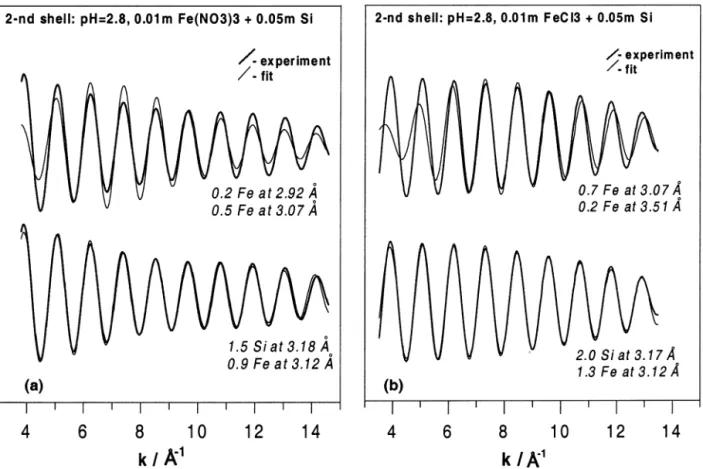
link-ages for both nitrate and chloride solutions, apparent in the RDF’s of the Si-free samples at these pH values, disappear in the presence of silica (Fig. 5b). The filtered second shell signal exhibits an important amplitude decrease and phase shift in the presence of silica (Fig. 6). These observations strongly suggest a destruction of the Fe-Fe linkages of iron hydroxide polymers, and the entering of Si in the second coordination shell of Fe. The analysis of the iron second shell for these samples was performed using either two Fe-Fe subshells or one Fe-Fe ⫹ one Fe-Si subshell. Figure 7 shows such fits for Fe nitrate and chloride solutions at pH 2.8 with 0.05-m Si. It can be seen in this figure that the presence of iron atoms only cannot account for the observed second shell signal. Including light neighbors like oxygens or Cl/NO3 do not affect the fit; adding a third
Fe-Fe subshell resulted in less robust models, yielding highly correlated and unreasonable N and 2
values. In contrast, significant good-quality fits were obtained for both solutions
using 0.9 to 1.3 Fe atoms at 3.12 ⫾ 0.03 Å, and ⬃2 ⫾ 0.5 Si atoms at 3.18 ⫾ 0.03 Å (Fig. 7, Table 4). The uncertainties on these N and R values stem mostly from possible variations of the ⌬E0parameter (⫾2 eV, see section 2.2). Because Fe-Fe and
Fe-Si individual electronic waves are shifted by ⬎ /2 and thus are almost out of phase, the amplitude of the resulting spectrum for the second shell is quite sensitive to the value chosen for
⌬E0. Nevertheless, fits of the Fe-Fe/Si contributions at pH 2.8
were robust and always converged to the parameters reported in Table 4 whatever the starting values of R, N, and ⌬E0. These
results confirm quantitatively the observations of RDF’s of these solutions, which indicate the destruction of Fe-Fe edge and double-corner bonds in the iron polymeric species in the presence of Si (Fig. 5b).
At pH 12.7 in the presence of 0.05-m Si, similar changes in the EXAFS spectrum were observed (Figs. 5 and 6). The suppression of Fe-Fe edge and corner contributions is apparent on the Fourier Transform (Fig. 5b). A fit of the second-shell signal confirms these observations, yielding two Fe-Fe edge Fig. 5. k3-weighted EXAFS spectra at the Fe-K edge of 0.01-m Fe nitrate and chloride solutions in the presence of
aqueous silica at different pH (a); and their Fourier Transforms (not corrected for phase shift) (b). Solid curves ⫽ Si-bearing solutions with indicated concentrations and pH; dashed curves ⫽ spectra of the corresponding Si-free solutions at the same pH (see also Fig. 3). The arrows indicate changes in the presence of aqueous silica: phase shifts (a); suppression of the double-corner Fe-Fe contributions in the second Fe atomic shell (b). The vertical lines on (b) stand for octahedral or tetrahedral first shell coordination of Fe, and Fe-Fe edge and Fe-Si double corner linkages in the second shell of iron in its silicate complexes.
contributions at 2.93 and 3.11 Å (Table 4). The amplitude decrease of the second shell Fe-Fe signal was, however, much weaker than for less hydrolyzed solutions at acid pH (Fig. 6). Consequently, fits were less sensitive to the presence of silicon. It was found that addition of 2 ⫾ 1 Si atoms at 3.17 Å improves only slightly the fit quality. This is in agreement with previous EXAFS studies of Fe hydroxide precipitates formed in the presence of Si (Doelsh et al., 2000), and hydrous iron silicate scale deposits (Manceau et al., 1995) that failed to detect the light Si in the second iron coordination shell dominated by Fe-Fe contributions. At earlier hydrolysis stages (pH ⬍ 3.0) of our experimental solutions of low Fe concentration, the Fe-Fe contributions to the EXAFS signal are significantly lower and thus allow accurate detection of light silicon atoms in the second shell.
With increasing Si concentration (0.16-m Si, pH ⫽ 3), Fe-Fe second shell contributions vanish indicating the almost com-plete destruction of iron polymers. The detection of Si was also impossible, probably because of an important disorder associ-ated with various[4]
Fe-O-Si and[6]
Fe-O-Si contributions. More measurements in Si-rich solutions are required to distinguish between these different linkages.
4. DISCUSSION
4.1. Iron Hydrolysis and Polymerization in Dilute Solutions
The results of this study demonstrate that the Fe3⫹
cation rapidly hydrolyses in dilute chloride and nitrate aqueous solu-tions via formation of Fe oxy-hydroxide polynuclear species composed of Fe(O/OH/H2O)6 octahedra linked together by
their edges and double corners. This is in good agreement with previous XAFS studies of Fe hydrolysis in concentrated solu-tions (⬎0.1-m Fe) that have shown the formation of large Fe polymers in chloride and nitrate solutions with increasing OH/Fe ratios or aging time (e.g., Combes et al., 1989, 1990; Bottero et al., 1994; Rose et al., 1997b). The number of edge (2.90 –3.05 Å) and double-corner (3.40 –3.50 Å) linkages de-rived in those studies increase, respectively, from 1 to 3.5 and from 1 to 2 in solutions with OH/Fe ratios ⬎ 1.5 (2 ⬍ pH ⬍ 5), suggesting the presence of large Fe oxy-hydroxide entities (e.g., “Fe24,” Bottero et al., 1994). Such species are regarded as
precursors for goethite, akaganeite or hematite (depending on solution composition, temperature and time of aging). In the more dilute solutions of the present study, the number of edge-and corner-sharing neighbors at pH of ⬃2.8 is consistent with the formation of smaller Fe polymers, most likely a mixture of dimers, trimers and tetramers. At basic pH (OH/Fe ⬎ 5), the Fe-Fe coordination numbers (Nedge⫽ 2.0, Ncorner⫽ 0.7; Table
4) correspond to tetramers or/and bigger polymeric species (e.g., “Fe24”), in agreement with previous studies. The
sche-matic structures of the main hydroxide polymers likely to form during Fe(III) hydrolysis are presented in Figure 8.
The results on Fe-hydrolysis obtained in this study can be compared with speciation calculations using the available sta-bility constants for the iron dimer, Fe2(OH)2
4⫹
, and trimer, Fe3(OH)4
5⫹
, obtained from potentiometric measurements in dilute Fe nitrate or chloride solutions (e.g., Baes and Mesmer, 1976; Martell et al., 1998, and references therein). The distri-bution of Fe hydroxide species in a 0.01-m Fe(III) nitrate solution at 25°C and a 0.15-mol/L ionic strength is shown as a function of pH in Figure 9a. At pH ⬍ 2.4, calculations predict
⬍ 20% of total Fe is present as dimers, and ⬍ 5% as trimers,
which corresponds to ⬃0.2 Fe atoms in the second Fe shell. This is close to the detection limit of Fe-Fe second neighbors of our EXAFS spectra. At higher pH (2.6 ⬍ pH ⬍ 3.0), calcula-tions indicate that the dimer and trimer account for ⬃20 to 30% of total Fe each. This corresponds to Nedge⫽ ⬃0.4 to 0.5 and
Ncorner⫽ ⬃0.3 Fe atoms, assuming an edge-sharing dimer and
a double-corner trimer (Bottero et al., 1994; Jolivet et al., 1994). Our EXAFS analysis yields significantly higher coordi-nation numbers at these pH values, confirming the formation of bigger Fe polymers, likely tetramers (Fig. 8). Note that tet-rameric species with edge and double-corner linkages were shown to form during Cr3⫹
and Ga3⫹
hydrolysis; they are also considered as precursors for the nucleation of Al and Fe(III) oxy-hydroxide phases (Jolivet et al., 1994, and references therein; Michot et al., 2000). The very high lability of Fe3⫹
in comparison to Al3⫹
or Cr3⫹
makes it difficult to stabilize small Fe polymers in supersaturated solution in the absence of strongly complexing ligands (Jolivet et al., 1994) which can explain the absence of thermodynamic data for Fe-tetramers Fig. 6. Comparison of second-shell filtered EXAFS signal of Si-free
and Si-bearing 0.01-m Fe solutions. Note important amplitude decrease and phase shifts in the presence of Si, suggesting a partial destruction of Fe-Fe bonds and formation of Fe-Si linkages.
and the “Fe24” polycation. 1
Consequently, the equilibrium cal-culations presented here give a simplified image of iron spe-ciation especially at pH ⬎ 3– 4, which is likely dominated by tetrameric and/or bigger species.
4.2. Iron-Chloride Complexing
The presence of chlorine neighbors was not detected in the first and second Fe atomic shell in hydrolyzed 0.01-m FeCl3
solution at pH 2.8. This is in agreement with equilibrium calculations carried out using the available stability constants for Fe(III) chloride species (taken from the compilation of Tagirov et al., 2000), suggesting that only 6% of total Fe should be complexed in the form of FeCl2⫹
and FeCl2
⫹
species in this solution. In strongly acid non-hydrolyzed solution (pH ⬃ 1, 0.1-m Cl⫺, 0.01-m FeCl3), less than 0.3 Cl atoms could be
detected in the Fe first shell from analysis of its EXAFS spectrum. Speciation calculations for this solution composition indicate that FeCl2⫹
and FeCl2
⫹
represent respectively ⬃40 and ⬃10% of total Fe. This corresponds to an average Fe-Cl coordination number of 0.6, if one assumes inner-sphere com-plexation. The lower first shell coordination number obtained in
this study (NFe-Cl⬃ 0.3, Table 3) suggests a portion of Fe-Cl
species may be in the form of outer-sphere complexes which could not be detected by EXAFS analysis in this study. Thus, the presence of Cl atoms weakly bonded to Fe hydroxide species in outer coordination shells during iron hydrolysis cannot be completely excluded. More ordered second shell Fe-Fe structures observed in this study at pH 2.8 for 0.01-m chloride (two Fe-Fe subshells) compared to nitrate (three Fe-Fe subshells) solutions, imply that chloride can probably intervene in Fe hydrolysis in dilute solutions, as it was suggested for Cl-rich solutions (0.2–1.0-m Cl; Combes et al., 1989; Doelsh et al., 2000). However, the structural role of Cl⫺ during the hydrolysis of dilute Fe(III)-chloride solutions remains unclear. At ambient temperature, the negatively charged Cl⫺ could weakly interact with the outer shells of positively charged Fe polymeric oxy-hydroxide species and affect polymerization/ nucleation kinetics. However, as it is demonstrated in this study, the role of Cl⫺in Fe hydrolysis in dilute solutions is negligible as compared to that of silica.
4.3. Structure and Stoichiometry of Fe-Si Aqueous Complexes
XAFS measurements reported in this study unambiguously demonstrate that aqueous silica inhibits Fe3⫹
hydrolysis via formation of stable complexes with polymeric ferric oxy-hy-droxide species. Fe-Si and Fe-Fe distances and coordination 1 The value of the first-order rate coefficient for the exchange of water
molecules from the bulk solution into the inner coordination sphere of the hexacoordinated aquo ion is 1.6 ⫻ 102, 1.3 and 2.4 ⫻ 10⫺6s⫺1for Fe3⫹, Al3⫹and Cr3⫹, respectively (Merbach and Akitt, 1990).
Fig. 7. Examples of EXAFS fits of the filtered second shell signal of 0.01-m ferric nitrate (a) and chloride (b) solutions at pH 2.8 in the presence of 0.05-m Si. It can be seen that Fe-Fe contributions only cannot account for the observed spectrum. Including a Fe-Si shell yields robust good-quality fits in a wide k-range (see text for details).
numbers derived in this study indicate that SiO4-tetrahedra
substitute for double-corner FeO6-octahedra in the
Fe(III)-polymers. The iron-silicon distance of 3.18 Å found in both nitrate and chloride solutions is close to those for Fe-As and Fe-Se in2
C-type surface complexes formed by slightly bigger arsenate and selenate anions with hydrous ferric oxides (⬃3.25 Å, Manceau and Charlet, 1994; Manceau, 1995; Waychunas et al., 1993, 1995), and those for Fe-P found in Fe(III) phosphate minerals and aqueous solution (⬃3.20 Å, Rose et al., 1996, 1997a). The iron-iron coordination numbers corresponding to the Fe-Fe edge linkages are affected only slightly in the pres-ence of aqueous silica both at acid and basic pH (Table 4). This suggests that at the early stages of hydrolysis, after the Fe-Fe dimer formation (Jolivet et al., 1994), aqueous silica is not capable of destroying these bonds significantly. The iron-iron edge distances in the silicate complexes found in this study (3.12 Å) are the same in both nitrate and chloride solutions at pH 2.8, suggesting that the edge-linked Fe polymers accom-modate silica tetrahedra in a very similar way, independently of the nature of the ligand (Cl⫺
versus NO3
⫺
). This confirms that neither chloride nor nitrate influence significantly Fe-Si inter-actions in dilute solutions typical of natural waters.
The numbers of Fe and Si neighbors around iron in the silicate complexes formed at acid pH (NFe-Fe⫽ 0.9 –1.3; NFe-Si
⫽ 1.0 –2.0) is consistent with stoichiometries Fe2Si1-2 and
Fe3Si2-3, corresponding to a mixture of Fe-Fe dimers and
planar trimers linked to one to three silicate anions by their free double corners (Fig. 8). At basic pH, the Fe-Fe and Fe-Si
coordination numbers found in this study imply that more polymerized Fe-Fe species, such as edge-sharing tetramers or bigger, are likely to form similar structures with silica. Note that the speciation of silica in 0.05-m Si solutions investigated in the present work is dominated by polymeric species (⬃80% of total Si) at acid pH and by monomeric silicate anions (⬎90% of total Si) at basic pH (see section 2.1). Nevertheless, the structural position of silicon atoms in the Fe-Si complexes appears to be similar at both acid and basic pH. This might reflect the preferential interaction of hydrolyzed Fe-polymers with monomeric Si(OH)4. Indeed, reactions with big silicate
polymers are likely to be hampered by slow kinetics and steric constraints (e.g., Swaddle, 2001). However, it cannot be ex-cluded that Fe might interact with certain configurations of silicic acid polymers in acid solution. The structures of Fe-Si complexes proposed in this study are summarized in Figure 8. By analogy with other tetrahedral anions like arsenate, selenate or phosphate, silicate can be expected to form also other types of bonds with Fe-octahedra, such as edge (type1
E,
RFe-Si ⬃ 2.8 –2.9 Å) and single-corner (type 1
C, RFe-Si ⬃
3.4 –3.6 Å) linkages (e.g., see Manceau and Charlet, 1994; Manceau, 1995, for the linkage terminology). Nevertheless, none of these contributions was detected in this study. The
1
E-linkages are not known in Fe(III) silicate and phosphate minerals. Thus, the edge-edge linkages between FeO6and SiO4
are supposed to be negligible in solution, at least at the condi-tions of the present work. The existence of 1
C bonds in the Si-rich solutions investigated in this study, however, cannot be Fig. 8. Schematic illustration of Fe(III) hydrolysis in Si-free aqueous solution, and structures of Fe-Si complexes
proposed in this study for moderately concentrated Si-solutions. Octahedra represent the first Fe(O/OH/H2O)6atomic shell; tetrahedra stand for the silicate moieties Si(O/OH)4of monomeric silicic acid or silica polymers.
ruled out. Because of the expected higher degree of freedom associated with such single-corner bonds, their detection by EXAFS spectroscopy, which is very sensitive to disorder, is likely to be difficult. This is confirmed by the fact that no Si could be detected around the iron atom in the present study in a Si-rich solution (0.16-m Si) at pH 3. The presence of single
corner Fe-O-Si bonds is also expected in the monomer complex FeOSi(OH)3
2⫹
reported in acid solutions (Weber and Stumm, 1965; Olson and O’Melia, 1973; Reardon, 1979). Equilibrium calculations using the stability constant for this species derived from the studies cited above suggest that this complex should account for 50 ⫾ 10% of total Fe at pH ⬃2.1 in the presence of 0.05-m Si(OH)4(Fig. 9b). This percentage corresponds to an
average number of Si neighbors of ⬃0.5 in the second coordi-nation sphere of Fe at this pH. However, no Si neighbors could be found in the spectrum of a 0.05-m total Si solution at pH 2.1, in which silica was partially polymerized (see above). This might reflect both the difficulties to detect, by EXAFS spec-troscopy, the light silicon in the disordered second shell envi-ronment of iron, and the lower affinity of Fe3⫹
cation for polymeric silicate species than for monomeric silicic acid (see above). More measurements at different Si concentrations are needed to confirm this hypothesis.
5. CONCLUDING REMARKS
The results of this study demonstrate that aqueous silica affects the hydrolysis of Fe(III) in dilute solution via the formation of iron silicate aqueous complexes. In these struc-tures, silica substitutes for double-corner FeO6-octahedra in
iron oxy-hydroxide polymeric complexes existing at the early stages of Fe(III) hydrolysis, likely by forming2
C-type (double corner) complexes with small Fe oxy-hydroxide polymers whose structure consists of FeO6-octahedra linked together by
common edges. To our knowledge, this is the first quantitative evidence of the silica atomic environment in ferric silicate aqueous complexes.
The formation of soluble Fe-Si complexes delays the nucle-ation and growth of solid ferric oxy-hydroxides from aqueous solution. The significant silica concentrations found in these minerals in nature (e.g., Carlson and Schwertmann, 1981; Kon-hauser and Ferris, 1996) are likely to be a consequence of the aqueous Fe-Si complexing. However, the effect of silica on Fe(III) hydrolysis is significantly weaker than on Al3⫹
or Ga3⫹
hydrolysis. Due to the high affinity of Al and Ga for the tetrahedral coordination, these elements form much stronger covalent-bonded silicate complexes in which the metal is tetra-coordinated even at acid pH and low silica concentrations (⬍0.01-m Si) (Pokrovski et al., 2002b). Ferric iron, in contrast, keeps an octahedral environment at moderate Si concentrations, and takes a tetrahedral coordination only in solutions highly enriched in silica (⬎0.1-m Si), in which Fe3⫹
may substitute for Si in the Si-polymer network. The observation, in high-temperature hydrothermal and metamorphic environments, of micas and amphiboles having significant proportions of Fe3⫹
in tetrahedral coordination (e.g., Dyar et al., 2001; Giuli et al., 2001) could thus be indicative of high silica activities during the formation of such minerals. In near-surface conditions, which are characterized by much lower aqueous silica activi-ties, Fe3⫹
remains essentially hexa-coordinated in low-temper-ature oxy-hydroxides and clays (e.g., Sherman and Vergo, 1988; Manceau et al., 1998).
The geometry and structure of the silicate complexes formed at the surfaces of iron oxy-hydroxide minerals and colloids are expected to be similar to those found for the Fe-Si aqueous solutions investigated in this study. Via its linking to the free Fig. 9. Predicted iron speciation in a 0.01-m ferric nitrate Si-free
solution (a), and in the presence of 0.05-m monomeric silica (b) at 25°C as a function of solution pH. Calculations were performed using the stability constants for Fe hydroxide species reported by Baes and Mesmer (1976), and that for the iron-silica complex as the average value from Weber and Stumm (1965), Olson and O’Melia (1973), and Reardon (1979): Fe3⫹⫹ Si(OH)
4(aq) ⫽ FeOSi(OH)3 2⫹⫹ H⫹
, log10K (25°C, I ⫽ 0) ⫽ 0.03 ⫾ 0.10. Ionic strength was fixed at 0.15, and the activity coefficients of aqueous species were approximated by the extended Debye-Hu¨ckel equation with å ⫽ 4.5 Å for all charged species. Note that because of the lack of stability constants for iron oligomers bigger than trimers, this diagram represents a simplified image of the iron speciation at pH ⬎ 3– 4. Consequently, the mono-meric species at pH ⬎ 4 (dashed lines) are likely not dominant, and they are shown only for consistency with the calculations.
corners of FeO6-octahedra, aqueous silica can decrease
signif-icantly the number of available sorption sites in Si-rich natural waters, and thus reduce both the incorporation of other trace anions and cations into iron hydroxides, and the bioavailability of their surfaces for Fe-metabolizing microorganisms (e.g., Meng et al., 2000; Santelli et al., 2001). The results on Fe-Si complex stoichiometries and structures obtained in this work may help improve models of silicate sorption by iron hydroxide phases, and abiotic or microbially catalyzed dissolution of iron silicate minerals.
Acknowledgments—We are grateful to the IF CRG commission of the
ESRF for providing beam time and access to the synchrotron facility. We would like to thank Yvonne Soldo, Olivier Proux and Jean-Jacques Menthonnex for their professional assistance during XAFS measure-ments at BM 32 beamline. Oleg Pokrovsky is acknowledged for his generous help in solution preparation and spectra acquisition during the long and cold nights at the ESRF. Anastassia Borisova is thanked for her help in polyhedral modeling. We are indebted to Jacques Roux for his great help with software installation and running, and Jean-Michel Be´ny for his advice on crystallography. We are grateful to the Asso-ciate Editor, Michael Machesky, for his thoughtful comments and corrections that greatly improved the presentation and clarity of this article. We thank Je´roˆme Rose, Glenn Waychunas, and Dave Sherman for their careful and constructive reviews of the manuscript.
Associate editor: M. L. Machesky
REFERENCES
Anderson P. R. and Benjamin M. M. (1985) Effects of silicon on the crystallization and adsorption properties of ferric oxides. Environ.
Sci. Technol. 19, 1048 –1053.
Ankudinov A. L., Ravel B., Rehr J. J., and Conradson S. D. (1998) Real-space multiple-scattering calculation and interpretation of X-ray-absorption near-edge structure. Phys. Rev. B 58, 7565–7576. Apted M. J., Waychunas G. A., and Brown G. E. Jr (1985) Structure
and specification of iron complexes in aqueous solutions determined by X-ray absorption spectroscopy. Geochim. Cosmochim. Acta 45, 421– 429.
Baes C. F. Jr. and Mesmer R. E. (1976) The Hydrolysis of Cations. John Wiley, New York.
Bailey S. W. (1988) Odinite, a new dioctahedral-trioctahedral Fe3⫹ -rich 1: 1 clay mineral. Clay Miner. 23, 237–247.
Bottero J.-Y., Manceau A., Villieras F., and Tchoubar D. (1994) Structure and mechanisms of formation of FeOOH(Cl) polymers.
Langmuir 10, 316 –319.
Carlson L. and Schwertmann U. (1981) Natural ferrihydrite in surface deposits from Finland and their association with silica. Geochim.
Cosmochim. Acta 45, 421– 429.
Combes J. M., Manceau A., Calas G., and Bottero J.-Y. (1989) For-mation of ferric oxides from aqueous solutions: A polyhedral ap-proach by X-ray absorption spectroscopy: I. Hydrolysis and forma-tion of ferric gels. Geochim. Cosmochim. Acta 53, 583–594. Combes J. M., Manceau A., and Calas G. (1990) Formation of ferric
oxides from aqueous solutions: A polyhedral approach by X-ray absorption spectroscopy: II. Hematite formation from ferric gels.
Geochim. Cosmochim. Acta 54, 1083–1091.
Crozier E. D., Rehr J. J., and Ingalls R. (1988) Amorphous and liquid systems. In X-Ray Absorption: Principles, Applications, Techniques
of EXAFS, SEXAFS and XANES (eds. D. C. Koningsberger and R.
Prins), pp. 373– 442. Wiley-Interscience, New York.
Davis C. C., Chen H. W., and Edwards M. (2002) Modeling silica sorption to iron hydroxide. Environ. Sci. Technol. 36, 582–587. Decarreau A., Bonnin D., Badaut-Trauth D., Couty R., and Kaiser P.
(1987) Synthesis and crystallogenesis of ferric smectite by evolution of Si-Fe coprecipitates in oxidizing conditions. Clay Miner. 22, 207–223.
Dietzel M. and Usdowski E. (1995) Depolymerization of soluble sili-cate in dilute aqueous solutions. Colloid Polym. Sci. 273, 590 –597.
Doelsch E., Rose J., Masion A., Bottero J. Y., Nahon D., and Bertch P. M. (2000) Speciation and crystal chemistry of iron (III) chloride hydrolyzed in the presence of SiO4ligands. 1. An Fe K-edge EXAFS study. Langmuir 16, 4726 – 4731.
Dollase W. A. (1971) Refinement of the crystal structures of epidote, allanite and hancockite. Am. Miner. 56, 447– 464.
Drief A., Nieto F., and Sanchez-Navas A. (2001) Experimental clay-mineral formation from a subvolcanic rock by interaction with 1M NaOH solution at room temperature. Clays Clay Miner. 49, 92–106. Dyar M. D., Delaney J. S., and Sutton S. R. (2001) Fe XANES spectra
of iron-rich micas. Eur. J. Mineral. 13, 1079 –1098.
Farges F. (1996) Does Zr-F complexation occur in magmas? Chem.
Geol. 127, 253–268.
Farges F., Brown G. E. Jr., Navrotsky A., Gan H., and Rehr J. J. (1996) Coordination chemistry of Ti(IV) in silicate glasses and melts: III. Glasses and melts from ambient to high temperatures. Geochim.
Cosmochim. Acta 60, 3055–3065.
Gehlen M., Beck L., Calas G., Flank A. M., van Bennekom A. J., and van Beusekom J. E. E. (2002) Unravelling the atomic structure of biogenic silica: Evidence of the structural association of Al and Si in diatom frustules. Geochim. Cosmochim. Acta 66, 1601–1609. Giuli G., Paris E., Wu Z., Brigatti F., Cibin G., Montana A., and
Marcelli A. (2001) Experimental and theoretical XANES and EX-AFS study of tetra-ferriphlogopite. Eur. J. Miner. 13, 1099 –1108. Hair N. J. and Beattie J. K. (1977) Structure of hexaaquairon(III) nitrate
trihydrate. Comparison of iron(II) and iron(III) bond lengths in high-spin octahedral environments. Inorg. Chem. 16, 245–250. Hansen H. C. B., Raben-Lange B., Raulund-Rasmussen K., and
Borg-gaard O. K. (1994a) Monosilicate adsorption by ferrihydrite and goethite at pH 3-6. Soil Sci. 158, 40 – 46.
Hansen H. C. B., Wetche T. P., Raulund-Rasmussen K., and Borggaard O. K. (1994b) Stability constants for silicate adsorbed to ferrihydrite.
Clay Miner. 29, 341–350.
Hazen R. M. and Finger L. W. (1989) High-pressure crystal chemistry of andradite and pyrope: Revised procedures for high-temperature diffraction experiments. Am. Miner. 74, 353–359.
Ildefonse P., Cabaret D., Sainctavit P., Calas G., Flank A. M., and Lagarde P. (1998) Aluminium X-ray absorption near edge structure in model compounds and Earth’s surface minerals. Phys. Chem.
Miner. 25, 112–121.
Iler R. K. (1979) Chemistry of Silica—Solubility, Polymerisation,
Col-loid and Surface Properties and Biochemistry. John Wiley, New
York.
Jolivet J.-P., Henry M., and Livage J. (1994) De la Solution a` l’Oxyde. InterEditions and CNRS Editions, Paris, France.
Konhauser K. O. and Ferris F. G. (1996) Diversity of iron and silica precipitation by microbial mats in hydrothermal water, Iceland: Implications for Precambrian iron formations. Geology 24, 323–326. Koroleff F. (1976) Determination of silicon. In Methods of Seawater
Analysis. (ed. K. Grassnoff). Springer-Verlag, Berlin, Germany.
Lind M. D. (1970) Refinement of the crystal structure of iron oxychlo-ride. Acta Cryst. B26, 1058 –1062.
Lindqvist-Reis P., Munoz-Paez A., Diaz-Moreno S., Pattanail S., Pars-son I., and Sandstom M. (1998) The structure of the hydrated Ga(III), In(III) and Cr(III) ions in aqueous solutions. A large angle X-ray scattering and EXAFS study. Inorg. Chem. 37, 6675– 6683. Manceau A. (1995) The mechanism of anion adsorption on iron oxides:
Evidence for the bonding of arsenate tetrahedra on free Fe(O,OH)6 edges. Geochim. Cosmochim. Acta 59, 3647–3653.
Manceau A. and Combes J. M. (1988) Structure of Mn and Fe oxides and oxyhydroxides: A topological approach by EXAFS. Phys. Chem.
Miner. 15, 283–295.
Manceau A. and Charlet L. (1994) The mechanism of selenate adsorp-tion on goethite and hydrous ferric oxide. J. Colloid Interface Sci. 168, 87–93.
Manceau A., Ildefonse P., Hazemann J. L., Flank A. M., and Gallup D. (1995) Crystal chemistry of hydrous iron silicate scale deposits at the Salton Sea geothermal field. Clays Clay Miner. 43, 304 –317. Manceau A., Chateigner D., and Gates W. P. (1998) Polarized EXAFS,
distance-valence least-squares modeling (DVLS), and quantitative texture analysis approaches to the structural refinment of Garfield nontronite. Phys. Chem. Miner. 25, 347–365.