HAL Id: inserm-00140915
https://www.hal.inserm.fr/inserm-00140915
Submitted on 10 Apr 2007
HAL is a multi-disciplinary open access
archive for the deposit and dissemination of sci-entific research documents, whether they are pub-lished or not. The documents may come from teaching and research institutions in France or abroad, or from public or private research centers.
L’archive ouverte pluridisciplinaire HAL, est destinée au dépôt et à la diffusion de documents scientifiques de niveau recherche, publiés ou non, émanant des établissements d’enseignement et de recherche français ou étrangers, des laboratoires publics ou privés.
Molecular signature of recent thymic selection events on
effector and regulatory CD4+ T lymphocytes.
Paola Romagnoli, Denis Hudrisier, Joost van Meerwijk
To cite this version:
Paola Romagnoli, Denis Hudrisier, Joost van Meerwijk. Molecular signature of recent thymic selec-tion events on effector and regulatory CD4+ T lymphocytes.. Journal of Immunology, Publisher : Baltimore : Williams & Wilkins, c1950-. Latest Publisher : Bethesda, MD : American Association of Immunologists, 2005, 175 (9), pp.5751-8. �inserm-00140915�
Molecular signature of recent thymic selection events on effector and
regulatory CD4
+T lymphocytes
1Running title: Thymic selection of effector and regulatory CD4
+T lymphocytes
Paola Romagnoli*
, Denis Hudrisier*,
†, and Joost P.M. van Meerwijk*,
†,
‡
*
Institut National de la Santé et de la Recherche Médicale (INSERM) U563, Centre de Physiopathologie Toulouse Purpan (CPTP), BP 3028, 31024 Toulouse Cedex 3, France,
†University Toulouse III, Toulouse, France, ‡Institut Universitaire de France
Corresponding author: Paola Romagnoli, INSERM U563, BP 3028, 31024 Toulouse Cedex 3, France. Phone: + 33 562 748381. FAX: + 33 562 748384. E-mail: [email protected]
Keywords: T cells, Cell differentiation, Thymus, Repertoire development, Tolerance /Suppression /Anergy
HAL author manuscript inserm-00140915, version 1
HAL author manuscript
J Immunol 01/11/2005; 175(9): 5751-8
This is an author-produced version of a manuscript accepted for publication in The Journal of Immunology (The JI). The American Association of Immunologists, Inc. (AAI), publisher of The JI, holds the copyright to this manuscript. This manuscript has not yet been
copyedited or subjected to editorial proofreading by The JI; hence it may differ from the final version published in The JI (online and in print). AAI (The JI) is not liable for errors or omissions in this author-produced version of the manuscript or in any version derived from it by the United States National Institutes of Health or any other third party. The final, citable version of record can be found at www.jimmunol.org
Abstract
Natural CD4+
CD25+
regulatory T lymphocytes are key protagonists in induction and maintenance of peripheral T cell tolerance. Their thymic origin and biased repertoire continue to raise important questions on the signals that mediate their development. We validated analysis of MHC class II-capture by developing thymocytes from thymic stroma as a tool to study quantitative and qualitative aspects of the cellular interactions involved in thymic T cell development, and used it to analyze regulatory T cell differentiation in wild type mice. Our data indicate that antigen-presenting cells of bone-marrow origin, but surprisingly and importantly not thymic epithelial cells, induce significant negative selection among the very autoreactive regulatory T cell precursors. This fundamental difference between thymic development of regulatory and effector T lymphocytes leads to development of a regulatory T cell repertoire enriched in cells specific for a selected subpopulation of self-antigens, i.e. those specifically expressed by thymic epithelial cells.
Introduction
Thymic deletion and anergy induction play an essential role in tolerizing the developing T lymphocytes repertoire to self-antigens. Some potentially autoreactive T lymphocytes, however, escape to the periphery where they are kept under control by multiple mechanisms, e.g. induction
of anergy, deletion, and suppression by regulatory T cells (Treg). The best-characterized Treg
population is composed of CD4+
CD25+
T lymphocytes (1, 2). CD4+
CD25+
Treg have been shown
not only to prevent autoimmunity (3-5), but also to mediate transplantation tolerance (6-9), to suppress maternal immune aggression against the fetus (10), and to regulate immunity to viral and parasite infections (11, 12). Their critical role in the generation and maintenance of peripheral tolerance renders them ideal candidates for cell therapy in autoimmunity and transplantation and has sparked interest in how these cells develop. Although recent reports
suggest that CD4+
CD25+
lymphocytes can also differentiate in the periphery (13-16), probably the
majority of CD4+
CD25+
Treg is generated in the thymus from CD4
-CD8
precursors (17). In the
thymus, CD4+CD25+ T
reg appear to be positively selected by cortical epithelial cells (as are
conventional effector CD4+
lymphocytes) (18), and have been reported to be susceptible to
deletion (18-20). The TCR-ligand interaction involved in CD4+
CD25+
Treg differentiation has been
postulated to be of relative high affinity, to allow peripheral re-activation by self-antigen.
Consistent with this hypothesis, increased percentages of CD4+
CD25+
Treg have been found in
different TCR transgenic mice expressing agonist ligand (21-24). However, it has recently been shown that in mice doubly transgenic for another TCR/ligand pair, agonist ligand does not
promote CD4+
CD25+
Treg differentiation. Rather, the authors concluded that Treg are more resistant
to deletion than are conventional CD4+
thymocytes (25). Combined, these data indicate that the
nature of the ligand involved in positive selection of Treg remains unknown and that negative
selection of Treg precursors remains incompletely understood.
Several years ago, it was shown that mouse T cells do not express I-A determinants (26, 27) but that developing murine thymocytes acquire MHC class II molecules from the thymic microenvironment (28). Transfer of APC-determinants to T cells is a process that has recently been investigated in detail (reviewed in ref. (29) and has been called trogocytosis (30). This process may be involved in T-cell affinity maturation (31) and immunoregulation (32, 33). T cells are known to capture membrane fragments from APC (34), thus acquiring a variety of surface molecules (35). Trogocytosis requires activation of the T cell, but not only the MHC/peptide complexes directly interacting with the TCR are transferred. Thus, in F1 animals, developing T cells acquire MHC class II molecules of both haplotypes (28). However, in chimeric thymi thymocytes acquire mainly one type of MHC class II (36). Combined, these data show that MHC class II molecules are acquired only from the stromal cells that are involved in the activation of the thymocyte. It has been shown that the level of MHC and membrane capture is proportional to the dose of peptide presented by the APC and that it reflects T cell reactivity against APC (34, 35, 37). Therefore, we reasoned that analysis of MHC class II display by different thymocyte subpopulations should shed light on the nature of the cellular interactions
involved in the selection of CD25
and CD25+
CD4SP thymocytes. We here report how this
approach allowed us to follow the evolution of the Treg-repertoire during the distinct stages of its
development, and to evaluate the contribution of the different thymic cellular compartments in this process.
Materials and Methods
Mice
C57Bl/6, DBA/2, BALB/c and DO11.10 TCR transgenic BALB/c mice (38) mice were purchased from the Centre de Recherche et d’Elevage Janvier (Le Genest St. Isle, France).
C57Bl/6 mice deficient in β2-microglobulin (39), IAβ
b
(40) and TCRα (41) were obtained from the Centre de Développement des Techniques Avancées-Centre National de la Recherche Scientifique (Orléans, France All experiments involving animals were performed in compliance with the relevant laws and institutional guidelines (Regional approval N° 31-13).
Antibodies
The following antibodies (abs) and secondary reagents were used for phenotypic analysis: FITC, PE and APC-labeled anti-CD4 (GK1.5), FITC and APC-labeled anti-CD8 (53.6.7), PE-labeled anti-CD25 (PC61), FITC-PE-labeled anti-HSA (M1/69), FITC-PE-labeled anti-TCR (H57), FITC-labeled anti-CD69 (H1.2F3), FITC-labeled anti-CD11c (N418), FITC-labeled anti B220 (RA3-6B2), PE-Cy5.5-labeled Streptavidin (eBioscience, San Diego, CA); FITC-labeled
anti-CD44 (IM7), biotin-labeled anti-I-Aβ
b
(AF6-120.1), biotin-labeled anti-Ly-51 (6C3/BP-1), MTS10, FITC-labeled anti-Vβ3 (KJ25), anti-Vβ4 (KT4), anti-Vβ6 (RR4-7), anti-Vβ8 (MR5-2), anti-Vβ12 (MR11-1), anti-Vβ14 (14-2) TCR and biotin-labeled isotype-matched controls (BD PharMingen, Heidelberg, Germany), biotin-labeled anti-I-A/I-E (M5/114).
Flow cytometry
Thymi and lymph nodes were homogenized, washed once in medium, and resuspended in 2.4G2 (anti-FcγR mAb, (42)) hybridoma supernatant. After an incubation of 30 min on ice, saturating concentrations of abs were added. 20 minutes later, cells were washed three times in
PBS, 2.5% FCS and 0.02% NaN3 and incubated with the appropriate secondary reagent. Labeled cells were analyzed using a FACSCalibur and CellQuest software (BD Biosciences, San Jose, CA). Doublets and dead cells were excluded using appropriate FSC/SSC gates.
In vitro MHC class II decay studies
Thymocytes depleted of CD8+
cells using anti-CD8 mAb (31.M, (43)) and complement (Saxon Europe, Suffolk, U.K.) were cultured in RPMI supplemented with 10% fetal calf serum, 1mM non essential amino acids, 1mM sodium pyruvate, 1mM HEPES, and antibiotics. At different
time points cells were stained with anti-CD4, anti-CD8, anti-CD25 and anti-IAb
mAbs.
Bone marrow chimeras
Irradiation bone marrow chimeras were generated by lethally irradiating (8.5 Gy gamma)
C57Bl/6 hosts using a 137
Cs source (7 Gy/min). The next day, irradiated mice were reconstituted
by i.v. injection of 10x106
bone marrow cells depleted of T cells using anti-Thy 1 mAb (AT83, (44)) and complement (Saxon Europe, Suffolk, U.K.). Chimeras were kept on antibiotic containing water (0.2% Bactrim, Roche, Basel, Switzerland) for the complete duration of the experiment (4 weeks).
Statistical analysis
The relative MHC class II expression was calculated as follows: MFI of I-A ÷ MFI of isotype matched control of all the thymic and lymph node subpopulations analyzed. Statistically significant differences between subpopulations were assessed using Student’s t test and are indicated as: * p<0.05; ** p<0.01; *** p<0.001, **** p<0.0001.
Results
Thymocytes capture MHC class II molecules from the thymic microenvironment.
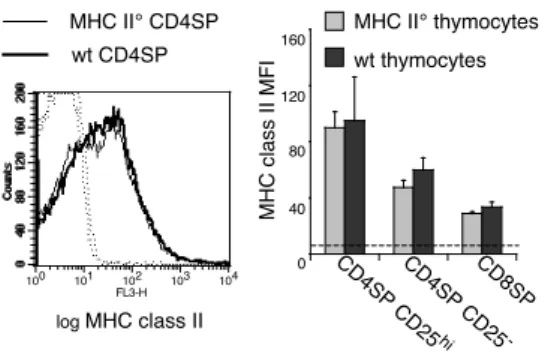
It has previously been reported that thymocytes do not express endogenous MHC class II molecules but that they can acquire it from the thymic environment (26-28). We verified these findings in mixed bone marrow chimeras generated by lethally irradiating wild type (wt) C57BL/6 animals and reconstituting them with a mixture of MHC class II deficient (Thy1.2) and wt (Thy1.1) bone-marrow (MHC II°+wt→wt). We used mixed bone marrow chimeras to allow developing thymocytes to acquire MHC class II from the radioresistant and radiosensitive cellular elements normally involved in thymic selection. In MHC II°+wt→wt chimeras, CD4SP
CD25high
, CD4SP CD25
and CD8SP thymocytes generated from MHC II° vs. wt precursors harbored comparable amounts of I-A, confirming that these molecules are acquired from the thymic microenvironment and not expressed endogenously (Fig. 1).
MHC class II levels on thymocytes vary according to developmental stage and lineage.
We next analyzed if the level of MHC class II found on the surface of distinct thymocyte subsets varied during development. As shown in figures 2A and 2B, we found that the percentage of thymocytes displaying acquired MHC class II molecules increased during differentiation of DP to SP cells. We reproducibly observed a bimodal distribution of MHC class II display, potentially reflecting interaction with limited numbers of selecting niches (45). Interestingly, the amount of I-A displayed by all thymocytes increases with development, as shown by the shift of the total I-A curve. Therefore, to compare the amount of I-A captured by the distinct thymic subpopulations we calculated the relative MHC class II display on the entire population (=MFI
I-A ÷ MFI isotype-matched control). I-As shown in figures 2I-A and B, some immature CD4+
CD8+
(“DP”) thymocytes harbor detectable levels of I-A. CD4+
CD8int(ermediate)
thymocytes, which only develop in animals expressing at least one class of MHC and therefore have undergone
TCR-mediated selection events (46, 47), and mature CD4+
CD8
(“CD4SP”) thymocytes carry
significantly more I-A than their DP precursors. Finally, mature CD4
-CD8+
(“CD8SP”) thymocytes display significantly less I-A than CD4SP cells. Therefore, the level of I-A found on thymocytes depends on their developmental stage and lineage.
It has recently been shown that during their interaction with APC, T cells capture membrane fragments, thus conveying a subset of membrane proteins from the presenting cells (34, 35). We therefore tested if, in addition to I-A, other stroma- or APC-specific proteins could be found on the surface of thymocytes. As shown in figure 2A, we only detected very limited amounts of a cortical epithelium specific antigen (6C3/BP-1) on the different populations of thymocytes. Similar results were obtained using antibodies specific for a medullar antigen (MTS10) or for dendritic cells (CD11c) (data not shown).
Upon TCR-engagement with MHC class I or II, DP thymocytes rapidly upregulate CD69
expression (48). A higher percentage of CD69+
DP thymocytes carry I-A than CD69
cells, suggesting that MHC class II acquisition is an activation-mediated process (Fig. 3A). The
absolute level of I-A displayed by I-A+
cells does not change between these two populations (Fig. 1A). To test if MHC class II acquisition is TCR-dependent, we analyzed I-A levels on TCRα-deficient DP thymocytes. As shown in figure 3B, few of these cells harbored limited levels of I-A. These data indicate that MHC class II acquisition by developing T cells heavily depends on TCR-mediated activation. To evaluate if higher avidity interactions result in more MHC class II acquisition during thymocyte development (as previously shown in vitro, (37)), we compared MHC class II display by thymocytes from C57Bl/6 and DBA/2 mice. DBA/2 mice express
endogenous superantigens encoded by mammary tumor viruses 1, 6, 7, 8, 11, and 13. These superantigens are high affinity ligands for Vβ3, Vβ6 and Vβ12, while they do not interact with
Vβ4, Vβ8 and Vβ14. As a consequence, Vβ3+
, Vβ6+
, and Vβ12+
thymocytes are deleted during thymic development. C57BL/6 mice do not present these superantigens (49). Since superantigen
mediated deletion in DBA/2 mice is already visible at the CD4+
CD8int
stage, we analyzed I-A
display by the CD4low
CD8low
(“double dull”) population, which is enriched in cells that have
undergone TCR-ligand interactions (50). Interestingly, superantigen-reactive Vβ3+
, Vβ6+
, and
Vβ12+
double dull thymocytes display higher levels of MHC class II in DBA/2 than in C57BL/6
mice, while Vβ4+
, Vβ8+
and Vβ14+
cells carry comparable levels of I-A (Fig. 3C). MHC class II amounts were analyzed in both strains with the mAb M5/114 previously shown to have similar
affinity for the H-2b
and H-2d
haplotypes (51). These data indicate that the level of I-A acquired during thymocyte development reflects the avidity of the TCR-ligand interaction involved.
We next investigated if thymic negative selection (by induction of anergy or apoptosis) is reflected by a gradual decrease in the acquisition of MHC class II molecules during progression through T cell development. We have not observed any reduction in MHC class II display in
CD4SP vs. CD4+
CD8int
thymocytes. However, CD4SP cells express approximately 1,5-fold
higher levels of TCR than their CD4+
CD8int
precursors (Fig. 4B and C), rendering interpretation of this observation difficult. In contrast, all CD4SP thymocytes express the same high level of TCR. These cells complete their intrathymic differentiation by downmodulating HSA expression
(52). It has been shown that HSAhigh, but not HSAlow thymocytes are sensitive to deletion (53).
We therefore analyzed I-A levels on CD4SP HSAhigh
and HSAlow
thymocytes. As shown in figure
3D, HSAhigh
CD4SP thymocytes display higher I-A levels than HSAlow
cells. These results demonstrate in vivo late negative selection of thymocytes expressing high avidity TCR. To
corroborate these findings, we analyzed MHC class II display on HSAhigh
and HSAlow
CD4SP thymocyes in TCR transgenic mice in which negative selection does not take place. DO11.10
TCR-transgenic CD4SP HSAhigh
and CD4SP HSAlow
thymocytes display comparable amounts of MHC class II molecules (Fig. 3E), supporting our conclusions.
CD25high
thymocyte populations display significantly higher levels of MHC class II than CD25
-cells.
Peripheral CD4SP CD25+
T cells with regulatory function express high levels of CD25 at their
surface and all CD4+
CD25high
T cells express Foxp3 (54, 55). FACS analysis using anti-Foxp3
antibody showed that also in the thymus all CD4+
CD25high
cells express Foxp3 (PR, data not shown). The majority of T cells expressing intermediate levels of CD25 do not have immunomodulatory capacity, do not express Foxp3, and (at least in the periphery) do not appear
to have the potential to become Foxp3 expressing CD25high
cells (54, 55). We therefore limited
our analysis to CD25high
thymocytes. This population is readily detectable in the thymus (Fig.
4A). Distinguishable regulatory TCR+
CD25high
T cell-precursors start to appear in the CD4+
CD8int
population (24, 55). We therefore analyzed MHC class II levels on CD25high
regulatory
thymocyte-precursors at the intermediate and SP stage and compared them to those on CD25
-cells with equivalent CD4/CD8 phenotypes. Interestingly, CD4+
CD8int
CD25high
cells display
significantly higher levels of MHC class II than CD4+
CD8int
CD25
thymocytes (Figs. 4A and B).
At the SP stage this level decreases, but still remains significantly higher than on CD25
cells (Figs. 4A and B). CD4+ CD8int and CD4SP, CD25 and CD25high
cells do not express identical TCR-levels (Fig. 4C
and Fig. 4B, lower panel). We observed that CD25
CD4+
CD8int
cells expressed lower
levels than CD25high
cells. CD25
CD4SP cells expressed approximately 1,5-fold higher
TCR-levels than CD25high
cells. CD25high
CD4+
CD8int
and CD4SP cells expressed similar TCR-levels. These differences in TCR-levels might contribute somewhat to the differences in MHC class II
capture by CD4+
CD8int
CD25
and CD25high
thymocytes we observed. In contrast, they can only
emphasize the differences in MHC class II-capture by CD4SP CD25
and CD25high
cells.
Higher levels of I-A on CD4+
CD25high
cells could result from a longer half life of these
molecules on the cell surface of CD25high
or from increased capture. To distinguish between these
two possibilities, we analyzed the kinetics of MHC class II decay on CD25high
cells cultured in the
absence of APC. As shown in figure 4D, I-A on CD4+
CD25high
and CD4+
CD25-
thymocytes
decays with similar kinetics. Taken together, these results indicate that TCR+
CD25high
thymocytes
capture significantly more MHC class II molecules than CD25-
cells. Furthermore, these data show that the presence of captured MHC class II at the surface of thymocytes is transient and that the in vivo I-A display we observed requires continuous interaction with stromal thymic cells (56). Moreover, the level of MHC class II display reflects avidity of recent interactions with thymic stromal cells.
MHC class II harbored by thymocytes is acquired from thymic epithelium as well as from cells of hematopoietic origin.
To evaluate if the variation in MHC class II levels found between CD25
and CD25high
cells is due to differences in acquisition from (radioresistant) thymic epithelium and/or from (radiosensitive) antigen-presenting cells of hematopoietic origin (APC), we next generated bone-marrow chimeras by lethally irradiating wild type C57BL/6 animals and reconstituting them with MHC class II deficient bone-marrow (MHC II°→wt). DP thymocytes from MHC II°→wt
animals harbored I-A levels comparable to those on DP thymocytes isolated from control wt→wt chimeras, indicating that at this developmental stage thymocytes mainly interact with radioresistant thymic (cortical) epithelium (Figs. 5A and B). I-A levels on the more mature
CD4+
CD8int
and CD4SP thymic populations were significantly lower in MHC II°→wt than in wt→wt chimeras (Figs. 5A and B). These results indicate that a significant portion of the MHC class II found on more mature thymocytes is acquired from APC. Therefore, levels of MHC class II displayed by thymocyte-populations developing in the different chimeras cannot be compared.
Because of negative selection, fully mature HSAlow
CD4SP thymocytes harbor lower levels of
MHC class II than their HSAhigh precursors (that express identical levels of TCR, Figs. 3D and E).
To evaluate the contribution of epithelial cells in this negative selection, we analyzed I-A levels
on HSAhigh
and HSAlow
CD4SP thymocytes from MHC II°→wt chimeras. As shown in figure 5C,
despite absence of negative selection by APC in these chimeras, HSAlow
cells displayed
significantly less I-A than their HSAhigh precursors. This result is consistent with the known role
of medullary epithelial cells in anergy induction and deletion of autoreactive cells (57-59).
CD25high
regulatory T cell-precursors are negatively selected by APC but not by thymic epithelial cells
We then analyzed the contribution of epithelial cells and APC to negative selection of CD25high
thymocytes. Since all CD4+
CD25high
thymocytes display a mature phenotype, expressing low levels of HSA (ref. 17, and data not shown), the two last identifiable stages of Treg development
are the CD4+CD8int and CD4+CD8- stages. Importantly, CD25high CD4+CD8int and CD4+CD8- cells
express identical TCR-levels (Fig. 4C). We therefore analyzed MHC class II display by these two
CD25high
thymocyte subsets (Fig. 5D). In MHC II°→wt chimeras, CD25high
CD4SP thymocytes
and their CD4+
CD8int
precursors harbored similar levels of MHC class II. This result indicates that thymic epithelial cells do not induce significant negative selection of regulatory T cell
precursors. In contrast, in wt→wt chimeras, in which APC express MHC class II, CD25high
CD4SP thymocytes display lower levels of MHC class II than CD4+
CD8int
(Fig. 5D). Combined, these data show that regulatory T cell precursors are sensitive to negative selection induced by APC.
To corroborate this conclusion we compared MHC class II acquisition by fully mature CD25
-and CD25high
thymocytes from thymic epithelium in MHC II° → wt chimeras. Fully mature
CD4SP CD25high
thymocytes (that are all HSAlow
) acquired significantly more MHC class II from
thymic epithelium than fully mature CD4SP HSAlow
(mainly CD25
-) cells (compare hatched bars in Figs. 5C and D, p<0.01).
Peripheral CD4+
CD25high
regulatory T lymphocytes display more I-A than CD4+
CD25
cells. Peripheral T lymphocytes from TCR transgenic mice have previously been shown to display MHC class II molecules (32). To determine if this was also detectable in wildtype mice, we
analyzed I-A levels on CD25high
and CD25
CD4+
T lymphocytes isolated from lymph nodes.
CD4+
CD25high
lymphocytes harbor significantly higher levels of MHC class II than CD4+
CD25
-cells (Fig. 6A).
The lower I-A level observed on peripheral T lymphocytes as compared to thymocytes (compare Figs. 6A and 4A/B) could be due either to TCR tuning (60) or to less frequent encounters with antigen (61). To distinguish between these two possibilities, we analyzed the
MHC class II levels displayed by activated and resting CD4+
lymph node cells. As shown in
figure 6B, activated CD69high T lymphocytes displayed higher MHC class II levels than the
corresponding resting populations (CD69low
), indicating that the relatively low I-A level on
peripheral T cells is mainly due to rare antigen-encounter. Finally, both resting (CD69low
) and
recently activated (CD69high
) CD25high
cells carry significantly higher amounts of I-A than
corresponding CD25
lymphocytes (Fig. 6B, right). Furthermore, they support the view that the
Treg repertoire, enriched during thymic selection in cells bearing TCR with high avidity for
self-ligand, is maintained in the periphery.
Discussion
In this report we show that the level of MHC class II display by developing thymocytes correlates with the avidity of their recent interactions with thymic stromal cells, and can therefore be used to monitor quantitative and qualitative aspects of cellular interactions involved in T cell development. Using this molecular signature of thymic selection events, we show that precursors
of CD25- effector and CD25high regulatory T lymphocytes are both efficiently negatively selected
by APC of bone-marrow origin. In contrast, while thymic epithelial cells efficiently negatively select effector T cell precursors, they only marginally (if at all) induce negative selection of regulatory T cell precursors.
In vitro capture of MHC II molecules by T cell clones is an activation-mediated process (34,
35, 37). In the thymus, a larger fraction of newly positively selected DP CD69+
than CD69
cells carry MHC class II. Moreover, only few DP thymocytes from TCRα-deficient mice display I-A on their surface and in significantly less quantity than wt cells. Taken together, these data indicate that also MHC class II acquisition by developing thymocytes is predominantly a TCR-mediated activation-dependent process. Since acquired MHC class II was rapidly lost in absence of MHC class II expressing APC, the level of MHC class II displayed by thymocytes reflects the level of active acquisition of these molecules. Moreover, superantigen-reactive (but not yet deleted) thymocytes acquired higher levels of MHC class II, indicating that the avidity of the developing thymocytes for thymic stromal cells determines the level of MHC class II acquisition.
MHC class II acquisition depends on the developmental stage and lineage of thymocytes, with CD4SP T cells harboring significantly higher amounts of MHC class II than DP and CD8SP cells. On the latter cells, I-A has probably been “passively” acquired via trogocytosis during cellular contacts mediated by TCR/MHC class I interaction. Alternatively, but less likely, it may
be the result of a direct TCR/MHC class II interaction-mediated process, consistently with the observation that class II-restricted CD8 T cells arise in CD4° mice (62-64).
Bone marrow chimeras expressing MHC II/peptide complexes on radioresistant (epithelial) cells but not on radiosensitive (bone-marrow-derived) cells revealed that developing thymocytes can capture MHC class II molecules from both thymic epithelium and bone-marrow derived
APC. CD4+
CD8+
DP thymocytes appear to capture MHC class II exclusively from the thymic
epithelium, while the more mature CD4+
CD8int
and CD4+
CD8
thymocyte-populations acquire I-A from epithelial cells and from I-APC. These results are in agreement with spatial and temporal aspects of thymocyte selection. Based on TCR affinity for self-peptide/MHC complexes, DP thymocytes localized in the cortex can undergo positive selection. Positively selected cells then migrate to the medulla where, via interactions with medullary epithelium and APC of bone-marrow origin, potentially autoreactive cells undergo negative selection.
Previous reports showing that thymocytes derived from F1 into parent (F1→P) bone marrow chimeras mainly carry MHC determinants of host origin (28) are not at odds with our present findings. Thymocytes are positively selected only if their TCR are of sufficiently high affinity for self-ligands expressed by radioresistant cortical epithelial cells (65, 66). Consequently, thymocytes that have been positively selected express TCR specific for host-type MHC, and therefore mainly interact with host type APC and capture host-type MHC determinants in bone marrow chimeras. In line with this, it has also been shown that in MHC haplotype-mosaic stromal environments individual thymocytes preferentially acquire only one of the two MHC determinants (36). Importantly, MHC class II acquisition is not limited to the MHC/peptide complexes with which the thymocyte’s TCR interact. On the other hand, thymocytes will only acquire MHC class II from stromal cells for which they have sufficiently high avidity.
Mature thymic regulatory CD4SP CD25high
cells display higher amounts of MHC class II
molecules than conventional CD4SP CD25-
thymocytes. Since the stability of acquired MHC class II on these two subsets is comparable, the higher expression is due to increased acquisition from thymic stromal cells. As discussed before, the level of MHC class II acquisition reflects the avidity of the developing thymocytes for thymic stroma. Our results therefore indicate that the
normally diverse CD4SP CD25high
regulatory thymocyte population selected on naturally
expressed ligands,has higher avidity for self than CD4SP CD25
cells. The greater avidity of Treg may be caused by higher avidity (despite lower TCR-expression levels) and/or affinity TCR, by differences in expression of adhesion molecules, and/or by higher intrinsic reactivity.
Also immature CD4+
CD8int
CD25high
thymocytes capture much higher amounts of MHC class II
than the corresponding CD25
population. This result is consistent with a potential role for high-affinity ligands in the selection of regulatory T cells, as previously proposed (21-25).
Interestingly, mature CD4SP CD25high
thymocytes acquire significantly less MHC class II molecules than their more immature precursors. This reduction in self-reactivity was mainly due to interactions with bone-marrow derived cells and to a much lower extend (if at all) to interactions with epithelial cells. These observations indicate that a significant part of the regulatory T cell precursors is negatively selected after interaction with APC. In contrast, direct interactions with thymic epithelial cells hardly reduced the self-reactivity (by deletion or anergy-induction) of regulatory T cell precursors. These data are consistent with earlier reports on
induction of CD4+
T cell-mediated dominant tolerance by grafting thymic epithelium (67). Therefore, our data provide an explanation for apparently contradictory reports in the literature showing sensitivity as well as resistance to deletion of thymic regulatory T cell precursors (19, 20, 25). They also show for the first time in one single system and for an unmanipulated
repertoire that regulatory T cell precursors are sensitive to negative selection induced by APC but hardly (if at all) by thymic epithelial cells. Although thymic APC are known to present some medullary epithelium-derived antigens (59), and may therefore delete some tissue-specific
antigen-reactive CD25high
precursors, this is unlikely to be the case for all antigens expressed by mTEC (25, 68). The observation that Treg precursors are sensitive to deletion by APC but not by (m)TEC therefore indicates that the mature Treg repertoire is pruned of cells specific for e.g. household antigens and thus relatively enriched in cells recognizing the tissue-specific antigens expressed by mTEC.
Several reports have documented the important role of MHC molecules in homeostasis of the peripheral pool of T lymphocytes (reviewed by (69). The MHC class II display by peripheral
CD4+
T cells we observed is consistent with such a role. We also document that resting and
activated peripheral regulatory CD4+CD25high T cells display higher levels of MHC class II than
the corresponding CD25
populations. These results support our previous findings indicating that
the Treg repertoire in enriched in autoreactive T cells (19), and more recent data documenting the
role of self-antigen in the peripheral expansion of regulatory T cells (70-72).
In conclusion, using MHC class II-transfer as a tool to analyze the nature of cellular interactions involved in T lymphocyte-selection, we have shown that an autoreactive regulatory T cell repertoire is selected already early during thymic development. Negative selection subsequently significantly prunes this repertoire of cells overly reactive to antigens specifically presented by APC but not by epithelial cells, thus generating a fully mature regulatory T cell population with biased specificity for a subpopulation of autoantigens, among which “tissue-specific” antigens expressed by thymic medullary epithelium (73).
Acknowledgements
The authors thank the staff of the IFR30 animal facility, and in particular Maryline Calise, for expert animal husbandry. We thank Drs. Rob MacDonald, Jean-Charles Guéry, and Etienne Joly for critical reading of the manuscript.
References
1. Sakaguchi, S., N. Sakaguchi, M. Asano, M. Itoh, and M. Toda. 1995. Immunologic
self-tolerance maintained by activated T cells expressing IL-2 receptor alpha-chains (CD25). Breakdown of a single mechanism of self-tolerance causes various autoimmune diseases. J. Immunol. 155:1151-1164.
2. Asano, M., M. Toda, N. Sakaguchi, and S. Sakaguchi. 1996. Autoimmune disease as a
consequence of developmental abnormality of a T cell subpopulation. J. Exp. Med. 184:387-396.
3. Shevach, E. M. 2000. Regulatory T cells in autoimmmunity. Annu. Rev. Immunol.
18:423-449.
4. Sakaguchi, S. 2000. Regulatory T cells: key controllers of immunologic self-tolerance.
Cell 101:455-458.
5. Maloy, K. J., and F. Powrie. 2001. Regulatory T cells in the control of immune pathology.
Nat. Immunol. 2:816-822.
6. Taylor, P. A., C. J. Lees, and B. R. Blazar. 2002. The infusion of ex vivo activated and
expanded CD4(+)CD25(+) immune regulatory cells inhibits graft-versus-host disease lethality. Blood 99:3493-3499.
7. Hoffmann, P., J. Ermann, M. Edinger, C. G. Fathman, and S. Strober. 2002. Donor-type
CD4(+)CD25(+) Regulatory T Cells Suppress Lethal Acute Graft-Versus-Host Disease after Allogeneic Bone Marrow Transplantation. J. Exp. Med. 196:389-399.
8. Cohen, J. L., A. Trenado, D. Vasey, D. Klatzmann, and B. L. Salomon. 2002.
CD4(+)CD25(+) Immunoregulatory T Cells: New Therapeutics for Graft-Versus-Host Disease. J. Exp. Med. 196:401-406.
9. Joffre, O., N. Gorsse, P. Romagnoli, D. Hudrisier, and J. P. van Meerwijk. 2004. Induction of antigen-specific tolerance to bone marrow allografts with CD4+CD25+ T lymphocytes. Blood 103:4216-4221.
10. Aluvihare, V. R., M. Kallikourdis, and A. G. Betz. 2004. Regulatory T cells mediate
maternal tolerance to the fetus. Nat. Immunol. 5:266-271.
11. Suvas, S., U. Kumaraguru, C. D. Pack, S. Lee, and B. T. Rouse. 2003. CD4+CD25+ T
Cells Regulate Virus-specific Primary and Memory CD8+ T Cell Responses. J. Exp. Med. 198:889-901.
12. Belkaid, Y., C. A. Piccirillo, S. Mendez, E. M. Shevach, and D. L. Sacks. 2002.
CD4+CD25+ regulatory T cells control Leishmania major persistence and immunity. Nature 420:502-507.
13. Thorstenson, K. M., and A. Khoruts. 2001. Generation of anergic and potentially
immunoregulatory CD25+CD4 T cells in vivo after induction of peripheral tolerance with intravenous or oral antigen. J. Immunol. 167:188-195.
14. Apostolou, I., and H. Von Boehmer. 2004. In vivo instruction of suppressor commitment
in naive T cells. J. Exp. Med. 199:1401-1408.
15. Curotto de Lafaille, M. A., A. C. Lino, N. Kutchukhidze, and J. J. Lafaille. 2004.
CD25-T cells generate CD25+Foxp3+ regulatory CD25-T cells by peripheral expansion. J. Immunol. 173:7259-7268.
16. Liang, S., P. Alard, Y. Zhao, S. Parnell, S. L. Clark, and M. M. Kosiewicz. 2005.
Conversion of CD4+ CD25- cells into CD4+ CD25+ regulatory T cells in vivo requires B7 costimulation, but not the thymus. J. Exp. Med. 201:127-137.
17. Itoh, M., T. Takahashi, N. Sakaguchi, Y. Kuniyasu, J. Shimizu, F. Otsuka, and S. Sakaguchi. 1999. Thymus and autoimmunity: production of CD25+CD4+ naturally anergic and suppressive T cells as a key function of the thymus in maintaining immunologic self-tolerance. J. Immunol. 162:5317-5326.
18. Bensinger, S. J., A. Bandeira, M. S. Jordan, A. J. Caton, and T. M. Laufer. 2001. Major
Histocompatibility Complex Class II-positive Cortical Epithelium Mediates the Selection of CD4+25+ Immunoregulatory T Cells. J. Exp. Med. 194:427-438.
19. Romagnoli, P., D. Hudrisier, and J. P. M. van Meerwijk. 2002. Preferential recognition of
self-antigens despite normal thymic deletion of CD4+CD25+ regulatory T cells. J. Immunol. 168:1644-1648.
20. Pacholczyk, R., P. Kraj, and L. Ignatowicz. 2002. Peptide specificity of thymic selection
of CD4+CD25+ T cells. J. Immunol. 168:613-620.
21. Kawahata, K., Y. Misaki, M. Yamauchi, S. Tsunekawa, K. Setoguchi, J.-i. Miyazaki, and
K. Yamamoto. 2002. Generation of CD4+CD25+ Regulatory T Cells from Autoreactive T Cells Simultaneously with Their Negative Selection in the Thymus and from
Nonautoreactive T Cells by Endogenous TCR Expression. J. Immunol. 168:4399-4405.
22. Apostolou, I., A. Sarukhan, L. Klein, and H. von Boehmer. 2002. Origin of regulatory T
cells with known specificity for antigen. Nat. Immunol. 3:756-763.
23. Jordan, M. S., M. P. Riley, H. von Boehmer, and A. J. Caton. 2000. Anergy and
suppression regulate CD4(+) T cell responses to a self peptide. Eur. J. Immunol. 30:136-144.
24. Jordan, M. S., A. Boesteanu, A. J. Reed, A. L. Petrone, A. E. Holenbeck, M. A. Lerman, A. Naji, and A. J. Caton. 2001. Thymic selection of CD4+CD25+ regulatory T cells induced by an agonist self-peptide. Nat. Immunol. 2:301-306.
25. van Santen, H. M., C. Benoist, and D. Mathis. 2004. Number of T reg cells that
differentiate does not increase upon encounter of agonist ligand on thymic epithelial cells. J. Exp. Med. 200:1221-1230.
26. Benoist, C., and D. Mathis. 1990. Regulation of major histocompatibility complex class-II
genes: X, Y and other letters of the alphabet. Annu. Rev. Immunol. 8:681-715.
27. Chang, C. H., S. C. Hong, C. C. Hughes, C. A. Janeway, Jr., and R. A. Flavell. 1995.
CIITA activates the expression of MHC class II genes in mouse T cells. Int. Immunol. 7:1515-1518.
28. Sharrow, S. O., B. J. Mathieson, and A. Singer. 1981. Cell surface appearance of
unexpected host MHC determinants on thymocytes from radiation bone marrow chimeras. J. Immunol. 126:1327-1335.
29. Hudrisier, D., and P. Bongrand. 2002. Intercellular transfer of antigen-presenting cell
determinants onto T cells: molecular mechanisms and biological significance. Faseb J. 16:477-486.
30. Joly, E., and D. Hudrisier. 2003. What is trogocytosis and what is its purpose? Nat.
Immunol. 4:815.
31. Kedl, R. M., B. C. Schaefer, J. W. Kappler, and P. Marrack. 2002. T cells down-modulate
peptide-MHC complexes on APCs in vivo. Nat. Immunol. 3:27-32.
32. Tsang, J. Y., J. G. Chai, and R. Lechler. 2003. Antigen presentation by mouse CD4+ T cells involving acquired MHC class II:peptide complexes: another mechanism to limit clonal expansion? Blood 101:2704-2710.
33. Zhang, Z. X., L. Yang, K. J. Young, B. DuTemple, and L. Zhang. 2000. Identification of
a previously unknown antigen-specific regulatory T cell and its mechanism of suppression. Nat. Med. 6:782-789.
34. Hudrisier, D., J. Riond, H. Mazarguil, J. E. Gairin, and E. Joly. 2001. Cutting edge: CTLs
rapidly capture membrane fragments from target cells in a TCR signaling-dependent manner. J. Immunol. 166:3645-3649.
35. Hwang, I., J. F. Huang, H. Kishimoto, A. Brunmark, P. A. Peterson, M. R. Jackson, C. D.
Surh, Z. Cai, and J. Sprent. 2000. T cells can use either T cell receptor or CD28 receptors to absorb and internalize cell surface molecules derived from antigen-presenting cells. J. Exp. Med. 191:1137-1148.
36. Merkenschlager, M. 1996. Tracing interactions of thymocytes with individual stromal cell
partners. Eur. J. Immunol. 26:892-896.
37. Huang, J. F., Y. Yang, H. Sepulveda, W. Shi, I. Hwang, P. A. Peterson, M. R. Jackson, J.
Sprent, and Z. Cai. 1999. TCR-Mediated internalization of peptide-MHC complexes acquired by T cells. Science 286:952-954.
38. Murphy, K. M., A. B. Heimberger, and D. Y. Loh. 1990. Induction by antigen of
intrathymic apoptosis of CD4+CD8+TCRlo thymocytes in vivo. Science 250:1720-1723.
39. Koller, B. H., P. Marrack, J. W. Kappler, and O. Smithies. 1990. Normal development of
mice deficient in ß2M, MHC class I proteins, and CD8+
T cells. Science 248:1227-1230.
40. Cosgrove, D., D. Gray, A. Dierich, J. Kaufman, M. Lemeur, C. Benoist, and D. Mathis. 1991. Mice lacking MHC class II molecules. Cell 66:1051-1066.
41. Philpott, K. L., J. L. Viney, G. Kay, S. Rastan, E. M. Gardiner, S. Chae, A. C. Hayday,
and M. J. Owen. 1992. Lymphoid development in mice congenitally lacking T cell receptor alpha beta-expressing cells. Science 256:1448-1452.
42. Unkeless, J. C. 1979. Characterization of a monoclonal antibody directed against mouse
macrophage and lymphocyte Fc receptors. J. Exp. Med. 150:580-596.
43. Sarmiento, M., D. P. Dialynas, D. W. Lancki, K. A. Wall, M. I. Lorber, M. R. Loken, and
F. W. Fitch. 1982. Cloned T lymphocytes and monoclonal antibodies as probes for cell surface molecules active in T cell-mediated cytolysis. Immunol. Rev. 68:135-169.
44. Sarmiento, M., M. R. Loken, and F. W. Fitch. 1981. Structural differences in cell surface
T25 polypeptides from thymocytes and cloned T cells. Hybridoma 1:13-26.
45. van Meerwijk, J. P., S. Marguerat, and H. R. MacDonald. 1998. Homeostasis limits the
development of mature CD8+ but not CD4+ thymocytes. J. Immunol. 160:2730-2734.
46. Chan, S. H., D. Cosgrove, C. Waltzinger, C. Benoist, and D. Mathis. 1993. Another view
of the selective model of thymocyte selection. Cell 73:225-236.
47. van Meerwijk, J. P. M., E. M. O'Connell, and R. N. Germain. 1995. Evidence for lineage
commitment and initiation of positive selection by thymocytes with intermediate surface phenotypes. J. Immunol. 154:6314-6324.
48. Yokoyama, W. M., F. Koning, P. J. Kehn, G. M. Pereira, G. Stingl, J. E. Coligan, and E.
M. Shevach. 1988. Characterization of a cell surface-expressed disulfide-linked dimer involved in murine T cell activation. J. Immunol. 141:369-376.
49. Luther, S. A., and H. Acha-Orbea. 1997. Mouse mammary tumor virus: immunological interplays between virus and host. Adv. Immunol. 65:139-243.
50. Hogquist, K. A., A. J. Tomlinson, W. C. Kieper, M. A. McGargill, M. C. Hart, S. Naylor,
and S. C. Jameson. 1997. Identification of a naturally occurring ligand for thymic positive selection. Immunity 6:389-399.
51. Bhattacharya, A., M. E. Dorf, and T. A. Springer. 1981. A shared alloantigenic
determinant on Ia antigens encoded by the I-A and I-E subregions: evidence for I region gene duplication. J. Immunol. 127:2488-2495.
52. Ramsdell, F., M. Jenkins, Q. Dinh, and B. J. Fowlkes. 1991. The majority of CD4+
8
-thymocytes are functionally immature. J. Immunol. 147:1779-1785.
53. Kishimoto, H., and J. Sprent. 1997. Negative selection in the thymus includes semimature
T cells. J. Exp. Med. 185:263-271.
54. Setoguchi, R., S. Hori, T. Takahashi, and S. Sakaguchi. 2005. Homeostatic maintenance
of natural Foxp3(+) CD25(+) CD4(+) regulatory T cells by interleukin (IL)-2 and induction of autoimmune disease by IL-2 neutralization. J. Exp. Med. 201:723-735.
55. Fontenot, J. D., J. P. Rasmussen, L. M. Williams, J. L. Dooley, A. G. Farr, and A. Y.
Rudensky. 2005. Regulatory T cell lineage specification by the forkhead transcription factor foxp3. Immunity 22:329-341.
56. Kisielow, P., and A. Miazek. 1995. Positive selection of T cells: rescue from programmed
cell death and differentiation require continual engagement of the T cell receptor. J. Exp. Med. 181:1975-1984.
57. Ramsdell, F., T. Lantz, and B. J. Fowlkes. 1989. A nondeletional mechanism of thymic
self tolerance. Science 246:1038-1041.
58. Klein, L., B. Roettinger, and B. Kyewski. 2001. Sampling of complementing self-antigen pools by thymic stromal cells maximizes the scope of central T cell tolerance. Eur. J. Immunol. 31:2476-2486.
59. Gallegos, A. M., and M. J. Bevan. 2004. Central tolerance to tissue-specific antigens
mediated by direct and indirect antigen presentation. J. Exp. Med. 200:1039-1049.
60. Lucas, B., I. Stefanova, K. Yasutomo, N. Dautigny, and R. N. Germain. 1999. Divergent
changes in the sensitivity of maturing T cells to structurally related ligands underlies formation of a useful T cell repertoire. Immunity 10:367-376.
61. Davey, G. M., S. L. Schober, B. T. Endrizzi, A. K. Dutcher, S. C. Jameson, and K. A.
Hogquist. 1998. Preselection thymocytes are more sensitive to T cell receptor stimulation than mature T cells. J. Exp. Med. 188:1867-1874.
62. Matechak, E. O., N. Killeen, S. M. Hedrick, and B. J. Fowlkes. 1996. MHC class
II-specific T cells can develop in the CD8 lineage when CD4 is absent. Immunity 4:337-347.
63. Tyznik, A. J., J. C. Sun, and M. J. Bevan. 2004. The CD8 Population in CD4-deficient
Mice Is Heavily Contaminated with MHC Class II-restricted T Cells. J. Exp. Med. 199:559-565.
64. Lucas, B., F. Vasseur, and C. Penit. 1995. Stochastic coreceptor shut-off is restricted to
the CD4 lineage maturation pathway. J. Exp. Med. 181:1623-1633.
65. Laufer, T. M., J. DeKoning, J. S. Markowitz, D. Lo, and L. H. Glimcher. 1996.
Unopposed positive selection and autoreactivity in mice expressing class II MHC only on thymic cortex. Nature 383:81-85.
66. Capone, M., P. Romagnoli, F. Beermann, H. R. MacDonald, and J. P. M. van Meerwijk.
2001. Dissociation of thymic positive and negative selection in transgenic mice
expressing major histocompatibility complex class I molecules exclusively on thymic cortical epithelial cells. Blood 97:1336-1342.
67. Le Douarin, N., C. Corbel, A. Bandeira, V. Thomas-Vaslin, Y. Modigliani, A. Coutinho,
and J. Salaun. 1996. Evidence for a thymus-dependent form of tolerance that is not based on elimination or anergy of reactive T cells. Immunol. Rev. 149:35-53.
68. Oukka, M., E. Colucci-Guyon, P. L. Tran, M. Cohen-Tannoudji, C. Babinet, V. Lotteau,
and K. Kosmatopoulos. 1996. CD4 T cell tolerance to nuclear proteins induced by medullary thymic epithelium. Immunity 4:545-553.
69. Freitas, A. A., and B. Rocha. 1999. Peripheral T cell survival. Curr. Opin. Immunol.
11:152-156.
70. Fisson, S., G. Darrasse-Jeze, E. Litvinova, F. Septier, D. Klatzmann, R. Liblau, and B. L.
Salomon. 2003. Continuous activation of autoreactive CD4+ CD25+ regulatory T cells in the steady state. J. Exp. Med. 198:737-746.
71. Walker, L. S. K., A. Chodos, M. Eggena, H. Dooms, and A. K. Abbas. 2003.
Antigen-dependent Proliferation of CD4+ CD25+ Regulatory T Cells In Vivo. J. Exp. Med. 198:249-258
72. Hsieh, C. S., Y. Liang, A. J. Tyznik, S. G. Self, D. Liggitt, and A. Y. Rudensky. 2004.
Recognition of the Peripheral Self by Naturally Arising CD25(+) CD4(+) T Cell Receptors. Immunity 21:267-277.
73. Derbinski, J., A. Schulte, B. Kyewski, and L. Klein. 2001. Promiscuous gene expression
in medullary thymic epithelial cells mirrors the peripheral self. Nat. Immunol. 2:1032-1039.
Footnotes: 1This work was supported by a grant from the European Community awarded to the EuroThymaide consortium (contract # LSHB-CT-2003-503410).
Abbreviations used in this paper: Treg, regulatory T lymphocyte; MFI, mean fluorescence
intensity; DP, double positive; SP, single positive; mTEC, medullary thymic epithelial cell.
Legends to the figures
Figure 1. Thymocytes acquire MHC class II molecules from the thymic environment.
Lethally irradiated C57Bl/6 hosts were reconstituted with a mixture of bone marrow cells from
C57Bl/6 (Thy1.1+
) and C57BL/6 MHC II° (Thy1.2+
) mice at a 1:1 ratio. Four weeks later, thymocytes were analyzed by four-color flow-cytometry using anti-CD4, anti-CD8, anti-CD25
and anti-IAb
. To analyze I-A surface levels on Thy1.1+
CD4SP cells, FITC-labeled anti-CD11c, B220 mAbs and FITC-labeled Thy1.2 mAbs were used in addition to FITC-labeled
anti-CD8 in the exclusion gate. To analyze I-A surface levels on Thy1.2+
CD4SP cells, FITC-labeled anti-Thy1.1 mAb was used in the antibody mixture. A reciprocal staining was performed to analyze I-A surface levels on CD8SP thymocytes. Solid lines indicate I-A staining, dotted lines isotype-matched controls. Bar graphs represent relative I-A expression level on different thymocyte subsets. Error bars indicate SD, n=4 from 2 independent experiments.
Figure 2. Displayed MHC class II levels depend on maturation-stage and CD4/CD8 lineage A: Total thymocytes from C57Bl/6 mice were analyzed by four-color flow cytometry using
anti-CD4, anti-CD8, anti-CD25 and anti-I-Ab
(bold line) or isotype-matched control (thin line) abs. To analyze I-A surface levels, FITC-labeled anti-CD11c and anti-B220 mAbs were used in the exclusion gate as described in figure 1. Distinct thymocyte subsets were electronically gated based on CD4/CD8 expression and the respective I-A and 6C3/BP-1 levels were plotted as histograms. B: Bar graphs representing % of I-A positive cells in distinct thymocyte subpopulations (upper panel) and relative I-A expression level on different thymocyte subsets from C57Bl/6 mice (lower panel). All graphic representations of I-A levels were compiled from four independent experiments. Error bars indicate SD, n=10 mice.
Figure 3. MHC class II acquisition is an avidity-dependent, TCR- activation mediated process FACS-histograms and bar graphs represent relative I-A expression level on different thymocyte subsets from the following mice A: C57Bl/6 mice: DP thymocytes were electronically gated according to their CD69 expression level. B: wt and TCRα° C57BL/6 mice: DP thymocytes, in the histogram the two dotted lines depict the isotype matched controls. C: C57Bl/6 and DBA/2
mice: CD4lowCD8low thymocytes were electronically gated. The bar graph (upper panel) represents
relative MHC class II display on double dull thymocytes expressing different TCR Vβ, in bold Vβ reactive to Mmtv-encoded superantigens presented in DBA/2 mice, in normal characters the
ones that are not. Lower panels: examples of FACS-histograms of I-A display by Vβ12+ and
Vβ8+
thymocytes. D: C57Bl/6 mice: Thymocytes were electronically gated as indicated and I-A display analyzed by FACS. Lower panel: FACS histograms of CD4SP thymocytes gated on HSA expression as indicated. Upper panel: Relative I-A display by the distinct thymocyte subpopulations. E: DO11.10 TCR transgenic mice (analyzed as in D). In panels A, B, and D the anti-MHC class II mAb used was AF6-120.1, M5/114 in panels C and E. In all graphic representations error bars indicate SD, n=4 mice.
Figure 4. CD4+
CD25high
Regulatory T cell precursors display higher levels of I-A on their surface
than CD4+
CD25
cells.
A: Total thymocytes from C57Bl/6 mice were analyzed by four-color flow cytometry using
anti-CD4, anti-CD8, anti-CD25 and anti-I-Ab
mAbs, and distinct thymocyte subsets were electronically gated as described in the legend to figure 2. B: Bar graphs representing relative I-A
and TCRβ levels on CD4+
CD8int
and CD4+
CD8
thymocytes, electronically gated based on CD25
expression. Error bars indicate SD, n=8. C: C D 4+
CD8int
and CD4+
CD8-
thymocytes were
electronically gated based on CD25 expression and the respective TCR levels were displayed as
histograms. Thick lines indicate TCR expression by CD4+
CD8int
cells, thin lines that of
CD4+
CD8-
cells. D: CD8-depleted thymocytes were cultured in vitro and, at different time points,
I-A levels on CD25
and CD25high
CD4SP thymocytes were analyzed. Error bars indicate SD, n=3 mice. Similar results were obtained in two independent experiments.
Figure 5. Regulatory T cell precursors are negatively selected by APC but not by thymic epithelial cells
A: Lethally irradiated C57Bl/6 hosts were reconstituted with bone marrow cells from either MHC II° or wt C57Bl/6 mice. I-A levels on distinct thymocyte subsets were analyzed by flow-cytometry as described in the legend to figure 2. B/C/D: I-A levels on distinct thymocyte subsets from MHC II°→wt and wt→wt chimeras are displayed in bar graphs. Error bars indicate SD, n=5. Results from one same experiment are shown; two more independent experiments gave similar results.
Figure 6. Resting and activated peripheral regulatory CD4+
CD25high
lymphocytes display higher
I-A levels than CD4+
CD25
cells.
A: I-A surface levels were analyzed on CD25
and CD25high CD4+ CD8 -CD11c -B220 lymphocytes isolated from lymph nodes of C57Bl/6 mice. The data are displayed as FACS-histograms (Left panel) and data from multiple experiments shown as bar graphs (middle panel). Right panel:
MHC class II expression by lymph node B220+
cells. error bars represent SD, n=5). B: I-A levels
on resting (CD69low
) and recently activated (CD69hi
) CD4+
CD25high
and CD4+
CD25
T
lymphocyte subsets from lymph nodes of C57Bl/6 mice. Right panel: Relative I-A expression levels are depicted for 5 individual mice, indicated with distinctive symbols.
Figure 1 MHC II° CD4SP wt CD4SP log MHC class II 100 101 102 103 104 FL3-H 0 40 80 120 160 CD25+ CD25- CD8 CD8SP CD4SP CD25 hi CD4SP CD25 -MHC II° thymocytes wt thymocytes 160 120 80 40 0 MHC class II MFI
log CD4 log CD8 R2 R8 R9 SP DP INT SP 6C3/BP-1 DP INT CD4 SP Cell counts
log Cell counts MHC class II
100 101 102FL3-H 103 104 CD8 SP A B Relative MHC class II 0 4 8 12 16 20 DP CD4INT CD4SP CD8 ** ** ** DP CD4 + CD8 int CD4SPCD8SP 20 8 16 4 0 12 Figure 2 MHC class II 0 10 20 30 40 50 60 DP INT SP CD4 SP CD8 % of I-A + cells ** ** *** MFI 9,8 MFI 19 MFI 26 MFI 2,8 MFI 4,5 MFI 4,6 10 30 20 40 50 60
100 101 102 103 104 FL3-H 100 101 102 103 104 FL3-H 100 101 102 103 104 FL3-H Figure 3 log CD8 log CD4 TCRα° wt log MHC class II 100 101 102 103 104 FL3-H wt TCRα° MHC class II MFI 0 4 8 12 16 wt TCRa° ** 16 8 12 4 0 A B % MHC class II pos 0 10 20 30 40 CD69+ CD69-40 10 20 30 CD69+CD69 -0 ** wt TCRα° 0 20 40 60 80 100 vb3 vb6 vb12 vb4 vb8 vb14 V β3Vβ6Vβ12 Vβ4Vβ8 DBA/2 B6 ** * ** 100 80 60 40 20 0 Relative MHC class II V β14 HSAhi HSAlow HSAhi B6 b2m° 0 10 20 30 DP CD4INT CD4SP DP 0 30 20 10 ** Relative MHC class II 0 5 10 15 20 DP CD4INT CD4SP 15 DP 20 HSAlow HSAhi Relative MHC class II 15 20 10 0 5 HSAlow HSAhi CD4SP CD4 + CD8 int CD4 + CD8 int CD4SP C D 100 101 102 103 104 FL3-H Vβ12 Vβ8 DBA/2 B6 HSAlow HSAhi E 100 104 FL3-H CD69 -CD69+ log MHC class II
100 101 102 103 104 FL3-H 0 25 50 75 100 125 150 1 2 Cell counts log CD25 neg hi CD4+CD8int CD4+CD8 -Relative MHC class II A B D Figure 4 0 20 40 60 80 int sp CD25hi CD25 -** CD4 + CD8 -80 0 60 40 20 ** log TCR log TCR SP INT SP INT CD25 -CD25hi 0 30 60 90 120 150 180 0 5 10 15 20 CD4+CD8-CD25hi CD4+CD8-CD25 -20 15 10 5 0 180 150 120 90 60 30 0 hours at 37° MHC class II MFI SP INT log CD4 log CD8 C log CD25 hi neg CD25 -MFI 18 CD25hi MFI 114 CD25 -MFI 24 CD25hi MFI 38 150 100 50 0 CD4 + CD8 int * **** Relative TCR β CD4 + CD8 int CD4 +CD8 -100 101 102 103 104 FL3-H log MHC class II log MHC class II
0 40 80 120
hsa hi hsa low 0
40 80 120
hsa hi hsa low
wt wt MHC II° wt log MHC class II cell counts DP INT SP wt A Figure 5 C MHC II° wt wt wt MFI MHC class II CD4SP CD4SP ** **** 0 120 40 80 0 120 40 80
HSAhiHSAlow HSAhiHSAlow
MHC II° wt wt B D MHCII°-wt 0 50 100 150 200 CD25+INT CD25+SP wt-wt 0 50 100 150 200 CD25+INT CD25+SP CD25hi INT SP INTSP CD25hi 100 0 150 50 200 100 0 150 50 200 ** * 0 25 50 75 100 DP CD25-INT CD25-SP MFI MHC class II CD4 + CD8 int CD4SP CD25 -50 0 75 25 100 DP 0 25 50 75 100 DP CD25-INT CD25-SP CD4 + CD8 int CD4SP CD25hi DP 50 0 75 25 100 * wt wt MHC II° wt MFI MHC class II
100 101 102 103 104 FL3-H 100 101 102 103 104 FL3-H 100 101 102 103 104 FL3-H 100 101 102 103 104 FL3-H CD4+CD69low CD4+CD69hi R4 R5 log CD69 Relative MHC class II 0 5 10 15 20 25 0 2 4 6 ** ** CD69hi CD69low 25 15 10 5 0 20 15 CD25 -CD25 hi CD25 hi CD25 -Figure 6 B 0 2 4 6 8 10 12 14 CD25- CD25+ *** CD4 + CD25 -CD4 + CD25 hi 12 8 4 0 A low hi Relative MHC class II 0 50 100 150 200 250 300 350 400 450 500 mean/3 B220+ 500 250 0 500 log MHC class II 100 101 102 103 104 FL3-H log MHC class II CD25 -CD25hi CD25 -CD25hi CD4+