HAL Id: hal-01052798
https://hal-sciencespo.archives-ouvertes.fr/hal-01052798
Submitted on 28 Jul 2014
HAL is a multi-disciplinary open access archive for the deposit and dissemination of sci-entific research documents, whether they are pub-lished or not. The documents may come from teaching and research institutions in France or abroad, or from public or private research centers.
L’archive ouverte pluridisciplinaire HAL, est destinée au dépôt et à la diffusion de documents scientifiques de niveau recherche, publiés ou non, émanant des établissements d’enseignement et de recherche français ou étrangers, des laboratoires publics ou privés.
Public Investments in French West Africa
Elise Huillery
To cite this version:
Elise Huillery. History Matters: The Long Term Impact of Colonial Public Investments in French West Africa. American Economic Journal: Applied Economics, American Economic Association, 2009, 1 (2), pp.176-215. �hal-01052798�
176
=10.1257/app.1.2.176
S
ince West African countries acceded independence in 1960, the economic per-formance of these countries has been strikingly low in comparison with other developing countries. This is what makes many observers refer to this as an “African tragedy.” Obviously, the need for understanding this tragedy is crucial. The eco-nomic historian Paul Bairoch writes: “There is no doubt that a large number of negative structural features of the process of economic underdevelopment have his-torical roots going back to European colonization” (Bairoch 1993, 88). Since 2000, a growing literature focuses on the interaction between colonialism and develop-ment. Several empirical papers have tested the impact of colonial history on devel-opment paths and, for the best clarity, I classify them into three groups according to their colonial dimension of interest. The first group of papers focuses on differ-ences induced by colonizers’ identities. Raphael La Porta et al. (1999) and Daron Acemoglu and Simon Johnson (2003) find that colonizing countries had an impact on the development path of former colonies through the nature of legal systems they imported to the colonies. Both give evidence that former English colonies benefit * Paris School of Economics (PSE), L’Institut de recherche pour le développement (IRD), and Développement Institutions & Analyses de Long Terme (DIAL), Paris (e-mail: huillery_elise@yahoo.fr). I am grateful to Denis Cogneau and Thomas Piketty for valuable advice and guidance throughout this project, Kudzai Takavarasha for fantastic editing assistance and valuable comments and suggestions, and three anonymous referees for comments that substantially improved this paper. I have greatly benefited from discussions with Jean-Laurent Rosenthal, Marcel Fafchamps, Mickael Kevane, Alexander Moradi, Gilles Spielvogel, and numerous seminar participants. Historical data used in this paper have been collected by the author as part of the research project Long Term History and Resources Distribution in Africa directed by Cogneau (IRD, DIAL, Paris). Financial support from the French Ministry of Research is gratefully acknowledged. Martine Lorenzo, Angélique Roblin, Xavier Midon, and Angelina De Baecque have provided excellent research assistance for archive extraction.† To comment on this article in the online discussion forum visit the articles page at: http://www.aeaweb.org/articles.php?doi=10.1257/app.1.2.176.
History Matters: The Long-Term Impact of Colonial Public
Investments in French West Africa
†By Elise Huillery*
To what extent do colonial public investments continue to influence current regional inequalities in French-speaking West Africa? Using a new database and the spatial discontinuities of colonial invest-ment policy, this paper gives evidence that early colonial investinvest-ments had large and persistent effects on current outcomes. The nature of investments also matters. Current educational outcomes have been more specifically determined by colonial investments in education rather than health and infrastructures, and vice versa. I show that a major channel for this historical dependency is a strong persistence of investments; regions that got more at the early colonial times
from better institutions than former French colonies thanks to a more efficient legal system inherited from colonial times. A second group of papers focuses on the impact of European settlement. Acemoglu, Johnson, and James A. Robinson (2001) show that former settlement colonies perform better than former extractive colonies because they inherited institutions that better protect private property rights. Finally, a third group of papers focuses on the impact of institutions induced by particular administrative rules. Abhijit Banerjee and Lakshmi Iyer (2005) study the impact of the colonial land tenure system on the development of Indian districts. They provide evidence that districts in which property rights for land were given to cultivators now perform better than districts in which these rights were given to landlords. Iyer (2005) compares economic outcomes in India, across areas under the direct colo-nial rule of British administrators with areas under indirect colocolo-nial rule. She finds that districts under direct colonial rule have significantly lower availability of public goods than districts under indirect colonial rule.
These last two papers differ from the others in the sense that they do not compare all former colonies but focus on one particular country, India. The authors argue that it allows them to locate the source of difference more easily, relative to the case where former colonies have radically different historical, geographical, and cultural backgrounds, as well as different colonial histories. My paper follows the same idea. It focuses on one particular source of difference (colonial public investments) in one particular area (French West Africa). This region exhibits a noticeable homogeneity regarding its geographical, anthropological, cultural, and historical characteristics. Moreover, it was colonized only by France (which allows us to control for the colo-nizer’s identity), in the same period (from the last quarter of the nineteenth century to 1960 ).1 The sources of difference between districts of former French West Africa are therefore easier to identify than between all former colonies. I compare the cur-rent performances of French West African districts that received diffecur-rent levels of public investments during colonial times. This paper proposes an empirical frame-work to estimate the long-term impact of public investments on spatial inequali-ties. This is motivated by two underlying questions. First, what is the importance of colonial history relative to pre-colonial history and geography? Second, what are the long-term returns of public investments?
With respect to the existing literature, this paper innovates in underlining the role of public investments rather than the more general role of institutions. Institutions are commonly viewed as providing a general favorable environment for develop-ment, but it is not clear in what precise way they encourage economic development. Acemoglu, Johnson, and Robinson (2001) push ahead the interpretation of insti-tutional overhang, but it is generally impossible to distinguish between the vari-ous potential channels of institutions’ influence. Banerjee and Iyer (2005) and Iyer (2005) give evidence that the effect of the land tenure system and colonial rule on productivity in India is indirect. Partially relying on their effect on current invest-ments, they argue that the differences in current economic outcomes are largely due to differences in current investments. Focusing on public investments, therefore, 1 Guinea acceded independence in 1958, whereas the other colonies of French West Africa acceded indepen-dence in 1960.
contributes to precisely why long-term history matters. The results are robust when controlling for country fixed effects, which captures the effect of institutions, so I am investing a very distinct channel for persistence of differences in the colonial period. Another advantage of this paper is the use of a first-hand dataset that matches direct and precise historical data with current data on districts. Colonial and pre-colo-nial data come from historical archives found in Paris and Dakar, whereas recent data come from national household surveys performed in the middle of the 1990s. I matched both using the geographical coordinates of the surveyed households’ local-ity and very precise colonial maps of each district.
Colonial times introduced important differences between the districts of former French West Africa. Colonial investments in education, health, and infrastructure were indeed very unequal among districts. Figures 1 and 2 plot colonial investment and 1995 performances. They show a strong relationship between colonial invest-ment and outcomes today. But the relationship between colonial investinvest-ment and current development cannot be taken as conclusive evidence since pre-colonial char-acteristics could have influenced both colonial investment and development paths, resulting in bias estimates of the causal effect of public investment on current devel-opment. French colonial power could have invested more in the most prosperous districts, which would have reached a higher level of development than the poor ones anyway. To overcome this potential selection bias, I use a number of strategies in this paper. First, I exploit proxies of the potential determinants of colonial investment, which can be classified into three groups: geographical factors, pre-colonial factors, and characteristics of colonial conquest. Access to a detailed history explains how variations came about. OLS regressions, including these proxies, give a first estimate of the impact of colonial investments on current development controlling for main pre-colonial characteristics. Second, I use historic data on pre-colonial population densities and political development to examine whether it was the most developed parts of West Africa that selected into colonial investments. Evidence shows that was not the case. Third, I use the geographical discontinuities of colonial policy in order to circumvent the problem of the omitted variables. The autonomy of the French districts’ administrators and the arbitrariness of colonial borders actually lead to accidental variations between neighbor districts. Some unobservable char-acteristics that may not be captured by OLS controls should be, in fact, similar for neighbor districts, so differences in outcomes between neighbor districts are more likely to be due to differences in colonial public investments.
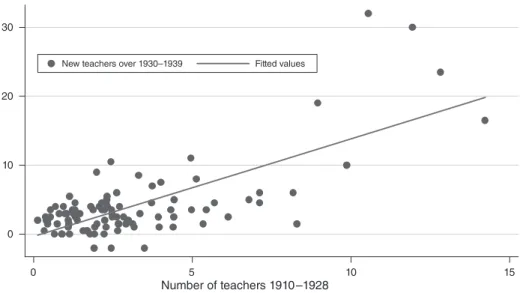
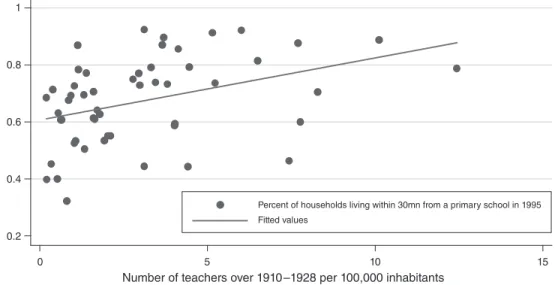
Results show that colonial public investments have been a strong determinant of current districts’ development. Colonial investments in a certain type of public good (education, health, or infrastructures) between 1910 and 1928 explain about 30 percent of the corresponding current performance. Moreover, the nature of invest-ments matters. Current educational performances are more specifically determined by colonial investments in education, current health performances by colonial investments in health, and current infrastructure’s development by colonial public works. I also find lower but significant cross effects of health investments on con-nection to electricity and access to a private water tap. According to my estimates, the long-term impact of colonial investments is very high. The path of public invest-ments from 1910 to 1939 shows that districts that received greater investment in
early times received more than the others later, which shows differences did not narrow over time. I find the fact that investments continued to be concentrated in areas that already had many of them is more likely due to the lasting nature of physi-cal facilities and positive externalities on lophysi-cal demand for public goods rather than externalities across investments, political externalities, or appropriation of public investments by political power.
The paper is structured as follows. Section I describes historical background and investment policy under French rule in West Africa. Section II describes data and gives some summary statistics on current development, colonial investments, and dis-tricts’ characteristics. Section III describes the empirical approach used to estimate the impact of colonial investments on development paths. The main empirical results are reported and discussed in Section IV. Section V discusses the mechanisms that might explain the persistence of the effect of colonial investments. Section VI concludes.
I. Historical Background: French Colonization
A. French political Control of West Africa
French West Africa officially lasted 65 years, from 1895 to 1960. Empirically, military expansion lasted from 1854 to 1903, pacification from 1854 to 1929, and effective occupation from 1904 to 1960.
1995 school at tendance r at e 7–1 2-y ear -old childr en 80 60 40 20 0 0 10 20 30
Number of teachers per 100,000 inhabitants
(Annual Mean from 1907–1930)
Colonial investments and current outcomes
Education
Figure 1. The Correlation between Colonial Investments in Education and Current Educational Outcomes
The French first arrived in 1854, landing on the Senegalese coast, led by the famous General Louis Faidherbe. Colonial expansion in the 1850s began from the west of the region. The first military column went from the Senegalese coast east-bound and arrived at the west side of what is currently Mali (Kayes, Satadougou in the late 1850s). A second military expansion was engaged during the 1850s north-bound to what is currently Mauritania. A third military expansion took place along the Guinean coast (Conakry, Boffa, Boke, and Forecariah). South Dahomey was the only new expansion in the 1860s. No new expansion occurred during the 1870s. Main colonial expansion occurred in the 1880s from south to north and from west to east. In the 1890s, a last military column progressed from the southeast side of what is currently Mali, east as far as Lake Tchad, joined by a column progressing from Benin’s coasts, going north.
French West Africa was officially created in 1895 as a federation of colonies of West Africa. But the conquest was not yet achieved. The federal government became effective in 1904. Despite military control on the major part of the terri-tory before 1900, there were no sensitive all day life modifications for local people before 1900–1910, except in a few coastal localities. Local chiefs’ prerogatives, in particular, were, in general, still intact, their military obedience being materialized by friendship treaties. Hostile chiefs suffered from French military repression. Civil administration took place progressively in the whole territory from 1900–1920. Thus, we can consider that an administrative occupation has been in effect in the major part of the territory from approximately 1910–1960.
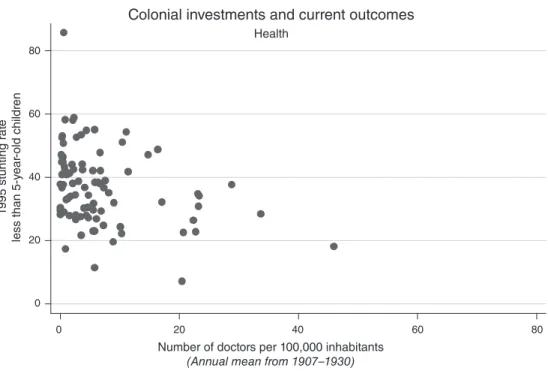
0 20 40 60 80 80 60 40 20 0 1995 stunting r at e
less than 5-y
ear
-old childr
en
Number of doctors per 100,000 inhabitants
(Annual mean from 1907–1930)
Colonial investments and current outcomes
Health
Figure 2. The Correlation between Colonial Investments in Health and Current Health Outcomes
B. Financial and Administrative organization of French West Africa
The French colonial administration was structured as a pyramid. At the top of the pyramid was the general governor of the federation. Next, were Lieutenant gover-nors, at the head of the colonies (Senegal, Guinea, Dahomey, Soudan, Upper-Volta, Ivory Coast, Niger, and Mauritania). Administrators were below lieutenant gover-nors, at the head of the districts, about 15 per colony. In 1925, French West Africa had 120 districts (see Figure 3). The largest districts were divided into subdivisions that were also managed by French administrators (in 1925, there were 164 subdivi-sions or districts, when the districts had no subdivision). At the bottom of the pyra-mid, under French administrators, were African chiefs. The colonial administration nominated local chiefs as village’s chiefs and limited their influence to small areas.
In this pyramidal organization, the effective power was concentrated at the third stage. The district administrators were “the real chiefs of the French empire” (Robert Delavignette 1939). Their tasks, which included overseeing tax collection; representing the lieutenant governor in all official events; counting people living in the district; drawing up the district’s map; steering elementary schools; watching Koranic schools; planning and supervising the building of roads, bridges, wells, and tracks; arresting criminals and judging them according to the “native population code,” were very important.2 The official tasks of African chiefs were to collect taxes, recruit a workforce for hard labor, and recruit military reservists. The number of reservists to recruit and the amount of taxes to collect was defined by French district administrators. African chiefs were quartered to auxiliaries of French colo-nial administrators. The administrative organization was officially centralized but effectively decentralized. French district administrators could manage their local policy in an almost independent way thanks to physical distances and no means of communication. Neighbor districts could therefore experiment with different colo-nial policies.
The French colonial financial system in West Africa was organized with three levels of budgets: the budget of the French Ministry of Colonies, French West Africa’s federal budget, and colonies’ local budgets. The budget of the French Ministry of Colonies was credited with metropolitan taxes and entirely devoted to military expenses. French West Africa’s federal budget was credited with custom duties generated by trade between the federation and the rest of the world. This budget had to cover three expenses: the running expenses of the general government and its central services, large-scale public works covering several colonies (mostly railway works), and subsidies to poor colonies (only Mauritania). Finally, the local budgets of the colonies were credited with local taxes. Each colony had to use its own resources to finance French colonization costs (except Mauritania, which ben-efited from federal subsidies). According to the statistics I computed,3 60 percent of colonies’ budgets came from the capitation tax. Direct taxes (capitation tax, trading tax, and property tax) represented 89 percent of the total resources of the colonies. Local budgets had to cover all expenses except for military expenses and some of
2 In French, called the “code de l’indigénat.” This code was exclusively devoted to African people. 3 These statistics were calculated from the budgets of 71 districts in 8 colonies between 1907 and 1930.
the biggest large-scale public works projects. The cost of colonization was endured by local populations rather than French taxpayers, and, more precisely, mostly by households rather than firms. The government and central services of the colonies absorbed 30 percent of the colonies’ resources. Districts received the other 70 per-cent, on average, distributed as follows: 40 percent for administration expenses, 10 percent for public works, 15 percent for education and health expenses (personal and material), and 5 percent for miscellaneous expenses. Investments in infrastructure, health, and education in the districts amounted to 25 percent of the colonies budg-ets. All expenses in the colonies, and a fortiori in districts, were carried out by local budgets, except for some very large-scale public works projects (almost exclusively railway works) which were financed by federal resources.
C. public Goods Investment policy
Colonial administration invested in three public goods: education, health, and infrastructure. Every year French administrators had to define how many teachers, schools, doctors, and hospitals were needed and how much money was alloted for public works in determining the local budget. In the education field, administra-tors had to decide how many European teachers, African teachers, and teaching assistants, as well as how many teaching materials were needed. In the medical field, they decided how many European doctors and nurses, African doctors and nurses, medical assistants were needed, and how many medical materials were needed. Finally, they decided how much financial resources were needed to cover their infrastructure expenses such as roads, wells, tracks, buildings, and bridge repair and construction. A very precise “plan de campagne” was established annually to describe all the works to be performed in each locality.
Colonial investments in education, health, and infrastructure were not propor-tional to district taxes. Taxes were actually brought together at the colony level, most of them were absorbed by central services and administration expenses, and the part of public expenses devoted to colonial investments was reallocated among districts with little concern for the initial contributions of each district. Some dis-tricts contributed a lot in local budgets but received low investments, others con-tributed a lot in local budgets and received high investments, and vice versa. As a consequence, the correlation between tax revenue and public investment was positive but small (about 0.2). No explicit investment strategy can be found in local budgets. Motivations reported at the beginning of each local budget explain the general level of annual resources and modifications in resource employment but do not motivate the spatial distribution of public goods provision. However, all his-torical documents on the French colonial administrative system mention the rela-tive autonomy of French district administrators and their power in terms of policy making (William B. Cohen 1973, Joseph Ki-Zerbo 1978, and Denise Bouche 1991). Biographies of former French colonial administrators also give evidence on their initiating role in the investment decision process (Robert Delavignette 1939; Hubert Duchamps 1975). The influence of administrators on investment policy was certainly very high. Thus, their personality or educational background could be an exogenous source of differences in colonial public investments. But some
intrinsic characteristics of the districts certainly also influenced administrators’ investment policy and therefore constituted an issue for identifying the causal impact of colonial investments on current development. My empirical strategy tries to circumvent this potential problem.
II. Data and Summary Statistics
To estimate the impact of colonial investment in public goods on the develop-ment of current districts, I use data on current developdevelop-ment, colonial investdevelop-ment policy, and other pre-colonial characteristics as control variables. All data are at the district level, a district in French West Africa being an administrative unit within a colony. Figure 3 shows the district configuration that the paper refers to, which is the configuration in 1925. At this time, French West Africa included 120 districts in 8 colonies. On average, districts had an area of 48,000 km2 and a population of 120,000.
I choose to use district-level rather than state-level data for two major reasons. First, using district-level data gives a larger sample size. Second, the French colonial system was, in fact, decentralized, and variations therefore arose at the district level rather than at the state level. District was thus the pertinent unit with respect to the historical effects focused on in this paper. The drawback is that no district-level data is available, so I had to compute current and historical data myself.
Dakar Bignona Ziguinchor Dabola Kindia KKissidougou Macenta Pita Boke Siguiri Koumbia Satadougou Kolda Tambacounda ThiesLouga Matam
DaganaPodor
Forecariaha Boffa
Gueckedou Kouroussa
A. Current districts development
Although West Africa counts among the poorest regions of the world, there is an important heterogeneity between countries of this region. In 2000, the Gross National Product (GNP) percapita for the Ivory Coast ($690) was four times higher than that of Niger ($190).4 In 1995, primary net enrollment rate varied from 25 percent in Niger to 75 percent in Benin.5 The literacy rate amounted to 13.5 percent in Niger, around 20 percent in Mali and Burkina Faso, 32 percent in Senegal and Benin, 38 percent in Mauritania, and 44 percent in the Ivory Coast.6 The inequalities between countries are thus consequent. However, the greatest inequalities in former French West Africa do not arise at the state level, but at the district level. District-level data on current development used in this paper come from national household surveys implemented in the 1990s.7 Unfortunately, I could not use any survey for Benin, which is there-fore excluded from the sample. The number of available districts is therethere-fore 101. Development indicators that can be computed from each national household survey are: (a) the proportion of 7–12-year-old children attending school, (b) the proportion of 0–5-year-old children suffering from stunting, and (c) the proportion of households connected to electricity, having access to a private water tap, and using a modern fuel.8 The Mauritanian survey does not contain information about the weight and the height of the children, so (b) excludes Mauritanian districts.
The top portion of Table 1 (labeled 1995 districts’ development) presents summary statistics on those five development indicators. On average, per district, in 1995, 34 percent of the 7–12-year-old children attended school, 37 percent of 0–5-year-old children suffered from stunting, 12 percent of households were connected to electric-ity, 10 percent had access to a private water tap (as opposed to public sources of water like fountains or natural sources like streams), and 14 percent used a modern fuel for cooking. Data give evidence of the very low development level of French-speaking West Africa. But the distributions of all these indicators are exceptionally unequal, particularly for infrastructure development indicators, as shown by the high values of standard errors and gaps between means and medians or between twenty-fifth and seventy-fifth percentiles.
Figure 4 represents the geographical distribution of districts by terciles of the proportion of 7–12-year-old children attending school. The districts of the first ter-cile are light colored, those of the third terter-cile are dark colored. We can observe some regional tendencies (“light” areas versus “dark” areas), Northwest of West Africa and south of the vory Coast that are obviously more educated than the rest of the region. Spatial inequalities are therefore partly a matter of country and geo-graphical location. Nevertheless, these maps also show an important heterogeneity between neighboring districts. To measure the importance of being in a particular country, I decomposed the total variance of each indicator in two parts: the
vari-4 Source: World Bank statistics. 5 Source: World Bank statistics. 6 Source: World Bank statistics.
7 See Appendix 1 for further details on data.
8 Surveys count, on average 450 households, 620 7–12-year-old children and 370 less than 5-year-old children per district.
ance within countries and the variance between countries. I calculated the share of total variance due to variance within countries, and it clearly shows the predomi-nance of within-country variance which represents around 80 percent of total vari-ance. Country or geographical position is a small part of the story. What we have to explain are inequalities at the district level rather than at the state level.
B. Colonial public Investments
Data on colonial investments come from annual local budgets for the period 1910–1928. Local budgets are presented at the colony level but often detail tax rev-enue and public investments at the district level. Regarding education, I collected the number of teachers per district for each available year between 1910 and 1928 and used the average number of teachers per 100,000 inhabitants as a proxy of colonial investments in education. I used the same variable for colonial investments in health substituting medical staff for teachers. Finally, I collected annual public works mate-rial expenses per district between 1910 and 1928 and used the average amount of public works expenses from 1910–1928 per capita as a proxy of colonial invest-ments in infrastructures.9 Public works consisted of roads, wells, tracks, building and bridge repairs and construction.
Data on large-scale public works projects financed with federal resources are not included for two reasons. First, it would have required the collection of federal budget data in addition to local budget data, which represents an important addi-tional effort. Second, federal budgets do not decompose investments at the district level or at the state level, which would make any repartition between districts very hypothetical. This exclusion produces an understatement of colonial investments inequalities: large-scale public works financed with federal resources were mostly devoted to main towns or main axes of each colony; those that were already advan-taged by local budgets. Actual colonial inequalities in infrastructures were probably larger than was measured here.
It is well known that Christian missionaries were important in the development of education and health systems in English African colonies as well as in French Equatorial Africa, but they were mainly absent from French West Africa (Ki-Zerbo 1978 and Bouche 1991). In 1903, the French parliament actually voted the secu-larization of social services in the colonies and stopped the subsidies accorded by French authorities to Christian missionaries. Archives do not mention the role of missions except in Dahomey,10 which is not included in my study. The omission of Christian missionaries in this paper should therefore not affect my results. In addi-tion to Christian missionaries, there were also Koranic schools in some areas, but I will not take them into account because these schools dispensed a very specific education that focuses on religious achievement.
9 Another possible proxy of colonial investments in infrastructures could be the annual public works material expenses per district between 1910 and 1928 divided by land area. My results are robust whatever proxy is used. But dividing the amount of public works expenses by land area is more problematic in presence of desert-edge districts because land area is huge and effective land occupation is very low, resulting in a confusing proxy.
10 Bouche (1991) explains that this colony had a significant number of missionary schools because the demand for education was far more important than the supply from public services in this colony.
As shown in the middle of Table 1 (labeled Colonial period), colonial invest-ments per district were very low: 4 teachers and 8.5 medical workers per 100,000 inhabitants and 0.44 FF11 per inhabitant for public works, on average, per year from 1910–1928. Standard deviations per mean unit are high and the difference in terciles’ means is huge. This gives evidence that colonial investments were very unequal. Figures 5 and 6 show the geographical distribution of colonial investment in education and health. It is clear that colonial investment policy was unbalanced. Upper Volta and the region southeast of Niger have been disadvantaged in terms of human capital investments. Investments in infrastructures were more concentrated in coastal areas of Senegal, Guinea, and the Ivory Coast, which reflects the structure of the French colonial economic system based on trade with European countries. In addition to regional discriminations, it is also noticeable that many neighbor districts received very different colonial treatments. The average gap between two neighbor districts is equal to five teachers and ten doctors, which is large compared to the average number of teachers and doctors per district.
Totalling average investments per district from 1910–1928 shows that there were, on average, only 700 teachers and 1,230 medical workers in all of French West Africa (of which a large majority were Africans). Thus, the colonial investment
11 Monetary data are calculated in constant 1910 FF.
Figure 4. Percent of 7–12-year-old Children Attending School
Table 1—Summary Statistics on Districts
Mean Standard deviation percentile Median25th percentile75th Min Max Observations
1995 districts’ development
% of 7–12-year-old children attended
school 34 16 22 33 43 1 75 98
% of 0–5-year-old children suffering
from stunting 37 12 28 37 44 7 85 89
% of households connected to
electricity 12 17 2 4 17 0 87 98
% of households having access to
private water 10 13 1 5 14 0 72 98
% of households using a modern
combustible 14 19 1 6 21 0 94 98
% of households living within 30mn
from a primary school 67 15 57 69 78 32 92 52
% of households living within 30mn
from a medical center 41 16 29 40 51 13 76 52
% of households living within 30mn
from drinkable water 82 14 74 84 94 41 99 52
Colonial period
Number of teachers per 100,000 hbt
from 1910–1928 4 5 1 3 4 0.2 28 99
Medical staff per 100,000 hbt from
1910–1928 8.5 15 1 4.4 9 0 111 98
Public works expenses per capita
from 1910–1928 (in 1910 FF) 0.44 1.2 0.05 0.13 0.31 0.003 9.7 99 New teachers per 100,000 hbt over
1930–1939 4.6 6.7 1.2 2.7 5.2 –12.3 41.5 99
New schools per 100,000 hbt
from1930–1939 1.7 2.4 0.3 1.4 2.5 –11 9.5 99
Local chiefs’ wages per 100,000 hbt
from 1930–1939 92,319 113,797 28,827 46,931 97,021 0 582,889 99 Index of hostility toward colonial
power from 1920–1940 0.42 0.41 0 0.33 0.66 0 2 99
Control variables
Number of European settlers per
100,000 hbt in 1910 100 254 7.8 21 68 0 2,125 99
Colonial conquest
Year of colonial conquest’s
beginning 1880 13.9 1879 1887 1890 1854 1903 99
Local resistance length 22.7 15.2 11 20 31 0 74 99
Local chiefs’ indemnities 657 1,516 0 0 420 0 7,726 99
Pre-colonial characteristics Centralized political power
dummy 0.49 0.5 0 0 1 0 1 99
1910 population density 6.22 7.15 1.72 3.8 7.9 0.008 38 99 Trade taxes per capita collected
in 1914 0.23 0.38 0.004 0.04 0.31 0 1.81 99
Europoean trade counter dummy 0.04 0.2 0 0 0 0 1 99
Geographical characteristics
Altitude (feet) 816 594 242 859 1,161 0 3,044 99
Annual rainfall average over
1915–1975 (mm) 1,050 718 500 890 1,546 17 3,248 99
Latitude 12.3 3.6 9.6 12.8 14.8 4.8 21 99
Longitude –6.7 6.8 –12.1 –7.3 –3.35 –17.1 12.9 99
Coastal dummy 0.17 0.38 0 0 0 0 1 99
Presence of an important river
dummy 0.65 0.48 0 1 1 0 1 99
Notes: See Appendix 1 for data description and sources. Statistics are all calculated at the district level. Saint-Louis and Dakar are excluded from the sample. Data on 1995 current development is missing for Bilma. Data on percent 0–5-year-old children suf-fering from stunting is missing for Mauritanian districts. Data on medical staff per 100,000 people is missing for Conakry.
effort was not massive. But these investments were unequally distributed. Colonial public investments’ policy was therefore an important source of inequality between districts.
C. other Characteristics of districts
At the end of the nineteenth century, French West Africa was a vast territory of 4,800,000 km2 inhabited by a scarce population of around 12,000,000 people.12 Population density was very low (2.5 people per km2 ). As stated in the introduction, an advantage of limiting the study to a geographically restricted area is that sources of variation can be much more easily identified than in the case of very different his-torical, anthropological, geographical, and institutional backgrounds. This section identifies characteristics of districts that potentially determined colonial investments and development performances. I collected a fair amount of observable characteris-tics of the districts. All data are original.
12 This corresponds to French West Africa’s population around 1910. See Appendix 1 for further details on data sources.
Figure 5. Number of Teachers per 100,000 Inhabitants (Annual mean, 1910–1928)
Geographical Characteristics.—Geographical characteristics of districts are potentially important determinants of their development path. They condition soil fertility, climate severity or mildness, accessibility to water, etc. (David E. Bloom and Jeffrey D. Sachs 1998). Climate, proximity to the coast, or access to practicable rivers could also have influenced colonial investments through their impact on the accessibility and attractiveness of districts. I use geographical characteristics reflect-ing the accessibility and attractiveness of districts as control variables. These char-acteristics are altitude, annual precipitation, latitude, longitude, presence of a coastal border, and presence of an important river.
pre-colonial history.—We could expect Europeans to prefer pre-colonial
pros-perous areas. The colonial strategy was actually extraction. Profitability of extrac-tion was likely to be higher in prosperous areas because dense populaextrac-tion provided a supply of labor that could be forced to work in plantations and public works and also because there are more resources to be extracted (Acemoglu, Johnson, and Robinson 2002). Philip Curtin et al. (1995, 447) write that “European capital was invested where exploitable resources promised the most extractive returns.” District-level information on pre-colonial times is difficult to collect, but I constructed four proxies of characteristics of pre-colonial districts. First, I capture the pre-colonial
Figure 6. Medical Staff per 100,000 Inhabitants (Annual mean, 1910–1928)
economic prosperity with the initial population density. As documented by Thomas Malthus (1798) and Bairoch (1993), only prosperous areas could support high popu-lation densities because more natural resources and agrarian prosperity are neces-sary to nourish a large population. This measure is therefore more appropriate in the case of rural societies. At the end of the nineteenth century, West Africa was mostly a rural area. Towns were scarce and very small.13 Pre-colonial population density was concentrated in five places: on the right side of the Niger Loop (Mossi States), on Senegalese coastal areas (Djolof kingdoms), in central Guinea (Fuuta-Jalon), in south-central Ivory Coast (Baoule people), and in the Guinean forest area (Toma and Guerze people). Second, I use the amount of trading tax collected in 1914 in each district to control for commercial development. Trading tax was introduced a few years before 1914 and regarded all secondary and tertiary activities. Tariffs depended on firms’ activity and number of employees. Third, besides these local trade activities, there were some very important overseas trade areas, European trad-ing counters. These tradtrad-ing counters had created big discontinuities in West-African economic development. That is why I constructed a dummy variable indicating the location of these European trade counters. Fourth, I roughly capture the differences in pre-colonial political development with a dummy for pre-colonial centralized political power (“state societies”) as opposed to stateless societies. The existence of a centralized political power could have encouraged colonial investments according to the fact that investments could be more profitable in state rather than stateless districts, as shown by Nicola Geneaioli and Ilia Rainer (2003).
French Conquest Characteristics.—Colonial conquest could reveal some
intrin-sic characteristics of disticts which make them more or less attractive for French power and more or less inclined to develop. I therefore use three variables on colo-nial conquest as control variables. First, the first year of the French colocolo-nial con-quest, defined as the year of arrival of the first military troops. Fifty years passed between the beginning and the end of French colonial expansion in West Africa, which makes a big difference when compared to the length of the colonial era itself. Colonialism’s timing might be correlated with both colonial investments (early con-quered districts could have an advantaged over districts concon-quered later, or may be disadvantaged since colonization was extractive) and development potentialities (more affluent areas could have been colonized sooner). Second, I use African peo-ple’s resistance against French colonial power as a control variable because it might be correlated with colonial investments (rewards or punishments in response to local attitudes) and development potentialities because resistance might reflect some cul-tural, anthropological, or political characteristics. Third, I use the indemnities of local chiefs as a control variable because these indemnities rewarded chiefs for their obedience to colonial power. Chiefs’ indemnities are thus a proxy for African chiefs’ reaction. Some refused to cooperate and were often killed or exiled, whereas others cooperated with French colonial power and received some indemnities. As African
13 In 1910, the five biggest towns were Saint-Louis (around 24,000 inhabitants), Dakar (18,400), Rufisque (12,500), Conakry (8,200), and Cotonou (4,400). These towns were much smaller at the end of the pre-colonial era.
people resisted, collaboration between traditional and colonial power might be cor-related with colonial investments and development potentialities.
Early European settlement.—According to existing literature, European
settle-ment encouraged good colonial treatsettle-ment (Acemoglu, Johnson, and Robinson 2001). In West Africa, very few Europeans settled in comparison to other colonies such as Australia, Canada, etc. Early French settlement can reflect districts initial attractive-ness, however. Since it was probably a strong determinant of colonial investments, the impact of colonial investments on current performances could be driven by the fact that European settlers tended to settle in more prosperous areas. Moreover, European settlement, per se, could positively influence development paths through institutional channels, as documented in Acemoglu, Johnson, and Robinson (2001). Faced with the statistical challenge of isolating the causal impact of public invest-ments, controlling for European settlement is of crucial concern. The flip side of this strategy is that European settlement could also be endogenous to colonial public investments: the supply of public goods might be attractive for new settlers as well. To solve this problem, I add only early European settlement (1910) as a control vari-able, since early European settlers were more likely to be influenced by the charac-teristics of districts compared to colonial supply of public goods simply because the supply of public goods was almost nonexistent at the beginning of colonial times. The year 1910 is early enough to argue that European settlement was unlikely to be the result of any colonial policy.
III. Basic Correlations: OLS Estimates
A. Empirical strategy
I compare districts’ development performances according to the colonial invest-ments they received between 1910 and 1928 by running ordinary least squares regressions of the form
(1) yi= α + βCIi+ OCIiγ + Xiλ + u i,
where yi is an outcome variable in district i, CIi is the colonial investment of inter-est in district i, oCIi is other colonial investments in district i, and Xi is a control
variable.
Outcomes in equation (1) are those presented in Section II: the proportion of 7–12-year-old children attending school; the proportion of 0–5-year-old children suffering from stunting; and the proportion of households connected to electricity, having access to a private water tap, and using a modern fuel.
Regarding colonial investments, what interests me more specifically is the impact of colonial investments in education on educational performance, the impact of colo-nial investments in health on health performance, and the impact of colocolo-nial invest-ments in infrastructure on infrastructure development. As colonial investinvest-ments in education, health, and infrastructure are highly correlated, I want to disentangle the effect of each investment. I measure the specific impact of a given colonial
investment (CIi in equation (1)) on the related current performance (yi in equation
(1)) by controlling for the other colonial investments (vector OCIi in equation (1)).
When yi is districts’ proportion of 7–12-year-old children attending school, CIi is
districts’ average annual number of teachers per 100,000 capita, and vector OCIi is districts’ average annual medical staff per 100,000 capita and average annual amount of public works per capita. When yi is districts’ proportion of 0–5-year-old children suffering from stunting, CIi is districts’ average annual medical staff per
100,000 capita; and when yi is one of the three infrastructure development indica-tors, CIi is districts’ average annual amount of public works per capita, vector OCIi
being the two other colonial investments. Since districts that received many teachers received many doctors and a lot of infrastructure (correlations between these three variables are between 0.60 and 0.80), the impact of colonial investments is likely to be driven by the general amount of investments rather than by a specific investment. Controlling for the two other colonial investments in equation (1), it is interesting to isolate the specific impact of each kind of investment, and it also brings an additional control for the potentially unobserved characteristics that influenced all investments in the same way. It helps to identify the causal impact of a specific investment on the corresponding current outcome.
Xi is the set of control variables described in Section III: geographical variables
(precipitation, altitude, latitude, longitude, coastal border dummy, and practicable river dummy), pre-colonial prosperity (centralized political power dummy, 1910 population density, 1914 collected trade taxes per capita, and European trade counter dummy), conquest variables (year of colonial conquest’s beginning, length of local resistance, and local chiefs’ indemnities), and early European settlement (1910 European settlers per 100,000 inhabitants). I argue that these controls are more precise and demanding than usual, and that they purge a large number of the endogenous factors.
Dakar and Saint-Louis had a very specific status during the colonial period. They were both founded by the Europeans. Saint-Louis was the first city founded by the Europeans in West Africa in 1659, it was the capital of French West Africa until 1902, and then the capital of two colonies (Mauritania and Senegal). Dakar has been the capital of French West Africa since 1902. These two cities were not exactly “districts” because they were not attached to a broader region. As a consequence, Dakar and Saint-Louis did not appear in colonial budgets as districts but as “direct adminis-trated territories.” As far as public investments are concerned, Dakar and Saint-Louis received much greater annual colonial investments than the classical districts: 63 (respectively 202) teachers per 100,000 inhabitants, 133 (respectively 241) medical workers per 100,000 inhabitants, and 12.1 (respectively 21.6) FF per capita in public works for Dakar (respectively Saint-Louis), on average, from 1910–1928. They are also much more developed today than the rest of the region. The colonial investments gap between those two cities and the others would produce an important overstatement of the impact of colonial investments on current performances and would probably reflect the very specific colonial treatment they received. I therefore prefer to drop Dakar and Saint-Louis from the sample.
Our coefficient of interest is β, and to a lesser extent γ, because it is also interest-ing to know whether there are “cross effects,” for example, effects of colonial invest-ments in education on current health and infrastructure performances.
B. results
Table 2 and Table 3 report OLS estimates of the impact of 1910–1928 colonial investments on 1995 performances. Column 2 includes geographical controls, column 3 adds pre-colonial characteristics, column 4 adds conquest characteristics, and column 5 adds European settlement in 1910 as control variables. In column 6, I add dummy variables that indicate the country districts’ location after independ-ence. These are included because the dependent variables are taken from country surveys that may be constructed using different methodologies. Finally, column 7 reports the regression coefficients controlling for the other colonial investments to isolate the specific impact of each type of investments.
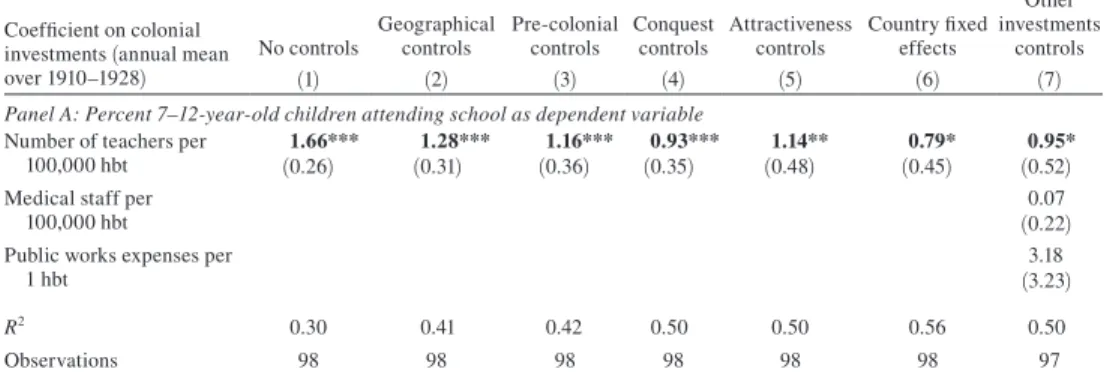
Table 2—The Impact of Colonial Investments on 1995 Education and Health: OLS Estimates Coefficient on colonial
investments (annual mean over 1910–1928)
No controls Geographical controls Pre-colonial controls Conquest controls Attractiveness controls Country fixed effects Other investments
controls
(1) (2) (3) (4) (5) (6) (7)
panel A: percent 7–12-year-old children attending school as dependent variable
Number of teachers per 1.66*** 1.28*** 1.16*** 0.93*** 1.14** 0.79* 0.95*
100,000 hbt (0.26) (0.31) (0.36) (0.35) (0.48) (0.45) (0.52)
Medical staff per 0.07
100,000 hbt (0.22)
Public works expenses per 3.18
1 hbt (3.23)
r2 0.30 0.41 0.42 0.50 0.50 0.56 0.50
Observations 98 98 98 98 98 98 97
panel B: percent 0–5-year-old children suffering from stunting as dependent variable
Number of teachers per 0.47
100,000 hbt (0.46)
Medical staff per –0.43*** –0.60*** –0.59*** –0.60*** –0.56*** –0.49** –0.56***
100,000 hbt (0.13) (0.16) (0.17) (0.17) (0.20) (0.20) (0.21)
Public works expenses –3.55
per 1 hbt (5.85) r2 0.27 0.30 0.32 0.34 0.34 0.41 0.37 Observations 88 88 88 88 88 88 88 Control variables Geographical characteristics N Y Y Y Y Y Y Pre-colonial characteristics N N Y Y Y Y Y Colonial conquest N N N Y Y Y Y Initial attractiveness N N N N Y Y Y
Country fixed effects N N N N N Y N
Notes: Standard errors are in parentheses. Each cell represents the coefficient from an OLS regression of the dependent vari-able on the independent varivari-able. In panel A, column 8, the number of observations falls to 97 because data on medical staff per 100,000 hbt is missing for Conakry district. In panel B, the number of observations falls to 88 because data on medical staff per 100,000 hbt is missing for Conakry district and data on percent 0–5-year-old children suffering from stunting is missing for Mauritanian districts. Initial attractiveness control variables are: number of European Settlers per 100,000 population in 1910 and trade taxes per capita collected in 1914. Colonial conquest control variables are: year of colonial conquest’s beginning, local resistance length, local resistance length2, and local chiefs’ indemnities. Pre-colonial characteristics control variables are:
cen-tralized political power dummy, European trade counter dummy, and 1910 population density. Geographical characteristics con-trol variables are: annual rainfall average from 1915–1975, altitude, longitude, latitude, coastal dummy, and river dummy.
*** Significant at the 1 percent level.
** Significant at the 5 percent level.
The general picture that emerges from these tables is that districts that received more investments from 1910–1928 have significantly better performances today. The size of the impact of colonial investments is important. Adding one teacher per 100,000 inhab-itants from 1910–1928 would lead the percentage of 7–12-year-old children attending school in 1995 up to about 1 point. Adding one doctor per 100,000 inhabitants from 1910–1928 would drop the percentage of 0–5-year-old children suffering from stunt-ing in 1995 to about 0.5 points. Finally, addstunt-ing one franc per capita public works from
Table 3—The Impact of Colonial Investments on 1995 Access to Infrastructures: OLS Estimates Coefficient on colonial
investments (annual mean over 1910–1928)
No controls Geographical
controls Pre-colonial controls Conquest controls Attractiveness controls
Country fixed effects Other investment controls (1) (2) (3) (4) (5) (6) (7)
panel A: percent households connected to electricity as dependent variable
Number of teachers per 0.01
100,000 hbt (0.40)
Medical staff per 100,000 hbt 0.12
(0.18) Public works expenses 8.71*** 6.96*** 9.05*** 8.69*** 5.29*** 5.72*** 1.16
per 1 hbt (1.1) (1.11) (1.36) (1.29) (1.43) (1.39) (2.50)
r2 0.38 0.58 0.61 0.67 0.73 0.78 0.70
Observations 98 98 98 98 98 98 97
panel B: percent households having access to private water as dependent variable
Number of teachers per 0.05
100,000 hbt (0.43)
Medical staff per 100,000 hbt –0.03
(0.19) Public works expenses 6.11*** 5.62*** 6.92*** 6.80*** 5.74*** 5.82*** 3.11*
per 1 hbt (0.92) (1.00) (1.25) (1.27) (1.52) (1.54) (1.85)
r2 0.31 0.41 0.44 0.47 0.49 0.54 0.50
Observations 98 98 98 98 98 98 97
panel C: percent households using a modern fuel as dependent variable
Number of teachers per 0.50
100,000 hbt (0.45)
Medical staff per 100,000 hbt –0.005
(0.20) Public works expenses 8.81*** 6.75*** 9.88*** 9.58*** 7.49*** 7.70*** 3.14
per 1 hbt (1.37) (1.35) (1.63) (1.36) (1.60) (1.55) (2.81) r2 0.30 0.51 0.56 0.72 0.74 0.79 0.72 Observations 98 98 98 98 98 98 97 Control variables Geographical characteristics N Y Y Y Y Y Y Pre-colonial characteristics N N Y Y Y Y Y Colonial conquest N N N Y Y Y Y Initial attractiveness N N N N Y Y Y
Country fixed effects N N N N N Y N
Notes: Standard errors are in parentheses. Each cell represents the coefficient from an OLS regression of the dependent variable on the independent variable. In column 7, the number of observations falls to 97 because data on medical staff per 100,000 hbt is missing for Conakry district. Initial attractiveness control variables are: number of European settlers per 100,000 population in 1910, and trade taxes per capita collected in 1914. Colonial conquest control variables are: year of colonial conquest’s beginning, local resistance length, local resistance length2, and local chiefs’ indemnities. Pre-colonial characteristics control variables are: centralized political power dummy, European trade counter dummy, and 1910 population density. Geographical characteristics control variables are: annual rainfall average 1915–1975, altitude, longitude, latitude, coastal dummy, and river dummy.
*** Significant at the 1 percent level.
** Significant at the 5 percent level.
1910–1928 would the percentages of households having access to a private water tap and using a modern fuel to raise to about 3 points. But the specific impact of the investments in infrastructures appears statistically unconvincing since the coefficient is not signifi-cant in column 7, except in panel B. Table 2 clearly shows that colonial investments in health and infrastructures did not have an impact on current school attendance, per se, and that colonial investments in education and in infrastructures did not have an impact on current health performances, per se. These findings highlight the specific impact of colonial investments in education on educational performance and the specific impact of colonial investments in health on health performance, which gives strong evidence that the nature of public investments matters even in the long run. This is also an impor-tant point with regard to identification of the causal impact of public investments. The fact that “cross-investment” effects are very small compared to “direct-investment” effects is very interesting because it confirms that I correctly identify the causal impact of a specific investment rather than other correlated factors.
We can notice that the explanatory variables in this paper account for about 40 percent of the variation in 1995 health performances, 50 percent of the variation in 1995 school attendance, and 70 percent of the variation in 1995 access to infrastruc-tures. More importantly, each specific colonial investment alone accounts for about 30 percent of the variation in the corresponding 1995 performance.
IV. Econometric Issues: Selection and Causality
Although the OLS estimates show that differences in colonial investments prob-ably caused differences in current performances, thanks to precise and demanding controls, it remains plausible that control variables included in previous specifica-tions do not capture all factors correlated with colonial investments and current out-comes. In this section, I pursue two strategies to evaluate whether the relationship between colonial investments and current performances might reflect omitted vari-ables. First, using historic data and qualitative evidence from African historians, I evaluate the importance and characteristics of selection into colonial investments. As I will show, evidence suggests that selection was not important. If any, it was usually the regions that were the least prosperous that selected into colonial invest-ments. Given this evidence, it is unlikely that the strong relationship between colo-nial investments and current performance is driven by selection. Second, I use a “natural experiment” approach that compares neighbor districts only. Results from this matching strategy confirm the OLS estimates.
A. historical Evidence on selection during Colonial Times
Using data on initial population densities (1910), I check whether it was the more prosperous or less prosperous areas that selected into colonial investments. Acemoglu, Johnson, and Robinson (2002) have shown that population density is a reasonable indicator of economic prosperity, following Malthus and Bairoch’s argu-ments. Table 4 shows the relationship between population density in 1910 and colo-nial investments in education (health, infrastructures, respectively). The data give evidence that the colonial supply of public goods was equal in the most and least
prosperous areas. With respect to education and health, the advantage even turned slightly in favor of least prosperous areas, probably due to the fact that public goods are lumpy fixed investments. In this case, the selection, if any, tends to bias the OLS estimates toward zero.
A second potential source of selection may be that politically well-structured soci-eties have selected into colonial investments. Pre-colonial kingdoms were politically unified and therefore benefited from a greater social cohesion. As a consequence, they were more likely to claim a larger share of the new public goods than decentral-ized and heterogeneous societies (Banerjee, Iyer, and Rohini Somanathan 2008). But data give evidence that districts located in pre-colonial kingdoms were less impacted by colonial investments than the others. In the period 1910–1928, the average annual number of teachers per 100,000 inhabitants was 3.5 compared to 5.2, the average annual number of doctors per 100,000 inhabitants was 6.3 compared to 10.6, and the average annual expenses in public works was 0.24 compared to 0.64 (all of these differences are significant at the 5 percent level). The general picture that emerges from the data is that the selection bias is, again, rather downward.
One could think that colonial investments were actually determined by some characteristics related to European suitability rather than pre-colonial development. Acemoglu, Johnson, and Robinson (2001) document the fact that European settle-ment was, for instance, influenced by the disease environsettle-ment, which is somehow disconnected from local prosperity. Such an exogenous source of variation in colo-nial investments within French West Africa could be the distance from the coast. The distance from the coast was a physical determinant for European settlement since Europeans arrived by boats and were more likely to settle in areas near the coast. If colonial supply of public goods followed European settlement (because European demand for schools, hospitals, and infrastructure was high), we would expect colo-nial investments to be correlated negatively to the distance from the coast. Table 4 shows the correlation between colonial investments in education, health, and infra-structure, and distance from the coast. The correlation is significantly negative (or nil in the case of investments in health), which confirms that something accidental
Table 4—Historical Evidence on Selection During Colonial Times Dependent variable: colonial investments (annual mean 1910–1928) Number of teachers per 100,000 hbt Medical staff per 100,000 hbt Public works expenses per 1 hbt Number of teachers per 100,000 hbt Medical staff per 100,000 hbt Public works expenses per 1 hbt Coefficient on: (1) (2) (3) (4) (5) (6) Population density 1910 –0.13** –0.27 –0.006 (0.07) (0.20) (0.017)
Distance from the –0.004*** –0.005 –0.0009***
coast (km) (0.0001) (0.004) (0.0003)
r2 0.03 0.02 0.001 0.08 0.02 0.09
Observations 99 99 99 99 99 99
Notes: Standard errors are in parentheses. Each cell represents the coefficient from an OLS regression of the dependent variable on the independent variable.
*** Significant at the 1 percent level.
** Significant at the 5 percent level.
influenced overall colonial investment patterns. But the correlation does not explain much of the variation in colonial investments (8 percent, 2 percent, and 9 percent, respectively). In particular, test for weak instrument shows that distance from the coast is not a valid instrument.
To conclude, the variation in the characteristics of districts leaves much of the observed variation in colonial investments unexplained (the share of variation attribut-able to population density and pre-colonial political status together is only 4 percent, and the share attributable to distance from the coast does not exceed 9 percent). If local characteristics were only weak determinants of colonial investments, then the decisive factor is to be found elsewhere. On this point, Banerjee, Iyer, and Somanathan (2006) highlight the role of “top-down interventions” in bringing about changes in public goods access. Based on historical literature on colonial French West Africa, “top-down interventions” seem to be an appropriate explanation of the observed vari-ations in colonial investments for several reasons. First, district administrators were largely autonomous as explained in Section I. All testimony from former administra-tors attests to the fact that they controlled every aspect of district management and drew their own policy (William B. Cohen 1973, Delavignette 1939, Association des anciens élèves de l’école coloniale 1998, and Colombani 1991). Second, there was a large heterogeneity among administrators. Cohen (1973) reports five types of adminis-trators: former soldiers (apparently the most brutal and violent with local populations), former metropolitan civil servants (inappropriate for colonial service), former gover-nor secretaries (good for administrative work but not for management), former admin-istrators’ assistants (not well educated but well informed on administrator’s work), and former pupils of French “Ecole Coloniale” (well educated, part of the French elite). Third, Cohen (1973), among others, emphasizes the relationship between the adminis-trators’ educational and familial backgrounds and their vision of colonization (more or less humanist). The specific personality of the administrators was, therefore, a strong determinant of the policy they implemented, particularly at the beginning of colonial times (in the 1900s and 1910s), because administrators stayed long enough in specific districts to implement long-term projects (after World War I, they had relatively shorter tenures, typically three years). According to historians, the intervention of the admin-istrators accounts for a significant part of the design of public goods policy. Since the affectation of an administrator in a specific district was a matter of vacancy and not a matter a selection (Cohen 1973, 76), the variation in the “quality” of the administrators constitutes an exogenous source of variation in public goods policy.14
B. matching Estimates
The strategy that I pursue is to use a matching approach that consists of compar-ing neighbor districts. This strategy exploits the spatial discontinuities of investment policy. The underlying idea is that geographic neighbors had similar unobservable
14 I do not use the identity of the administrators as an instrument because of the lack of data. Such data prob-ably exists, but I do not know exactly where (probably in Dakar) or what can be found on administrators’ char-acteristics. It is not certain that those characteristics that influenced the supply of public goods were observed by the French administration.
characteristics before being separated by a border under colonial rule. Differences in neighbors’ outcomes are, then, unlikely to be due to differences in omitted vari-ables. This approach is very close to a matching approach. In the case of French West Africa, there are good reasons to think that neighboring districts were very similar before colonial times. District borders did not exist in the pre-colonial era and were created at the beginning of French colonial rule. Most are natural borders (rivers), some are simply straight lines between two points. The aim of colonial power was to build districts that represented a similar charge for French administrators, either in terms of population or in terms of area. Colonial annual political reports give evidence that the definition of district borders was often a matter of administrative charges rather than a matter of intrinsic characteristics. Colonial power also divided some communities in order to have greater control of them. District administrators’ annual reports relate many cases of unrest at the borders due to the fact that people continued to ignore the borders and went here and there without worrying about colonial administrative rules. Pre-colonial and colonial maps show that the borders of pre-colonial kingdoms have been ignored, as have ethnic differences. This fact is obvious on colonial district maps. These maps indicate the ethnic groups present in each district, and we can see that an ethnic group was often present on both sides of a border. District borders are thus somewhat arbitrary.
This leads me to assume that neighbor districts shared similar unobservable acteristics. This assumption can be interpreted as the fact that unobservable char-acteristics are geographically distributed and that district borders were sufficiently exogenous to make differences between neighbor districts’ unobservable character-istics not salient. I suppose that current outcomes of district i belonging to neighbor-hood j can be written as a linear function of its colonial investments CIi and OCIi, its intrinsic characteristics Xi, and a neighborhood fixed effect θj:
(2) yi= α + βCIi+ OCIi γ + Xi λ + θj+ ui.
The only difference between equations (1) and (2) is the presence of a neighbor-hood fixed effect in equation (2), representing the fact that districts in the same neighborhood share common unobservable characteristics.
The outcome differential between two districts i and i’, belonging to the same neighborhood j, can be written as
(3) yi− yi’= β(CIi− CIi’) + (OCIi− OCIi’) γ + (Xi− Xi’)λ + ui− ui’ . Parameter β can be estimated by running an OLS regression of districts, of the same neighborhood outcomes differential, on the corresponding colonial invest-ments differential. These regressions allow me to check that my first results from equation (1) were not driven by omitted variables. Since district i can appear several times in the differentials within a neighborhood, standard errors within neighbor-hoods are not independent. Standard errors are thus adjusted for clustering at the neighborhood level.