HAL Id: hal-01617227
https://hal-mines-albi.archives-ouvertes.fr/hal-01617227
Submitted on 7 Nov 2018
HAL is a multi-disciplinary open access
archive for the deposit and dissemination of
sci-entific research documents, whether they are
pub-lished or not. The documents may come from
teaching and research institutions in France or
abroad, or from public or private research centers.
L’archive ouverte pluridisciplinaire HAL, est
destinée au dépôt et à la diffusion de documents
scientifiques de niveau recherche, publiés ou non,
émanant des établissements d’enseignement et de
recherche français ou étrangers, des laboratoires
publics ou privés.
Characterizing powders in order to determine their flow
behavior in a mixer
Leonard Legoix, Cendrine Gatumel, Mathieu Milhé, Henri Berthiaux
To cite this version:
Leonard Legoix, Cendrine Gatumel, Mathieu Milhé, Henri Berthiaux. Characterizing powders in
order to determine their flow behavior in a mixer: From small scale observations to macroscopic
in-mixer rheology for powders of various flowabilities. Powder Technology, Elsevier, 2017, 322, p.314-331.
�10.1016/j.powtec.2017.07.075�. �hal-01617227�
Characterizing powders in order to determine their flow behavior in a
mixer: From small scale observations to macroscopic in-mixer rheology
for powders of various flowabilities
Léonard Legoix, Cendrine Gatumel
⁎
, Mathieu Milhé, Henri Berthiaux
Université de Toulouse, Centre RAPSODEE, CNRS UMR 5302, Ecole des Mines d'Albi, Campus Jarlard, 81013 Albi Cedex 09, France
a b s t r a c t
In this study we examine the relationships between particle's characteristics and in-process powder behavior for single powders and their mixes. Flowing properties of twenty-three powders have been investigated with different techniques at three scales of measurement and three different states of consolidation in order to link their basic characteristics to their behavior during agitation in a mixer. The macroscopic scale concerns powder stirring experiments in a 48 L planetary pilot mixer. The mesoscopic scale properties have been measured with Erweka® volumenometer and FT4 Freeman rheometer under three different consolidation states. Their flow ability ranges from free-flowing to cohesive. Microscopic properties, at the scale of particles, have been obtained from LASER granulometry, SEM observations and He-pycnometry. The comparison between macroscopic experiments and mesoscopic characterizations through specific power shows that the consolidation state of the powder is a key parameter to consider, especially for cohesive powders. The macroscopic scale in-mixer rheological measurements show two main patterns: a free-flowing like pattern and a cohesive like pattern, the ranking of the powders between these two being not intuitive. It is found that the power registered when stirring a powder constituted by a free-flowing media filled with a cohesive one reaches a minimum for a specific ratio of the two powders that has been linked to the microscopic structure of the particle's packing.
Keywords: Rheology Powder characterization Convective blender Flowability Multi-scale study 1. Introduction
Flowability of powders is important in powder manufacturing processes such as mixing operations, storage and transportation between successive operations. For example, Elia et al.[1]have recently emphasized the correlation between the performance of a powder inhaler device and the physical and bulk properties of the carrier pow-der; Gijon-Arreortua and Tecante[2]linked the power consumption in a ribbon mixer and some powder physical properties. A recent review
[3], based on cereal industry, points out that understanding physical and flow properties is important to handle powders efficiently, but it still remains to be thoroughly studied. In a previous work[4]the rheology of free-flowing and cohesive powders was investigated in a pilot-scale planetary blender by recording the power consumption. Correlations between a power number and a Froude number were established. The coefficients of the correlations were linked to process parameters and powder cohesion but the study showed some limita-tions. Indeed, some powders showed unexpected behavior or could not be classified easily. This work would be of high value for industrial applications if only cohesion were accurately determined.
In dry powders, cohesion appears where interaction forces such as Van der Waals and capillary forces can be considered as significant compared to gravity, leading to poor flow behavior. This is the case, for example, when particle sizes are under 100 μm, because Van der Waals forces are predominant[5]. Conversely, powders for which the movement of particles is more influenced by gravity than cohesive forces can be qualified as free-flowing. The main issue is that these concepts of flowability or cohesion remain ill-defined. This is not an intrinsic property of a material since it depends on the shape and size of the particles, their porosity and roughness but also on environmental conditions such as temperature, relative humidity and surface impuri-ties; moreover, such powders keep the memory of the manipulations they underwent during, for example, transport or storage. Numerous methods of characterization are currently used to measure flow proper-ties or to assess flow behavior of powders. Among them we can cite as follows:
- measurement of an angle of repose
- measurement of the minimum aperture for a powder flowing out of a hopper[6]
- volumenometry which consists in measuring the packing density of a powder to calculate flowability indexes (Carr Index[7], Hausner ratio[8])
⁎ Corresponding author.
- shear-cells associated to the Jenike method[9]to calculate friction and cohesion of granular materials to build flow functions related to rheological behavior of the powder under a range of normal consolidation situations
- powder rheometer as developed by Freemann Technology[10], that proposes different tests linked to flowability in variously confined flowing situations such as agitation with a bladed impeller or aerated measurements with an air flow. These measurements are performed with a standard protocol of preparation of the powder, which minimizes the influence of the operator on results.
The previously cited methods allow characterizing powders in different packing situations. Leturia et al.[11]compared some of these methods of characterization for various powders. Three different kinds of methods have been distinguished, depending on the stress level conditions of the powder bed: packed conditions that are reached during compaction operations for instance, free-surface conditions for which flow properties are measured under low stresses and aerated conditions that take place when air is incorporated in the powder, like in fluidized beds. A conclusion of this work is that powders cannot be viewed as invariant entities. Since flowability of powders depends on their state of consolidation, they suggest that flow properties of powders should be deduced from the connection of several characteri-zation methods. In another study, Sogaard et al.[12]investigated the relation between shear cell characterization of microcrystalline cellulose and its discharge from a tablet press hopper. They pointed out the large impact of consolidation on the powder flow properties and the study was focused on the consolidation during discharge of the hopper, which is smaller than the shear cell consolidation. It was concluded that there is a need of an adapted experimental set-up to measure flow properties for pharmaceutical applications. In practice, the basic data given by suppliers are microscopic or particle scale rele-vant, such as chemical composition or size. The only way to link a pow-der to its flow pattern during processing is then to test its flowability with one or several mesoscopic scale devices. In order to be useful in predictive modeling, characterization of powders should be performed under the same packing conditions as in the process ideally; however these are not necessarily known nor homogeneously distributed in industrial installations. The question of the choice of the tests remains open.
Furthermore, the question of the observation scale of powder behavior remains open. Mandato et al.[13] analyzed static and dynamic stress distributions and particles motion in a laboratory scale experimental mixing cell in regard to a wet agglomeration pro-cess of semolina in a low shear mixer. A characteristic length linked to the semolina water content was identified in the experimental cell thanks to the Janssen's model. This local scale characteristic length was shown to be implied in a bed of particles under a vertical mechanical stress and the authors suggest that its role in the process scale is to be considered. Since single particles characteristics are not clearly linked to their collective flow behavior, multi-scale studies are still necessary to determine the flowing parameters that control process efficiency and define the best experimental conditions for their characterization.
In addition, focusing on mixing operations, each mixture component is usually characterized alone. To what extent does the characterization of flow properties of ingredients represent flow properties of their mixes? The work presented here investigates the relationships between rheological observations at process scale in a pilot planetary mixer (48 L
[14]) and mesoscale characterizations of flow properties or individual particle's scale properties for wide range of powders and their mixtures. We also aim to contribute to a better understanding of the influence of powder properties at small scale in powder mixing in a pilot mixer. It is a first step towards the establishment of predictive mixing models at process scale.
2. Materials and methods 2.1. Powders
In this work, several powders and mixtures have been studied to cover a wide range of physical properties. The five powders studied are semolina (Le Renard), lactose (Granulac 140), fine lactose (Granulac 230), talc (Luz00) and crushed sand (Société Nouvelle du Littoral). These powders have been chosen for their different sizes, densities, morphologies and chemical compositions. Semolina and lactose mixtures (M1) as well as semolina and fine lactose mixtures (M2) have then been studied in order to create a set of systems of varying cohesion. Lactose (or fine lactose) mass fraction varies from 0 to 1 with 0.1 steps in order to obtain powders of different properties. Taking into account single powders and mixtures, this defines twenty-three different powders.
Different properties have been measured at the microscopic scale. The median diameter d50is measured using a LASER diffraction particle sizer Mastersizer3000 (Malvern) with dry dispersion under a pressure of 3.5 bar. Particle density ρp has been measured using helium pycnometry with an Accumulator Pyc 1330 (Micromeritics). All of these properties are gathered inTable 1.
Particles morphology has been established using SEM microscopy (Fig. 1). Semolina, lactose, fine lactose and sand particles are polygonal, whereas talc is clearly made of platelets.
Geldart's classification[15]can be used to assess classifications that characterize the air-particle interactions, by expressing the difference between the density of particles ρpand air, against particles median size d50. Group A gathers powders that can be easily fluidized with a dense phase expansion after a minimum air speed of fluidization is reached, whereas powders in group B show bubbling behavior. Particles in group C badly fluidize and those in group D are able to create spouted beds. Only lactose and sand are clearly in group A of Geldart's classifica-tion, while fine lactose and talc are close to the border between A and C groups (Table 2). Semolina is classified in B group.
2.2. Characterization of powders
2.2.1. Mesoscopic scale measurements of flowability
The Carr Index (CI)[7], widely used as an indicator of the flowability, is evaluated using a tapped density volumenometer (Erweka® SVM 222), after one thousand 3 mm height taps. It reflects interactions between particles in motion situation, since it quantifies the relative difference of bulk densities between the un-tapped powder ρband tapped powder ρt(Eq.(1)). In this work, the Carr Index is expressed in percent.
CI ¼ 100∙ρt−ρb
ρt ð1Þ
A Carr Index smaller than 15 is associated to free-flowing powders which pack easily with gravity. On the contrary when the Carr Index is greater than 22 the un-tapped powder includes greater air fraction: this behavior is typical of cohesive powders for which strong interaction forces between particles lead to less spontaneous packing under gravity
[15].
Mesoscopic measurements are also performed with the FT4 Freeman powder rheometer using the 180 mL (50 mm diameter and 8.1 cm height) cylindrical glass cell. The impeller employed is made of Table 1
Main powder properties.
Property Semolina Lactose Fine lactose Talc Sand d50(μm) 312 61 26 16 33
two blades and travels along a rotational path with a helix angle of 5° to the horizontal that can move towards the powder poured in the vessel. The torque exerted on blades, and the normal force applied at the bottom of the vessel are measured and directly converted as energy needed to stir the powder. Basic Freeman procedures are used for all the experiments[10].
The Flow Rate Index (FRI) is obtained by the basic Freeman procedure. The powder is initially poured into the cylinder, its height corresponds to that of the cylinder as it is planed by a leveling system, the bulk is conditioned by a round-trip of the blade through the bed. The blade is moving through the powder bed and the total energy consumed from the surface to 10 mm from the bottom of the vessel (among a total distance of 70 mm) is recorded for two impeller tip speeds: 10 and 100 mm·s−1. FRI represents the ratio between the measured energy at 10 mm·s−1, E10, and the measured energy at 100 mm·s−1, E100(Eq.(2)).
FRI ¼E10
E100 ð2Þ
A FRI greater than 1 means that more energy is required to stir the powder bed at low speed, it is attributed to cohesive forces that do not allow particles to reorganize themselves behind the blades when the stirring speed is high. Typically, the larger the FRI is, the poorer the flowability is. As stated by Leturia et al.[11]we assume that this gives an indication on flowability under “free-surface” conditions.
The aeration cell of the FT4 was employed to evaluate the effect of aeration on the flow properties of the powders (Fig. 2). Flow energy is measured for 100 mm·s−1blade speed and air velocity can vary from 0 to 40 mm·s−1. This is the total energy needed to stir the bulk of
powder during a blade move from top to bottom of the powder. The flow energy generally decreases as the air velocity increases. The bed is aerated or fluidized depending on powder properties. The last data recorded, with the larger air velocity, corresponds to the Aerated Energy (AE). In our experiments, it is obtained at 6 mm·s−1of air, since elutriation can be observed beyond this value for some powders. Usually for cohesive powders, especially group A, the Aerated Energy is smaller than that of non-fluidizable powders in other Geldart's groups. When air velocity is high enough, the particles of group A are not in contact anymore, resulting in cohesion and friction forces that offer less resistance to the blade.
Cohesion measurements have been processed with the 85 mL (50 mm diameter and 4.3 cm height) shear cell of the FT4 rheometer. The powder bed height is defined with a leveling system, the bulk is conditioned by a round-trip of the blade through the bed. A yield locus is built under an intermediate level of pre-shear of 4 kPa Fig. 1. SEM pictures of semolina (a), lactose (b), fine lactose (c), talc (d), sand (e).
Table 2
Geldart's classification of the powders considered in this study.
Powder Semolina Lactose Fine lactose Talc Sand Geldart class B A A (close to C) C (close to A) A
Air flow
consolidation, for normal stresses of 1, 1.6, 2.4, 3.2 and 4 kPa. The shear rate of the apparatus is 18°/min. Then, according to the Jenicke's meth-od, cohesion is deduced from this yield locus as the intercept of a linear regression between plotted shear strength as a function of the applied normal strength. For dry powders, the cohesion measured represents the attractive Van der Waals forces between grains in a powder bed. Thus cohesion is larger in consolidated or confined powder beds. 2.2.2. Microstructure calculations for the mixtures
The microstructure of a powder bed can be characterized by its porosity (air volume content). This porosity is first evaluated thanks to results from different density measurements (particle, bulk and tapped densities). The goal of the calculations described in this part is to evaluate the porosity of binary blends such as M1and M2, with some hypothesis about the packing structure at micro-scale and densities measurements of the two components. The experimental and calculated porosity profile for M1and M2will finally be compared to gain a better insight into the organization of the particles at microscopic scale.
2.2.2.1. Experimental porosity of mixtures.Concerning mixtures M1and M2, for a semolina content of 0 or 100%, the particle density has already been measured by pycnometry (Table 1). For a mixture made of compo-nents of different true densities, we calculate a mean density of particles with Eq.(3), by considering a solid of density ρmmade of n components of density ρpiand a mass proportion xifor each. In this work n = 2 and xi varies from 0 to 1 with 0.1 steps.
ρm¼ 1
∑n
i¼1 ρxi
pi
! ð3Þ
The porosity ε of blends M1and M2is calculated from the tapped density measurements using Eq.(4), where ρtis the tapped density and ρmthe mean particle density of the mixtures. The tapped density is preferred to the bulk density since these measurements are more reproducible and it represents better the structure of a stack of particles. ε ¼ 1−ρt
ρm ð4Þ
2.2.2.2. Theoretical porosity of mixtures.A theoretical calculation of porosities of blends can be achieved thanks to a thermodynamic analogy of packing of spherical grains[16]. Some hypotheses need to be made: mixtures are made of big grains of semolina and of small grains of the other component (lactose or fine lactose), and every particle of a component is spherical and of the same size. Two models of packing will be presented: a simple model (model 1) and a more
complex one for ordered mixtures (model 2). The corresponding equations yield the bulk density ρk, k = 1 or 2 being the number of the packing model studied. The associated porosities εkcan be then deduced by Eq.(4).
The first packing model “model 1” is based on the assumption that big particles form a structure with pores that can be filled by small particles (Fig. 3). This is true while the small particles mass fraction xs is smaller than the fraction xsfneeded to fill all the pores. For larger fractions of small particles, the system can be considered as a packing of small particles with inclusions of big particles.
The evolution of the density ρ1of the powder bed can be expressed knowing the tapped density of big particle's pack ρtband the mass proportion xsin small particles, for a fraction in small particles smaller than xsf(Eq.(5)(a)). In this case, the volume of the bed remains the same and does not depend on xs. Concerning the situation of a bed of small particles with some inclusions of big particles, the density associ-ated can be calculassoci-ated with the mass fraction in small particles xs, the density of big particles ρpband the tapped density of small particles ρts (Eq.(5)(b)). ρ1¼ ρtb 1−xs if xsbxsf ð Þa ρpb:ρts ρpb:xsþ ρts:ð1−xsÞ if xs≥xsf ð Þb 8 > > < > > : ð5Þ
When the two expressions of model 1 are equal (Eq.(5)(a) and (b)), xsrepresents the proportion xsfof small particles for which the packing of the mixture is the more compact, i.e. when every pore of the big particles' bed is completely filled by small particles. The corresponding porosity profile, that will be compared with experimental tapped density, is plotted onFig. 4.
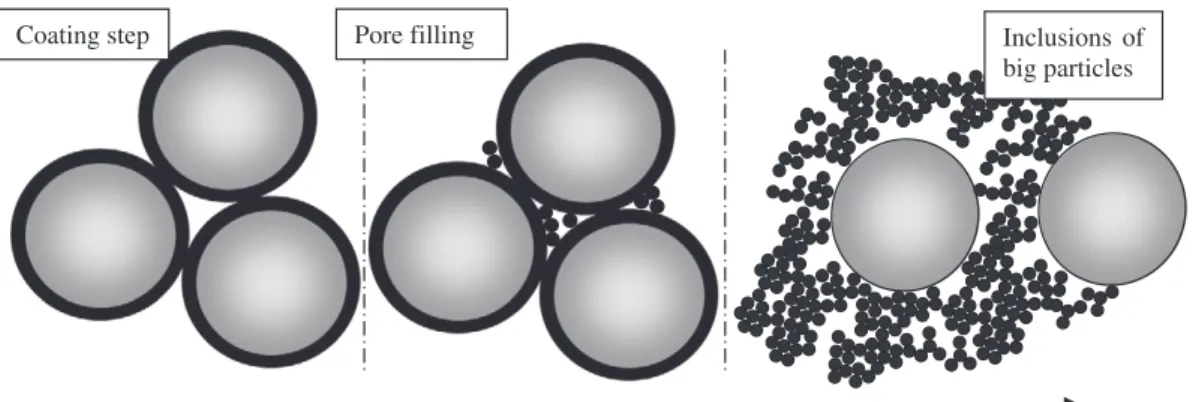
Optical microscopy observation reveals that lactose particles (Fig. 5(a)) and fine lactose particles (Fig. 5(b)) surround semolina particles. We will consider for theoretical calculations that lactose and fine lactose particles are coating semolina. It looks more like an ordered structure in the packing than a monolayer coating of every semolina particle. An ideal step of coating may be considered before filling pores between particles of semolina so as to take into account this ordering of the mixture. The packing model associated to this is named model 2.
During the coating step, small particles are supposed to create bigger composite particles, made of one big particle and several small particles. If we assume that the small particles are uniformly dispersed as a non-porous mono-layer around big particles, porosity will be the same until each big particle is perfectly coated with a mono-layer of small particles (Fig. 6).
The mass proportion of small particles xscrepresents the proportion needed to coat entirely the big particles. The corresponding number of small grains nsc is calculated as suggested by Thomas et al. [17], knowing the radii r and R of small and big particles respectively, with
Pore filling
Inclusions of
big particles
Fraction in small particles
the assumption that the repartition of small particles around a big one forms a two dimensional compact structure, as shown in Eq.(6). Then xscis evaluated using the mass of a big particle mband the mass of a small particle ms(Eq.(7)).
nsc¼ 4π 2pffiffiffi3 R þ r ð Þ2 r2 ð6Þ xsc¼ 1 1 þ mb nscms ð7Þ
If x is smaller than xsc, the porosity of the bed is not supposed to change, giving the Eq.(8)(a). Once the coating is achieved, the pack is made of big grains of resulting radius is R + 2r surrounded by small grains. The second relation, Eq.(8)(b) is readapted from model 1 (Eq.(5)(a)), for big pore filling, using ρtcthe tapped density of perfectly coated particles that can be calculated with xsc and Eq. (3). The difference between xsand xscrepresents the small particle fraction that is not coated and fills pores. When the proportion of small particles is large enough, all the pores of the coated particle bed are filled with small particles and the proportion associated is noted xscf. When xsis greater than xscf, the mixture is supposed to be made of a small particles packing with big particles inclusions. In this case, the density can be described as in Eq.(5)(b) of model 1 (Eq.(8)(c)). The corresponding
porosity profile, that will be compared with the experimental tapped density, is plotted onFig. 7.
ρ2¼ ρps:ρtb 1−xs ð Þρpsþ xs:ρpb if xsbxsc ð Þa ρtc 1− xð s−xscÞ if xsc≤xsbxscf ð Þb ρpb:ρts ρpb:xsþ ρts:ð1−xsÞ if xs≥xscf ð Þc 8 > > > > > > > < > > > > > > > : ð8Þ 2.3. Rheological measurements
Rheology is the study of the flow and deformation of matter when mechanical forces are applied to it. In this study it consists in measuring the torque exerted on the blades of an apparatus during powder agitation. This is done for different agitation speeds. A methodology is developed to compare experiments performed at macroscopic scale in a pilot blender and at mesoscopic scale in the FT4 powder rheometer. 2.3.1. In-mixer rheology
The macroscopic rheology is performed in a pilot scale convective blender Triaxe®. It is a four bladed mixer that has already shown its ability to blend powders[14]and has been described in[4]. This blender is planetary since its blades spin over two axes (Fig. 8). This leads to a rotational motion that stirs the powder and a gyrational motion that distributes this agitated zone all over the vessel. The rotational and the gyrational torques are measured with two torque-meters.
Empty vessel torque measurements are first performed without powder in the tank, and are respectively denoted as Tg0and Tr0for the gyrational and rotational torques. In-charge gyrational and rotational
x
s 0.1 0.2 0.3 0.4 0.5 0.6 0.7 0.8 0.9 1 0.2 0.3 0.4 0.5 0Ta
pp
ed
p
or
os
ity
x
s 0.1 0.2 0.3 0.4 0.5 0.6 0.7 0.8 0.9 1 0.2 0.3 0.4 0.5 0Ta
pp
ed
p
or
os
ity
a
b
Fig. 4. Porosity profile of mixtures semolina-lactose (a) and semolina-fine lactose (b) according to model 1, xsis the mass fraction of lactose/fine lactose.
500 m
100 m
a
b
Fig. 5. Semolina-lactose (a) and semolina-fine lactose (b) ordered mixtures with lactose and fine lactose deposited on semolina grains.
torques (respectively Tgfand Trf) are registered afterwards with the loaded vessel. These torques are measured for different combinations of motor rotational speed ωrmand motor gyrational speed ωgmthat can reach 3000 rpm (rpm). The corresponding angular blade speeds are smaller because of mechanical reduction, the maximal blade gyrational speed value being 20 rpm and the maximal blade rotational speed value 100 rpm.
Experiments with the five single powders and the mixtures M1and M2are performed with 30 kg of powder. A volume based filling ratio f is calculated considering that the powder inside the blender is in a loose bulk state so un-tapped bulk densities measured in the volumenometer (seeTable A-1) were used. This ratio is typically around 0.9, which corresponds to the nominal operating conditions of the Triaxe®, but some values exceed 1 for talc and fine lactose. Indeed these powders had to be slightly compacted to be poured into the vessel.
Coating step
Pore filling
Inclusions of
big particles
Fraction in small particles
Fig. 6. Packing model 2 for binary mixtures of small and big particles.
x
s 0.1 0.2 0.3 0.4 0.5 0.6 0.7 0.8 0.9 1 0.2 0.3 0.4 0.5 0Ta
pped
porosity
x
s 0.1 0.2 0.3 0.4 0.5 0.6 0.7 0.8 0.9 1 0.2 0.3 0.4 0.5 0Ta
pp
ed
p
or
os
ity
a
b
Fig. 7. Porosity profile of mixtures lactose-semolina (a) and semolina-fine lactose (b) according to model 2, xsis the mass fraction of lactose/fine lactose.
Rotation
Gyration
a
b
Fig. 8. Agitation device of the Triaxe® blender with its spherical vessel (a) and without the vessel showing rotational and gyrational directions (b).
For the five single powders, the influence of the filling ratio f is investigated through experiments with two different filling ratios: 0.42 and 0.83.
The torques and motor angular speeds, in N·m and rad·s−1 respectively, allow calculating the mechanical power P needed to stir the powder bed (Eq.(9)).
P ¼ ωgm∙ T" gf−Tg0#þ ωrm∙ Tð rf−Tr0Þ ð9Þ
For more detailed information about the protocol and calculations, the reader can refer to a previous study dedicated to powder rheology with this planetary blender[4]. The measurements in the Triaxe® have already been described in this previous study for the five single powders and for the mixtures M1and M2. Concerning single powders, Legoix et al.[4]have expressed results as the power P needed to stir the powder against the characteristic blade tip speed uch, that has been calculated from rotation and gyration movements as proposed and discussed by Delaplace et al.[18]and André et al.[19]. It has been shown that the power increases almost linearly with uchfor free flowing powders. For cohesive powders the power increases more with uchfor the smaller stirring speeds than for the largest speeds. It is thought that at high speed of agitation the shear stress is developed in the whole bulk and the powder is put in motion in a quasi-fluidization state. In consequence, the value of the power needed to agitate free-flowing powders is globally larger than that of the cohesive ones. Concerning the study of mixtures, the power consumption will be presented as a specific power Pm, to be compared with the rheological results at mesoscopic scale.
2.3.2. Rheology from measurements of flowability
The Aerated Energy has been measured at mesoscopic scale in the FT4 rheometer with the aeration device. The blade tip speed varied from 10 to 100 mm·s−1and air velocity was up to 6 mm·s−1. The en-ergy without aeration has also been measured at the same blade speeds. In order to compare results with in-mixer rheology, AE is divided by the mass of powder in the cell and the duration of the measurement to calculate a specific power Pm[W·kg−1]. Power charts are built by plotting Pmas a function of a characteristic blade tip speed calculated by dividing the blade tip speed by π in order to be consistent with in-mixer rheology.
3. Results of characterizations
The bulk powder density ρband the tapped powder density ρt, measured with the volumenometer (Erweka®), are presented in
Appendix A,Table A-1. 3.1. Flowability of single powders
Table 3represents all the mesoscale characterizations that have been carried out for the five single powders. Carr Index and Flow Rate Index indicate that semolina is effectively a free-flowing powder and the others can be considered as cohesive.
A ranking of each characteristic can be given (Table 4). If we consider that
- the larger Carr Index, FRI and Cohesion are, the more cohesive the powder is; and
- the smaller the AE is, the more cohesive the powder is.
Semolina is ranked as the least cohesive powder by every mesoscale testing. Lactose has the second place for every measurement, except for cohesion for which it is considered as more cohesive than talc and sand. These four characterizations are in agreement to distinguish free-flowing and cohesive powders. However they are not able to provide a coherent ranking between cohesive powders (A/C groups). This is all the more obvious for fine lactose, talc and sand which are in the same range of particle's size (d50 = 16, 26, 33 μm respectively): their differences in other properties such as shape and density for instance are prevailing in the different operating conditions and stress states of the characterizations.
3.2. Flowability of mixtures
Small amounts of mixtures are prepared for each characterization. 110 g of powders are hand-mixed with a spatula. Segregation could occur during the tests but was not visually observed in spite of the slight difference of color between semolina and lactose.
Fig. 9gathers the mesoscale characterizations of flowability for mixtures M1and M2, as a function of the cohesive powder mass content x, which is lactose for M1and fine lactose for M2. The errors for Carr Index measurements represent the standard deviation of the repeat-ability of two experiments for M1and of three experiments for M2, since fine lactose bulk density measurements are less reproducible. The poor reproducibility of the Carr Index measurements for high lac-tose contents is attributed to the difficulties in assessing accurately the volume of cohesive powders in the volumenometer as far as the surface of the powder is not horizontal. A systematic repeatability of measure-ments of cohesion, Flow Rate Index and Aerated Energy as a function of the lactose's content has not been done.
For a given mass fraction of cohesive powder, Carr Index, Flow Rate Index and cohesion of M2are larger than M1, which corresponds to the more cohesive character of fine lactose (seeTable 3).
From the general tendencies of these charts, we can see that Carr Index, Flow Rate Index and cohesion for M1and M2are increasing functions of the mass content of the two lactose powders, varying from values of single semolina to single lactose. Each of these two
Table 3
Powder mesoscale characterizations.
Characteristic Semolina Lactose Fine lactose Talc Sand CI (%) 5.8 ± 0.3 16.9 ± 0.9 22.4 ± 2.7 40.9 ± 0.8 24.4 ± 0.1 FRI 0.89 ± 0.07 1.25 ± 0.16 2.09 ± 0.09 2.09 ± 0.03 2.34 ± 0.03 Cohesion (kPa) 0.24 ± 0.10 0.75 ± 0.12 1.12 ± 0.13 0.54 ± 0.07 0.59 ± 0.04
AE (mJ) 558 ± 48 317 ± 38 172 ± 19 131 ± 22 64 ± 6
Table 4
Powder ranking by mesoscale characterizations, from free-flowing (1) to cohesive (5).
Rank 1 2 3 4 5
CI (%) Semolina Lactose Fine lactose Sand Talc FRI Semolina Lactose Talc/fine
lactose
Talc/fine lactose
Sand Cohesion (kPa) Semolina Talc Sand Lactose Fine lactose AE (mJ) Semolina Lactose Fine lactose Talc Sand
blends is made up of particles of similar shapes and densities. In these conditions the three methods are consistent. The results corresponding to the more cohesive mixtures are rather scattered. They may be affected by the powder handling conditions when the different test devices are filled.
Concerning the Aerated Energy's chart, we can see that lactose's AE is lower than that of semolina, which is consistent with the Geldard's clas-sification. In opposition to the other characteristics, AE of mixes does not decrease from the semolina's value to that of lactose but shows a mini-mum. The lactose content at the minimum is approximately 0.5 for M1 Fig. 9. Characterization of mixtures of semolina-lactose M1and semolina-fine lactose M2at meso-scale, for different cohesive powder mass fraction xs.
and 0.4 for M2. Looking closer at Carr Index chart shows that for both mixtures CI increases with lactose fraction until this threshold value of lactose's content; afterwards CI looks dispersed around the Carr Index of the cohesive component. This threshold value of lactose content should correspond to a particular structure of the mixes, which has no effect on cohesion or FRI measurements. For cohesion determination in shear cell and FRI measurements, powders are pre-conditioned in a compacted state and the measures run with a shearing device moving through the powder. If a special structure of the mixes exists for a critical content of lactose it should be disrupted under these conditions. It is not the case in the two other characterizations while powders are not compacted by pre-conditioning step and no shearing device is involved. The next part will give a better insight on the structure of the mixtures as a function of their composition.
3.3. Microscopic structure of the mixtures
The microscopic structures of M1and M2are evaluated through their porosities. These are calculated from the measurements of the true density of the particles ρpand the tapped density of the blends ρt (Eqs.(3) and (4)) and further plotted as a function of the proportion in fine particles of the blends xs.Fig. 10shows that both porosities are reaching a minimum. This most compact structure of the blends is obtained at x = 0.5 for M1and x = 0.4 for M2.
The theoretical calculation of pore filling of the packing of semolina with cohesive particles has been represented onFig. 11, according to model 1 and model 2 and compared to experimental measurements.
The experimental and calculated minima of porosity are reported in
Table 5.
In model 1 since fine particles are mixed with semolina, the porosity decreases drastically as the content in cohesive powder increases until a most compact structure of the mixes is reached. For larger contents of lactose the medium is supposed to be a bulk of lactose which contains some scattered particles of semolina. Conversely in model 2 porosity of packing is constant until the big particles of semolina are coated by a monolayer of lactose. The most compact state of the mix is reached for a larger lactose content than with model 1. Both models agree beyond this content of lactose. According to the particle size distribu-tion, a smaller fine lactose content than lactose content is needed to reach the most compact structures.
On the first part of the charts, where the bulk is considered as a structure of semolina particles with inclusions of lactose, porosities described by the two models are vastly different and experimental porosities trend like model 1, with values situated between the two models. Models 1 and 2 of particles packing are two extreme descrip-tions of the structure of the blends M1and M2. Experimental data are in between the two models: it suggests that even if lactose is filling
Fig. 11. Comparison between experimental (points) and theoretical tapped densities for M1(a) and M2(b) according to model 1 (dotted lines) and model 2 (continuous lines).
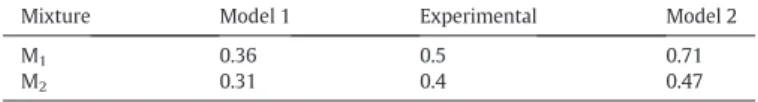
Table 5
Cohesive powder mass fraction xminat the minimum of porosity.
Mixture Model 1 Experimental Model 2
M1 0.36 0.5 0.71
semolina's porosity, coating may occur, in agreement with observations onFig. 5. Thereby particles of semolina are supposed partially coated with lactose when the blends contain small amounts of lactose. Their size is close to that of semolina, contacts between particles of lactose are scarce and the bulk can still be considered as free-flowing, which is consistent with the results of characterizations reported onFig. 9. Beyond the minimum of porosity of model 2, the two models are identical and represent fairly the experimental data. Above this point, the mixtures can be considered as lactose filled with semolina where contacts between particles of lactose are dominating. It is worthy to note that although particles of semolina and lactose are not strictly spherical nor monodispersed the experimental porosities measured for a mass fraction of lactose under 0.2 fit model 1 and the largest fit the two models. Experimental data trend like models for simple packing states when coating is not involved.
The threshold values observed in the characterization results (Fig. 9) correspond to the composition of the most compact blends (xmin,
Table 5). At these compositions, there are no more contacts between semolina particles, whether the powder is packed, compacted or aerated. In this case, the flowing behavior of the blends is close to that of lactose or fine lactose. In the specific conditions of aerated measure-ments in the FT4, this particular composition corresponds to the structure that need the minimum energy of agitation as if powders were lubricated by one another.
4. Results of rheological measurements
Rheological measurements are performed at macroscopic scale for the twenty-three powders and compared to mesoscopic scale charac-terizations for the five single powders.
4.1. Single powders
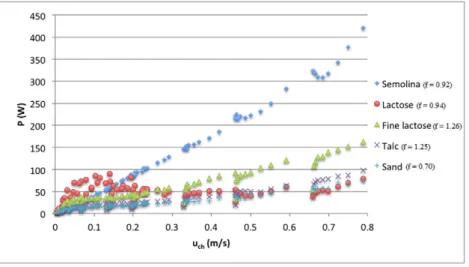
Results of the in-mixer rheology in the Triaxe® show a significant difference in power requirements for stirring free flowing and cohesive powder (Fig. 12). For semolina power increases almost linearly with the agitation speed whereas it is always smaller for cohesive powders (lactose, fine lactose, talc, sand) beyond a critical value of uch. This behavior has been previously described by Legoix et al.[4]: it is related to the fact that the entire volume of free-flowing powder is concerned by agitation while it is not the case for cohesive powders for which authors had shown that gyration motion plays an important role to transmit the power of agitation through the bulk.
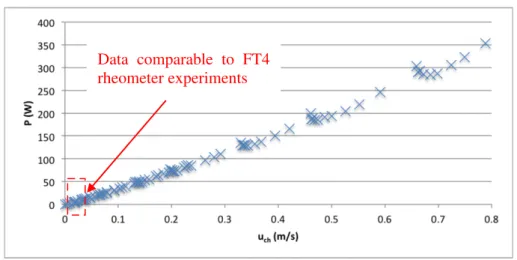
Fig. 13compares in–mixer rheology experiments to the mesoscopic characterizations in the FT4 rheometer, with and without aeration. For the sake of comparison, the characteristic tip speeds uchis limited to
35 mm·s−1 in order to stay in the range of tip speed of the FT4 rheometer (seeFig. 14). It is reminded here that according to Delaplace et al.[18]uchis the linear tip speed divided by π.
Experiments in the Triaxe® were done at two different filling ratios f and it is expected that the bulk of powder is in a looser state when f is lower. The rheological experiments are sensitive to the apparent density of the powder. Indeed on these charts, we see that aerating the FT4 cell or pouring a smaller volume of powder in the mixer leads to a decrease of the power involved in agitation.
For the five powders, the values recorded in the pilot mixer are of the same order of magnitude than for the mesoscale measurements. Semolina, fine lactose and talc behave the same in the mixer as in the aerated FT4 cell. Specific powers for lactose and sand give intermediate values between tests with and without aeration. For the highest filling ratio, the behavior is closer to FT4 rheometer measurements without air, meaning that there is a more compact flow inside the blender. We conclude from this, that the packing state in the mixer is mostly aerated by the action of the blades but can be locally compacted especially when cohesive powders are involved.
4.2. Mixtures M1and M2
A similar P vs uchchart is given inFig. 15, so as to examine the impact of the content in cohesive powder in the mixtures on the rheological behavior. The rheological signatures of the blends are free-flowing-like, i.e. power increases almost linearly with agitation speed, when the content of lactose or fine lactose is small (up to 20%) and tend gradually towards a cohesive-like behavior when it is larger.
In order to study more accurately the influence of the composition of the mixtures on the in-mixer rheology we have plotted the power needed to stir powder as a function of the composition of the two kinds of mixtures M1and M2(Figs. 16(a) and (b) respectively). Small (0.09 m·s−1), medium (0.39 m·s−1) and large (0.72 m·s−1) values of uchhave been chosen in order to span the range of agitation conditions in the mixer.
Power consumption does not evolve monotonously with lactose or fine lactose content. At the smaller speed of agitation, power does not vary significantly as a function of the lactose content in mixtures M1and M2. On the opposite, at medium and high speeds, the power drastically decreases towards a minimum as lactose content increases. This minimum is observed for 70% in M1and 50% in M2.
These two limit values of lactose content for the minimum of power are close to the theoretical composition for the more compact packing porosity calculations of model 2, which suggests that the pore filling of coated particles occurs at 71% and 47% of cohesive powder proportion
Fig. 13. Specific power of semolina (a), fine lactose (b), talc (c), lactose (d) and sand (e), dotted line representing meso-scale measurements for different air velocities, and crosses representing macro-scale measurements for different filling ratios.
for M1and M2, respectively (Table 5). We assume that beyond these compositions, rheology is dominated by the contacts between lactose or fine lactose particles and for lactose contents smaller than this
specific composition, the bulk is assumed to be a structure of grains of semolina filled with small particles of lactose which behavior is domi-nated by contacts between grains of semolina.
Fig. 13 (continued).
Data comparable to FT4
rheometer experiments
These particular compositions define two different blends behaviors. In the first part of the chart, the powder is widely dependent on the stirring speed. Then at the specific compositions the power does not depend on the agitation speed anymore, as if the forces exerted on the blades were inversely proportional to the rotational speed. This corresponds to the minimum of Aerated Energy of agitation measured in the FT4 rheometer for a lactose content around 50%. For these compositions of the blends there is a noteworthy microstructure of the bulk which has a similar behavior whether the scale of observation is meso- or macroscopic.
5. Discussion
Different scales of observation and states of consolidation have been investigated (seeTable 6) by means of rheology experiments and characterization of powders.
In their study, Leturia et al.[11]defined three states of consolidation for powders to cover the usual range of stress level in processes. They are aerated conditions as in a fluidized bed, low stress or free-surface
conditions as in a rotating drum, and packing conditions as during com-paction. They can be associated to the characterization devices used in this study.
Porosity estimation needs measurements of bulk and true densities, respectively performed at meso- and microscopic scales under free-surface and packed conditions. However, it has a physical signification at the scale of particles. This is the reason why it has been placed in
Table 6as a particle's scale characteristic: it describes the packing of particles and requires at least a measurement at microscopic scale.
Apart from semolina, all the cohesive powders tested showed different relative compacities (Eq.(10)) during the different flowability measures carried out (Table 7). The relative compacity of a given pow-der refers to the larger compacity obtained among the different tests, that is actually the compacity after 1000 taps in the volumenometer. The compacity given for the FT4's aerated cell is calculated with the height of the bed under aeration (vairis 6 mm·s−1).
Compacity ¼ ρb=ρp ð10Þ
a
b
For this reason, it was considered that these different tests correspond to different consolidation states of the powders tested. Aerated Energy and Flow Rate Index are clearly measured at mesoscopic scale, in aerated and free-surface conditions. Carr Index is a mesoscopic test, the consolidation state of the powder during the measurement is going from free-flowing to packed conditions. Cohesion is considered here as a mesoscopic characteristic under packed conditions. It is a characteristic usually interpreted as the attraction strength between particles at microscopic scale, but this is measured with a shear cell at mesoscopic scale.
In addition, the power measurement in the Triaxe® blender at macroscopic scale has been considered as a free-surface measurement, since globally the stress exerted on powder could be considered as
small, and is not controlled, like it could be if air was injected or a normal stress applied like in the FT4 rheometer.
5.1. Mesoscopic scale: influence of the consolidation state
In order to compare the flow characteristics measured at different states of consolidation, the results obtained for the twenty-three pow-ders have been plotted onFigs. 17–19. Since Carr Index is widely used to evaluate the flow properties of powders, it will be plotted as a refer-ence. CI smaller than 15 mark out free-flowing powders and CI larger than 22 mark out cohesive ones.
Two free-surface condition measurements, FRI and CI, are compared onFig. 17. As expected, for all the mixtures and single powders
a
b
Fig. 16. Evolution of the power in the Triaxe® blender against the lactose and fine lactose compositions in semolina-lactose mixtures M1(a) and semolina-fine lactose M2(b).
Table 6
Representation of measurements under different scales and consolidations.
Scale / Consolidation Aerated Free-surface Packed
Particle’s scale Porosity
Mesoscopic Aerated Energy Flow Rate Index Cohesion
Carr Index
investigated, the FRI is close to 1 for free flowing. Poorly flowing powders exhibit a FRI greater than 1.5. The FRI and the CI are well correlated, except for talc that shows a behavior out of the tendency of the other powders. This is probably due to the platelet shape of its particles, that allows the particles to reorganize during tapping in the volumenometer.
Fig. 18compares cohesion measured under packed state conditions and CI. As a global tendency, cohesion increases as CI increases but results are scattered. For cohesive powders, with CI greater than 15, co-hesion and CI do not rank the powders in the same order since values are too dispersed. CI seems more appropriate to distinguish well flowing powders, whereas cohesion is more discriminating for interme-diate and poorly flowing powders.
AE and CI are compared onFig. 19. AE globally decreases with CI. For well flowing powders, the two characteristics seem well correlated. For powders with CI greater than 15, the AE is dispersed around 100 mJ, meaning that the AE and CI qualify the powder behavior in non-comparable conditions.
The four characterizations are in agreement to distinguish free-flowing and cohesive powders but fail to provide a coherent ranking be-tween cohesive powders. At mesoscopic scale, the state of consolidation is a key parameter to take into account, especially for cohesive powders. 5.2. Multiscale analysis
Studies on microstructure of packing of mixtures M1and M2revealed that when lactose or fine lactose is mixed into semolina, fine particles preferentially coat the largest before filling the interparticular porosity,
and mixtures still demonstrate a free-flowing behavior. Beyond the criti-cal composition that corresponds to the minimum of the packed porosity, the behavior of the powder at meso- and macroscopic scales is dominated by the contacts between lactose or fine lactose particles. At the critical composition, mesoscopic Aerated Energy and macroscopic power reach a minimum as if particles were lubricated one by another.
The macroscopic scale in-mixer rheological measurements of semo-lina, lactose, fine lactose, talc and sand are comparable to mesoscopic scale experiments. In the range of tip speed studied, the macroscopic specific power lays between aerated and non-aerated experiments on the FT4 rheometer. Different consolidation states may co-exist in the convective mixer, especially for cohesive powders:
- Compacted (ahead of the blades and furthermore with high filling ratio)
- Loose bed packing (flow of particles under shear of blades and free-surface flow)
- Aerated bulk (probably due to avalanches behind the passage of blades)
6. Conclusion
The aim of this study was to investigate the link between small scale characterization of powders and mixtures and their rheology in a 48 L planetary blender. Two main issues were addressed:
- the importance of the state of consolidation of the bulk in the different characterization set-ups in relation with the flowing of powders at the mixer's scale; and
- the link between the structure of the mixtures at particle's scale and the flowability of these mixtures during mesoscale characterization and their agitation in the planetary blender.
Powder flowability at various consolidation states and at different scales of observation was characterized. To compare these experiments and explain some phenomena, typical characteristics have been determined: the powder bed porosity, the tapped and true densities, the power consumption of the apparatus and a characteristic velocity
talc
Good flow
Intermediate flow
Poor flow
Fig. 17. Flow Rate Index measurements related to the Carr Index, for single powders and mixtures. Table 7
Relative compacity of single powders among the tests, in the corresponding experimental set-ups.
Relative compacity among the tests
Experimental set-up Semolina Lactose Fine lactose Talc Sand FT4 AE cell - vair6 mm·s−1 0.62 0.51 0.51 0.48 0.57
Volumenometer un-tapped 0.94 0.83 0.78 0.59 0.73 FT4 FRI cell 0.93 0.83 0.83 0.73 0.93 FT4 shear cell - 4 kPa 0.94 0.92 0.96 0.83 0.99 Volumenometer 1000 taps 1.00 1.00 1.00 1.00 1.00
of its impeller. A set of twenty-three powders has been involved is this study, including single powders and mixtures.
Characterizations of the free-flowing powders at the different scales are in good agreement. For free-flowing powders, particles are flowing ac-cording to gravity: they are not really sensitive to local aeration or com-paction. On the opposite, flowability of cohesive powders is difficult to rank from different types of measurements because the compaction state of the bed influences their characterization. If the objective is to de-termine powders behavior at process scale, it is important to characterize them in the same range of consolidation conditions. As an illustration, macroscopic rheological measurements in the pilot planetary blender have been compared with mesoscopic measurements in a FT4 rheometer
for a limited range of stirring speeds. The specific powers observed in the blender for single powders are in-between aerated and non-aerated experiments on the FT4 rheometer. Since the consolidation state is not homogeneously distributed in the entire volume of the mixer, local states in the blade neighborhood might control rheology. Estimation of the distribution of states of compaction in the mixer should provide valuable information to go further in this study. It is still an unsolved issue since the tank is opaque (made of stainless steel) and it is impossible to introduce any probe inside when agitation is running.
Furthermore, in-mixer rheology experiments highlighted two different rheological signatures for free-flowing and cohesive powder. From comparisons between in-mixer rheology of semolina
(free-talc
Fig. 19. Aerated Energy and Carr Index of powders and mixtures, for single powders and mixtures.
talc
flowing), lactose (cohesive) and semolina-lactose blends of various concentrations, it was observed that blend behavior is dominated by the microscopic structure of the blend. This has been also observed for characterizations at mesoscale. Collective behavior can be free-flowing when the bulk is a structure of particles of semolina filled with particles of lactose or cohesive-like when dominated by contacts between lactose particles. Moreover, for a range of compositions resulting in the minimum of blend porosity, the structure of the mixes induces a special rheology that should be thoroughly studied. A better insight on the effect of a blade moving through blends of particles is needed, especially for mixing process design.
There are two main issues in perspective. The first is to work, at mixer scale, in a transparent tank in order to link flowing regimes and flowing mechanisms to the rheological measurements. It will be per-formed in the near future in a laboratory convective bladed blender built for this purpose, for rotation only. The second issue should be to go further into mixture rheology at meso and macroscopic scales, by studying different structured mixtures and their local segregation near-by the blades. To finish, the outcomes of this work ought to be integrat-ed in a mixing model of the simplifiintegrat-ed mixing device first and then in a complete one for the planetary blender.
Nomenclature
AE Aerated Energy, (J)
CI Carr Index, (−)
d50 Median diameter, (m)
E Flow energy, (J)
E10 Flow energy measured at 10 mm·s−1, (J)
E100 Flow energy measured at 100 mm·s−1, (J)
f Volume based fill fraction of the mixer, (−)
FRI Flow Rate Index, (−)
mb Mass of a big particle, (kg)
ms Mass of a small particle, (kg)
nsc Number of small particles needed to coat a big particle, (−)
P Power, (W)
Pm Specific power, (W·kg−1)
r Radius of a small particle, (m)
R Radius of a big particle, (m) T Torque, (N·m)
Tg Gyration torque, (N·m)
Tg0 Empty vessel gyration torque, (N·m)
Tgf Filled vessel gyration torque, (N·m)
Tr Rotation torque, (N·m)
Tr0 Empty vessel rotation torque, (N·m)
Trf Filled vessel rotation torque, (N·m)
uch Characteristic blade tip speed, (m·s−1)
vair Air velocity during FT4's aeration tests (mm·s−1)
x Mass fraction, (−)
xi Mass fraction of a component i, (−)
xs Mass fraction of small particles, (−)
xsc Mass fraction of small particles needed to coat larger particles,
(−)
xscf Mass fraction of small particles needed to coat larger particles
and fill the porosity between larger particles, (−)
xsf Mass fraction of small particles needed to fill the porosity
between larger particles, (−)
Greek letters
ε Porosity, (−)
ε1 Packed porosity according to model 1, (−) ε2 Packed porosity according to model 2, (−) ρ Density, (kg·m−3)
ρ1 Packed density according to model 1, (kg·m−3)
ρ2 Packed density according to model 2, (kg·m−3)
ρb Bulk density, (kg·m−3)
ρm Mean particle density of a mixture, (kg·m−3)
ρp Particle density, (kg·m−3)
ρpb Particle density, big particles, (kg·m−3)
ρpi Particle density of a component i, (kg·m−3)
ρps Particle density, small particles, (kg·m−3)
ρt Tapped density, (kg·m−3)
ρtb Tapped density, big particles, (kg·m−3)
ρts Tapped density, small particles, (kg·m−3)
ω Angular speed, (rad·s−1)
ωgm Gyration motor angular speed, (rad·s−1)
ωrm Rotation motor angular speed, (rad·s−1)
Acknowledgements
We would like to thank Laurent Devriendt and Manon Bru, respectively a technician and an internship student at RAPSODEE research center, for their contribution in powder characterization. Appendix A
Table A-1
Powder bulk density, tapped density and Carr Index. Mixture properties are noted by wt%: M1(semolina:lactose) and M2(semolina:fine lactose).
Powder ρb(kg·m−3) ρt(kg·m−3) Carr Index (%)
Semolina 679 720 5.8 Lactose 661 795 16.9 Fine lactose 495 638 22.5 Talc 501 848 40.9 Sand 887 1222 27.4 M1(10:90) 724 792 8.6 M1(20:80) 761 840 9.4 M1(30:70) 793 901 12.0 M1(40:60) 817 935 12.6 M1(50:50) 781 946 17.4 M1(60:40) 761 929 18.1 M1(70:30) 744 900 17.3 M1(80:20) 695 864 19.6 M1(90:10) 685 824 16.9 M2(10:90) 704 766 8.1 M2(20:80) 706 816 13.5 M2(30:70) 698 854 18.2 M2(40:60) 681 859 20.7 M2(50:50) 655 833 21.4 M2(60:40) 599 785 23.6 M2(70:30) 582 741 21.5 M2(80:20) 517 697 25.9 M2(90:10) 482 660 26.9 References
[1]A. Elia, M. Cocchi, C. Cottini, D. Riolo, C. Cafiero, R. Bosi, E. Lutero, Multivariate data analysis to assess dry powder inhalers performance from powder properties, Pow-der Technol. 301 (2016) 830–838.
[2]I. Gijon-Arreortua, A. Tecante, Mixing time and powder consumption during blend-ing of cohesive food powders with a horizontal helical double-ribbon impeller, J. Food Eng. 149 (2015) 144–152.
[3]R.P. Kingsly Ambose, Shumaila Jan, Kaliramesh Siliveru, A review on flow character-ization methods for cereal grain-based powders, J. Sci. Food Agric. 96 (2015) 359–364.
[4] L. Legoix, C. Gatumel, M. Milhé, H. Berthiaux, Rheology of cohesive powders in a pilot scale planetary blender, Powder Technol. 305 (2017) 609–619.
[5] J. Bridgwater, Fundamental powder mixing mechanisms, Powder Technol. 15 (1976) 215–236.
[6]A. Gioia, Intrinsic Flowability: A New Technology for Powder-flowability Classifica-tion, Pharmaceutical Technology Magazine, February 1980.
[7]R. Carr, Evaluating flow properties of solids, Chem. Eng. J. 72 (1965) 163–168.
[8]H.H. Hausner, Friction conditions in a mass of metal powder, Int. J. Powder Metall. 3 (1967) 7–13.
[9]D. Schultze, Powders and Bulk Solids, Springer-Verlag, Berlin Heidenberg, 2008.
[10] R. Freeman, Measuring the flow properties of consolidated, conditioned and aerated powders - a comparative study using a powder rheometer and a rotational shear cell, Powder Technol. 174 (2007) 25–33.
[11] M. Leturia, M. Benali, S. Lagarde, I. Ronga, K. Saleh, Characterization of flow properties of cohesive powders: a comparative study of traditional and new testing methods, Powder Technol. 253 (2014) 406–423.
[12] S.V. Sogaard, T. Pedersen, M. Alleso, J. Garnaes, J. Rantanen, Evaluation of ring shear testing as a characterization method for powder flow in a small-scale powder pro-cessing equipment, Int. J. Pharm. 475 (2014) 315–323.
[13] S. Mandato, T. Ruiz, B. Cuq, What is Janssen's length doing in an agglomerator? Pow-der Technol. 238 (2013) 56–63.
[14] J.-F. Demeyre, Caractérisation de l'homogénéité de mélange de poudres et de l'agitation en mélangeur Triaxe® (Thèse de doctorat), Institut National Polytechnique, Toulouse, France, 2007.
[15] D. Geldart, Types of gas fluidization, Powder Technol. 7 (1973) 285–292.
[16] R. Ben Aïm, P. Le Goff, Effet de paroi dans les empilements désordonnés de sphères et application à la porosité de mélanges binaires, Powder Technol. 1 (1968) 281–290.
[17] G. Thomas, Y. Ouabbas, P. Grosseau, M. Baron, A. Chamayou, L. Galet, Modelling the mean interaction forces between powder particles - application to silica gel-magnesium stearate mixtures, Appl. Surf. Sci. 255 (2009) 7500–7507.
[18]G. Delaplace, R. Thakur, L. Bouvier, C. André, C. Torrez, Dimensional analysis for planetary mixer: mixing time and Reynolds number, Chem. Eng. Sci. 62 (2007) 1442–1447.
[19] C. André, J.F. Demeyre, C. Gatumel, H. Berthiaux, G. Delaplace, Derivation of dimen-sionless relationships for the agitation of powders of different flow behaviours in a planetary mixer, Powder Technol. 256 (2014) 33–38.