HAL Id: hal-00841027
https://hal.archives-ouvertes.fr/hal-00841027
Submitted on 22 Jul 2013HAL is a multi-disciplinary open access archive for the deposit and dissemination of sci-entific research documents, whether they are pub-lished or not. The documents may come from teaching and research institutions in France or abroad, or from public or private research centers.
L’archive ouverte pluridisciplinaire HAL, est destinée au dépôt et à la diffusion de documents scientifiques de niveau recherche, publiés ou non, émanant des établissements d’enseignement et de recherche français ou étrangers, des laboratoires publics ou privés.
Effects on CHP plant efficiency of H 2 production
through partial oxydation of natural gas over two group
VIII metal catalysts
Olivier Le Corre, Khalil Saikaly, Marc A. Rosen
To cite this version:
Olivier Le Corre, Khalil Saikaly, Marc A. Rosen. Effects on CHP plant efficiency of H 2 production through partial oxydation of natural gas over two group VIII metal catalysts. International Journal of Hydrogen Energy, Elsevier, 2012, 37 (13), pp.10380-10389. �10.1016/j.ijhydene.2012.04.015�. �hal-00841027�
EFFECTS ON CHP PLANT EFFICIENCY OF H2 PRODUCTION
THROUGH PARTIAL OXYDATION OF NATURAL GAS OVER TWO GROUP VIII METAL CATALYSTS
O. Le Corre1, K. Saikaly2 and M. A. Rosen3
1 GEPEA – Ecole des Mines de Nantes – CNRS - UMR 6144, 4 rue A. Kastler – BP 20722 – F 44307 Nantes, France
2 CREED, Research center of VEOLIA Environment, 291 av D. Dreyfus, 78520 Limay, France
3 Faculty of Engineering and Applied Science, University of Ontario Institute of Technology, Oshawa, Ontario, L1H 7K4,Canada
Corresponding author: lecorre@emn.fr Phone : (+33) 2 51 85 82 57
Fax : (+33) 2 51 85 82 99 *Manuscript
ABSTRACT
1 2
Blending H2 with natural gas in spark ignition engines can increase for electric efficiency. In-situ H2
3
production for spark ignition engines fuelled by natural gas has therefore been investigated recently, and
4
reformed exhaust gas recirculation (RGR) has been identified a potentially advantageous approach: RGR 5
uses the steam and O2 contained in exhaust gases under lean combustion, for reforming natural gas and 6
producing H2, CO, and CO2. In this paper, an alternative approach is introduced: air gas reforming circulation 7
(AGRC). AGRC uses directly the O2 contained in air, rendering the chemical pathway comparable to partial 8
oxidation. Formulations based on palladium and platinum have been selected as potential catalysts. With
9
AGRC, the concentrations of the constituents of the reformed gas are approximately 25% hydrogen, 10%
10
carbon monoxide, 8% unconverted hydrocarbons and 55% nitrogen. Experimental results are presented for
11
the electric efficiency and exhaust gas (CO and HC) composition of the overall system (SI engine equipped
12
with AGRC). It is demonstrated that the electric efficiency can increase for specific ratios of air to natural gas
13
over the catalyst. Although the electric efficiency gain with AGRC is modest at around 0.2%, AGRC can be
14
cost effective because of its straightforward and inexpensive implementation. Misfiring and knock were both
15
not observed in the tests reported here. Nevertheless, technical means of avoiding knock are described by
16
adjusting the main flow of natural gas and the additional flow of AGRC.
17 18
Keywords: Hydrogen, CHP, natural gas, power,
19 20
1. INTRODUCTION
21 22
Efforts to improve the performance of internal combustion (IC) engines (e.g., brake mean effective pressure,
23
specific fuel consumption) are nowadays limited by both stringent emissions regulations and abnormal
24
combustion problems (knock, engine misfiring). These limitations are particularly important for lean burn natural
25
gas engines that are used for combined heat and power (CHP) applications. Examples of such constraints are
26
shown in Figure 1, where engine performance parameters are plotted against equivalence ratio. Improving the
27
electric efficiency of stationary IC engines fuelled by natural gas should not cause any of the above noted
28
constraints to be exceeded. The window between knock and combustion misfire is narrow, as shown in the left
29
diagram of Figure 1, and can occur for an equivalence ratio in the range 1.7 to 2.0, common tuning for CHP
30
applications. Nevertheless, specific emissions are relatively low in this equivalence ratio range, as shown in the
31
right diagram of Figure 1, suggesting that a good compromise among these factors is attained by operating in
32
this equivalence ratio range.
33 34
Fig. 1. Variation of selected engine performance parameters with equivalence ratio, highlighting challenges
35
(firing problems, emissions) in improving engine performance
36 37
It has been demonstrated experimentally by Le Corre et al. [1] that the addition of H2 has a positive effect on IC
38
engines fuelled by traditional fuels. Increased H2 content increases the mechanical efficiency of such IC
engines without major increases in engine emissions. The main hindrance related to this measure is the
40
requirement for H2 storage cylinders, especially for transport applications.
41 42
To comply with emissions regulation two main approaches exist according to Einewall et al. [2]: operating under
43
stoichiometric conditions with exhaust gas recirculation and a three-way catalyst, or operating under lean burn
44
conditions.
45 46
In-situ H2 production by steam reforming has been considered for IC engines fuelled by natural gas (e.g., Yap et
47
al. [3]). Such applications are suitable for stationary CHP plants which are not subject to significant weight and
48
volume constraints. In-situ steam reforming involves the following:
49 50
1. The catalytic reforming device is located in the exhaust gases in order to keep it at high
51
temperature (775 K).
52
2. Part of the exhaust gases is used to supply the catalyst with water vapour, oxygen and carbon
53
dioxide,
54
3. Reformed gases (enriched in hydrogen) are then mixed with the intake air and gas line, as is
55
done with exhaust gas recirculation (EGR) technology used in the car industry to reduce NOX
56
emissions for diesel engines.
57 58
Le Corre et al. [1] highlighted the effect of air-fuel ratio on the H2 production for a CHP plant. The higher the
air-59
fuel ratio, the greater is the H2 content in the reformed gases. For example, Le Corre et al. [1] reported that the
60
difference of H2 content is 2% for air-fuel ratios of 1.5 and 1.4. This observation implies that the O2 content limits
61
reactions where it is a reactant. Two such reactions are the complete oxidation of methane and the partial
62
oxidation of methane:
63 64
Complete oxidation of methane: CH4 + 2O2 CO2 + 2H2O (∆H298K =−890kJmol−1) (1)
65
Partial oxidation of methane: CH4 + ½O2 CO + 2H2 (∆H298K =−35.6kJmol−1) (2)
66 67
The individual reactions that contribute to the overall reaction consist of the reforming of CO2 into CO
68
(equation 3), the steam reforming of methane into CO (equation 4), the water gas shift reaction (equation 5),
69
the oxidation of hydrogen (equation 6) and the oxidation of carbon monoxide (equation 7):
70 71 CH4 + CO2 2CO + 2H2 (3) 72 CH4 + H2O CO + 3H2 (4) 73 CO + H2O CO2 + H2 (5) 74 2H2 + O2 2H2O (6) 75 2CO + O2 2CO2 (7) 76 77
For a CHP plant fuelled by natural gas, the O2 content in the exhaust gases is around 7-8% by vol. In this
78
configuration for H2 production, hydrogen makes up around 10-14% by vol. of dry reformed gases. Then, O2
79
content should be an important reactant.
81
Note that the exhaust gases from natural gas CHP plant typically contain three times less than the O2
82
concentration in the air. This circumstance raises a question: Could the system be modified in a way that allows
83
the exhaust gases to be substituted for some of the additional air provided at the reformer inlet?
84 85
The partial oxidation of methane has many advantages compared to steam reforming of methane for hydrogen
86
production. An exothermic reaction, the partial oxidation of methane produces syngas with a H2/CO volumetric
87
ratio of about two, which is ideal for further methanol and Fischer-Tropsch syntheses, according to Hadj-Sadok
88
Ouaguenouni et al. [4]. Many precious metals, such as Ru, Rh and Pt, have been tested as catalysts for the
89
partial oxidation of methane reaction (see Torniainen et al. [5]; Schmidt and Huff [6]). Schmidt et al. [7] and
90
Deutschmann and Schmidt [8] have proposed a model to understand the complex interaction between transport
91
and kinetics involved in the partial oxidation of methane. Some authors have tested a commercial nickel-based
92
catalyst, but this approach was rejected due to activation difficulties. Pd and Pt have been identified as
93
advantageous potential catalysts, and are considered here.
94 95
The main objective of this paper are to investigate the use of partial oxidation of methane as a means of
96
improving H2 production in CHP plant applications, and to examine how the process occurs in the presence of
97
two group VIII metal catalysts (Pt and Pd). It is recognized that this approach must be cost effective for it to be
98
adopted in real applications.
99 100
The concept considered here, which is referred to as air gas reforming circulation (AGRC), is shown in
101
Figure 2. A catalytic reforming device is placed in the exhaust gas flow, but the catalysts do not come into
102
contact with the exhaust gas, as it is used only to heat the catalyst. A chemically active blend of air and
103
natural gas is located over the catalyst. The reformed gases are then mixed with the fresh mixture of fuel
104
and air at the engine inlet. The results are reported in this paper of experimental studies in which two DCL©
105
catalysts are examined: one based on Pt and one on Pd.
106 107 108
Legend: (10) air flow meter, (11) air filter, (12) carburetor, (13) turbocharger, (14) intercooler, (15) actuator, 109
(16) engine, (17) catalyst device, (18) exhaust heat exchanger, (20) natural gas flow meter, (21) Methane 110
Number sensor, (30) additional air flow meter, (40) additional natural gas flow meter, (50) methane number 111
sensor. 112
113
Fig. 2. Engine system incorporating the air gas reforming circulation (AGRC) concept.
114 115
2. EXPERIMENTAL APPARATUS AND PROCEDURE
116 117
The test bench is a spark ignition (SI) engine fuelled by natural gas (see Figure 3). This installation is a
118
combined heat and power plant operating at a fixed engine speed, as specified in Table 1.
119 120
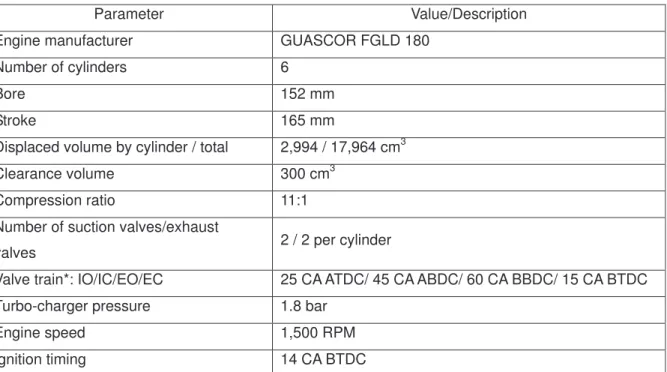
Table 1. Engine specifications.
121 122
Fig. 3. Reforming device installation (at left) on a 210 kWe CHP gas engine (orange).
123 124
The engine generates a constant electrical power of 210 kW during operation. This power output is kept
125
constant by a control loop that acts on a butterfly valve which adjusts the air-gas flow entering the cylinders.
126
The air-fuel ratio is controlled manually by acting on the output of pressure reducer upstream of the
127
carburetor using the Venturi effect [9]. The engine spark advance is kept constant throughout the testing, at
128
14 CABTDC.
129 130
The test bench is equipped with various experimental sensors, corresponding to low frequency
131
measurements (1 Hz). Measurement ranges are shown in parentheses.
132 133
• Thermocouples to measure the catalyst inlet and outlet temperature, and exhaust gas inlet and
134
outlet temperature in the catalyst housing.
135
• A mass flow rate meter for the main natural gas SI engine feed line (0-1200 Nm3/h), and a
136
mass flow rate meter for the additional natural gas at the catalyst inlet (0-600 Nm3/h).
137
• A mass flow rate meter for the intake air (0-1500 kg/h).
138
• Two dry-basis gas analysers:
139
o Engine exhaust gases are analysed with the following:
140
HORIBA VA300 analyser: O2 (0-25%), CO2 (0-20%) CO (0-1%), NO (0-2000 ppm)
141
COSMA Cristal 500 analyser: HC (0-5000 ppm)
142
o Catalyst outlet gases are analysed with the following:
143 ROSEMOUNT NGA2000: H2 (0-30%), O2 (0-30%), CH4 (0-30%), CO (0-30%), 144 CO2 (0-30%) 145 SIEMENS H3-600: CO2 (0-16%) 146 • A wattmeter (ENERNIUM-CFG1). 147
• A mass flow rate meter for the water cooling flow rate of SI engine (0-50 m3/h).
148
• PT sensors to measure the temperatures at several points in water cooling circuit of the engine
149
(PT100, 0-200°C).
150 151
All data were averaged over a period of 15 minutes once steady state operation was achieved. The H2
-152
enhanced engine electrical efficiency ηe is defined as follows:
153 154
(
NG NGR)
e e= LHV qW +q η (8) 155 156Here, qNG denotes the natural gas flow rate (main stream), qNGR the natural gas flow rate for reforming, and
157
LHV the lower heating value of natural gas. The two natural gas flows are shown in Figure 2.
158 159
The catalytic reforming device is illustrated in Figure 4.
160 161
The following experimental procedure was used for the catalytic reforming device shown in Figure 4:
163
1. The additional air flow rate over the catalytic reforming device was set.
164
2. The additional natural gas flow rate at catalyst inlet was set. Consequently, part of natural gas is
165
not converted; this is not a disadvantage of the system since the main natural gas flow rate is
166
decreased correspondingly.
167
3. The equivalence ratio of the SI engine is kept constant by modifying the air flow rate in the main
168
stream. Note that the O2 content in the exhaust line is measured, and provides a straightforward
169
means of maintaining the same condition during the combustion phase.
170 171
Fig. 4. Schematic of catalytic device. UHC denotes unburned hydrocarbons.
172 173 174
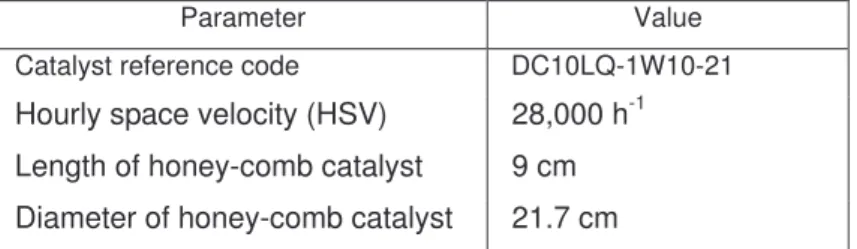
Two commercial honey-comb catalysts of DCL© are tested. These are made of formulations based on Pd
175
and Pt, which are proprietary information of DCL©. Selected features of the catalysts are listed in Table 2.
176 177
Table 2. Features of tested catalysts
178 179
For safety reasons, the following measures were adopted:
180 181
• The system is operated at 80% of its nominal electric power output. This engine operation is
182
less demanding than operation with a full fuel charge.
183
• Some part of additional natural gas flow rate over catalyst does not react. That is, oxygen is
184
completely consumed at the catalyst outlet. This operational condition for the catalyst is safer
185
since it permits auto-ignition of H2 to be avoided.
186 187
The volumetric flow rate over the honey-comb catalyst is a blend of additional air and natural gas for
188
reforming, denoted NGR. Two flow rates for “additional air” are used: 3 and 5 Nm3/h. The range of the
189
volumetric ratio NGR/O2 is bounded between 0.3 and 1.6, regardless of the catalyst, as shown in Figure 5.
190
This volumetric ratio represents the ratio of the volumetric flow rate of natural gas for reforming to the
191
volumetric flow rate of oxygen, in the overall gas flow. It is noted that, in the literature on steam reforming of
192
natural gas, results are typically based on the ratio NGR/H2O (e.g., Peucheret et al. [10]). Nonetheless, in
193
this paper, the significant ratio is NGR/O2.
194 195 196
Fig. 5. Experimental design of flow rates of additional air over the catalyst in the feed line of the SI engine,
197
for various NGR/O2 ratios and catalysts.
198 199
3. RESULTS AND DISCUSSION
200 201
3.1 Catalyst performance in AGRC
202 203
The first results presented concern exclusively the catalyst performance when Air Gas Reforming Circulation
204
(AGRC) is used. All results are given on dry basis. Natural gas and air react chemically over the catalyst; N2
205
is the constituent with the highest concentration at the catalyst input and output. We provide results for H2,
206
CO and unconverted natural gas. To avoid H2 auto-ignition, as explained previously, the experiment is
207
designed to ensure there is no O2 at the catalyst output. The CO2 concentration is around of 6-7% at the
208
catalyst output.
209 210
The primary gases at the exit of the catalyst are shown in Figure 6. In the top two graphs of Figure 6, H2
211
production is seen to depend on the catalyst formulation, and to result in hydrogen concentrations of
212
approximately 26% for the Pd catalyst and 21% for Pt. H2 production also depends on the air flow rate,
213
indicating that fluid dynamic effects are very significant. In the configuration with reformed exhaust gas
214
recirculation (denoted RGR), where exhaust gas is blended with additional natural gas before entering the
215
reformer, Le Corre et al. [1] have shown that H2 production yields a concentration in the reformed gas of only
216
10-14%. The AGRC improves significantly H2 production by promoting the partial oxidation of methane, at
217
temperatures around 775 K. This temperature is not the most favorable for H2 production (the ideal
218
temperature for H2 production is around 1000 K); but the exhaust gases exiting the turbocharger are
219
available at 775 K for use and are otherwise emitted as wastes.
220 221
In Figure 6 (middle two graphs), CO production is observed to be significant, leading to a CO concentration
222
of around 11% for the Pd catalyst and 8% for Pt. Such amounts are not a major problem in IC engines,
223
contrary to fuel cell applications. As for H2 production, CO production also depends on the air flow rate,
224
indicating that fluid dynamic effects are very significant, as is the chemical pathway, denoted by equations
1-225
6, over the catalyst.
226 227
In Figure 6 (bottom two graphs), the concentration of unconverted natural gas content is shown,
228
demonstrating that O2 (from additional air) is totally consumed, avoiding the risk of H2 auto-ignition. When
229
the additional air flow rate is 3 Nm3/h, the experimental facilities are not capable of measuring a NGR/O2 ratio
230
lower than 0.3. Clearly, however, the unconverted natural gas concentration is more important at an
231
additional air flow rate of 3 Nm3/h than 5 Nm3/h.
232 233
Figure 7 illustrates the variation in H2 concentration with CO concentration for the two catalysts and two air
234
flow rates, and shows the role of catalyst composition (Pd and Pt). In Figure 5, ratios of reformed exhaust
235
gas recirculation (NGR) to O2 ranging between 0.3 and 1.6 are considered for the two air flow rates and the
236
two catalysts. The concentrations of H2 and CO, respectively, depend on air flow rate, achieving values over
237
the Pd catalyst of about 26% and 11% at an air flow rate of 3 Nm3/h and 20% and 8% at an air flow rate of 5
238
Nm3/h. But H2 and CO concentrations are not too sensitive to the ratio NGR/O2 for an air flow rate of 3
239
Nm3/h. Conversely, over the Pt and Pd catalysts, the H2 and CO concentrations increase approximately
240
linearly with the NGR/O2 ratio. This observation suggests that chemical pathway is dependent on the catalyst
241
choice.
242 243 244
Fig. 6. Variations in concentrations of main gases with the ratio NGR/O2 of at the exhaust of catalyst for two
245
catalysts and air flow rates.
246 247 248 249
Fig. 7. Variation of H2 concentration with CO concentration for two catalysts and air flow rates.
250 251
3.2 Effects of catalysts on CHP system
252 253
The basic system (the CHP plant) has two inputs: natural gas and air in the main stream. The modified
254
system (the CHP plant equipped with a catalyst device) is similar, except that the one natural gas stream is
255
separated in two lines: one to the engine and the other to the catalyst. The absolute difference in electric
256
efficiency is defined as the difference between the electric efficiencies of the modified and basic systems,
257
with a positive absolute difference meaning that the catalyst device increases the electric efficiency and a
258
negative value meaning that the catalyst device decreases the electric efficiency.
259 260
In Figure 8, the variation in the absolute difference of CHP electric efficiency with the ratio NGR/O2 is shown
261
for both Pd and Pt catalysts and for two air flow rates. In the left graph of Figure 8 for which the additional air
262
flow rate is 3 Nm3/h, the absolute difference is positive when the NGR/O
2 ratio is less than 1.3. In that figure,
263
values for Pd (dotted spline line) and Pt (solid spline line) catalysts are seen to improve electric efficiency by
264
similar amounts. In the left graph of Figure 8 for which the additional air flow rate is 5 Nm3/h, the absolute
265
difference of electric efficiency is approximately zero for low values of the ratio NGR/O2 (< 0.8) and negative
266
for high values of that ratio (> 0.8). Note that the results in Figure 8 and the related observations correspond
267
with H2 production concentrations of 26% at 3 Nm3/h and of 20% at 5 Nm3/h.
268 269
The benefit in electrical efficiency is directly attributable to the ability of H2 to promote the combustion 270
process. Several benefits of hydrogen combustion are described by Bauer and Forest [11]: 271
The laminar flame speed for a stoichiometric hydrogen/air mixture (2.65-3.25 m/s) is about seven 272
times higher than for methane or gasoline in air. This property of hydrogen leads to decreases the 273
wall heat transfer to 17-25% of the primary fuel energy for hydrogen, compared to 22-33% for 274
natural gas or 30-42% for gasoline. 275
The “quenching distance” defined as the distance from the cylinder wall at which the flame quenches 276
due to heat losses, characterizes the flame quenching property of a fuel in internal combustion 277
engines. The quenching distance of hydrogen (0.064 cm at standard conditions) is approximately 278
three times lower than that of other fuels, such as gasoline (0.2 cm at standard conditions) or 279
methane (0.203 cm at standard conditions). 280
Emissions from hydrogen fuelled engines are neither toxic nor photochemically reactive. 281
282 283 284
Fig. 8. Absolute difference of electric efficiency. 285
The uncertainty in the determined electric efficiency for the basic system (when there is no flow over the 287
catalyst) is obtained by noting that the electric power We, the low heating value LHV and the mass flow rate
288
of natural gas qNG are three independent measures (measured by a wattmeter, a gas chromatograph and a
289
mass flow meter, respectively): 290 291 NG NG e NG e e NG e dq q LHV W LHV d q LHV W dW q LHV dη = 1 − 2 − 2 (9) 292
The quadratic uncertainty u(ηe) is defined based on the uncertainties of these three variables with its norm:
293 294 2 2 2 2 2 2 1 ( ) ( ) ( ) ) ( = + + NG NG e NG e e NG e u q q LHV W LHV u q LHV W W u q LHV uη (10) 295 296 2 2 2 2 ) ( ) ( ) ( ) ( + + = NG NG e e e e q q u LHV LHV u W W u u η η (11) 297 298
This is the classical law of uncertainty propagation see [12]. Substituting numerical values shows that the
299
relative uncertainty of efficiency
e e u η η ) (
is about 2.5%, with u(We)We =2%, u(LHV) LHV =1% and 300
% 1 )
(qNG qNG =
u . So the value of the electric efficiency ηe is 35%±1.0%.
301 302
In this investigation, the main instrumentation is shared between the basic system and the modified system
303
(wattmeter, gas chromatograph for natural gas, and mass flow meter for natural gas in the main stream).
304
The only difference is a second mass flow meter for the additional natural gas entering the catalyst. The
305
uncertainty between these two configurations is evaluated, denoting the electric efficiency 0
e
η in the basic
306
configuration and ηeNGR when the catalyst device is active. The difference
(
ηeNGR−ηe0)
has been measured307
to be about 0.2%, which is equivalent to stating that the ratio NGR0 ≈0.99<1
e e η η . Here, 308 309
(
NG NGR)
e NG e NGR e e q q LHV W q LHV W + = 1 0 0 η η (12) 310 311Where qNG0 is the mass flow rate of natural gas in the basic configuration required to produce the electric
312
power We, and qNG1 is the mass flow rate of natural gas in the main stream of the modified configuration.
313
Rearranging this equation yields
314 315
0 1 0 NG NGR NG NGR e e q q q + = η η (13) 316 317
where qNG0 and qNG1 are measured by the same mass flow meter. As previously, the ratio NGR
e e η η0 is 318
obtained by two independent measurements:
319 2 0 2 0 1 0 0 0 0 1 0 NG NG NGR NGR NG NG NG NG NG NG NGR e e q dq q dq q q dq q dq q d = − + − η η (14) 320
The fact that only one gas flow meter is used in the main stream implies that dqNG0 =dqNG1not=dqNG. Thus,
321 2 2 0 0 0 0 1 0 NG NG NGR NGR NG NG NG NG NG NGR e e q dq q dq q dq q q q d = − + − η η (15) 322
and its uncertainty is given by its norm:
323 2 2 2 2 0 ) ( 1 ) ( 0 0 1 0 − − + = NGR NG NG NG NGR NG NG NGR e e u q q q u q q q q u η η (16) 324 325
Substituting numerical values gives NGR
e e
u
η η0
=5.04E-4. That means that the difference
(
0)
e NGR
e η
η − has an
326
uncertainty of about 2.0E-4 and this difference is 0.2% ± 2.0E-4.
327 328
A time recording of electric efficiency and H2 content is plotted on Figure 9 for the following conditions: spark
329
timing advance 14CA BTDC, 7% O2 content in the exhaust gases, 80% full load, ambient temperature 21°C
330
and relative humidity around 21%. Two gaps exist around 100 s and 1450 s. The first corresponds to turning
331
off the additional natural gas flow, and the second one to turning it on. It is clear that uncertainties in the
332
wattmeter or the gas chromatograph are not notable. Only the uncertainties of the two mass flow meters are
333
important, as seen in equation 15.
334 335
Fig. 9. Time recording of electric efficiency and H2 production.
336 337 338
An increase of electric efficiency is beneficial, but may not be acceptable if it increases exhaust gases
339
emissions. In Figure 10, the variation in CO and HC emission concentrations in exhaust line of the CHP
340
plant with the ratio NGR/O2 are shown for the Pd catalyst and two air flow rates. It can be seen in the figure 341
that the effect of the catalyst device is not significant on CO and HC emission concentrations, regardless of
342
the additional air flow rate and the ratio NGR/O2. Thus the increase of electric efficiency with the catalyst 343
device does not appear to come at the expense of increased emissions, so a retrofit to achieve the absolute
344
difference of electric efficiency is worth considering.
345 346 347
Fig. 10. Variation with NGR/O2 ratio of the exhaust emission concentrations of the CHP plant equipped with 348
a Pd catalyst device, for two air flow rates.
349
3.3 Discussion
350
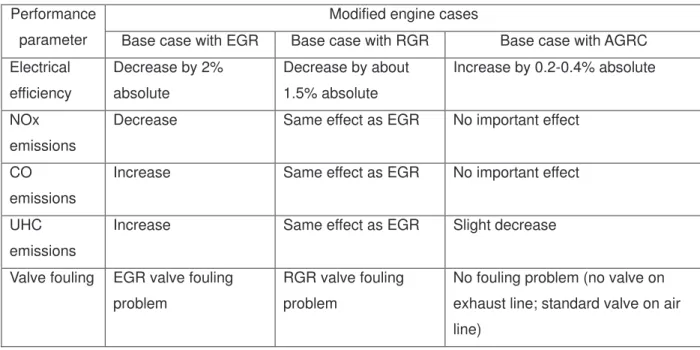
Several processes used to improve the performance of engines are compared in Table 3. In this table, an SI
351
engine fuelled by natural gas under lean conditions (taken to be an equivalence ratio of 1.4) equipped with a
352
two-way catalyst (CO and unburned hydrocarbon UHCs oxidations)in the exhaust line is referred to as the
353
Base case. Exhaust emissions of UHC, CO are considered after the two-way catalyst in the exhaust line.
354
The modified engine cases considered include the Base case with exhaust gas recirculation (EGR), the
355
Base case with reformed gas recirculation (RGR), and the Base case with air gas reforming circulation
356
(AGRC). It is seen that the use of EGR and RGR processes improves engine environmental performance
357
(especially NOX emissions) but lowers energetic performance in terms of efficiency. However, the application 358
of the AGRC concept to the GUASCOR engine increases the energy efficiency of the engine by around
0.2-359
0.4%, with little change in environmental performance. The results in Table 3 need to be validated on other
360
types of engines having different control loops.
361 362 363
Table 3. Comparison of impact on technical and environmental performance of various engine modifications
364
relative to a base case engine.
365 366
3.4 Engine knock issues and resolutions
367 368
The main risk of adding H2 in internal combustion engines is the occurrence of knock associated with 369
abnormal combustion. IC engines used for CHP installations usually run under strict operating conditions,
370
usually based on achieving maximum electricity output while maintaining emissions at acceptable levels, as
371
outlined in the Introduction. Hydrogen addition to natural gas decreases its relative methane content and is
372
known to increase its ability to detonate. Hence, the knock tendency of an engine must be closely monitored
373
when adding H2 to increase engine efficiency. 374
375
Knock, which has been a concern since the invention of the IC engine, is caused by a local auto-ignition of
376
gases under specific thermodynamic conditions, can seriously damage an engine (see Figure 11).
377
Consequently, design and operating conditions are often limited by knock conditions.
378 379 380
Fig. 11. Piston damage from engine knock.
381 382 383
For knock problems, the methane number MN is commonly used to represent the gas quality, i.e. its ability
384
to resist auto-ignition. It is usually equal to 100 for pure methane and 0 for pure hydrogen. This indicator is
385
the equivalent of the Research Octane Number (RON) used for liquid fuels such as gasoline.
386 387
SI engines used as CHP plant can produce more than 1 MWe. Then, it is better to conceive a preventive
388
protection instead of a curative one, as described by Le Corre et al. [13] and Saikaly et al. [14-16]. This is
especially true for applications involving hydrogen, where it is more advantageous to avoid knock rather than
390
to detect it.
391 392
Knock conditions can be avoided by using AGRC, not to maximize the electric production but to protect the
393
engine. Note that the methane number of reformed gas is calculated on the same basis as for natural gas,
394
i.e., without inert gases. Since natural gas and reformed gas have two different methane numbers, it is
395
possible to adjust the setting for the CHP plant to avoid knock conditions. This approach can form the basis
396
of a preventive control mechanism.
397 398
A recent patent (number WO 2011010069) by Rahmouni and Le Corre [17] aims to avoid the occurrence of
399
knock by using two methane number sensors (labeled 21 and 50 in Figure 1) to control the natural gas flow
400
rates (both the main stream and the additional stream) to maintain an acceptable value entering the SI
401
engine. These sensors are described in detail by Rahmouni et al. [18-20] and Loubar et al. [21].
402 403 404
Table 4. Methane number of natural gas and reformed gas
405 406
4. CONCLUSIONS
407 408
In this paper, air gas reforming circulation (AGRC) is proposed as a solution for in situ H2 production for 409
spark ignition engines fuelled by natural gas. Several important conclusions can be drawn from the results:
410 411
• With AGRC, the concentrations of the constituents of the reformed gas are approximately 25%
412
H2, 10% CO, 8% unburned hydrocarbons and 55% N2. The AGRC reformed gas is blended with 413
the main flow of natural gas and air, so unconverted natural gas is mixed with natural gas and is
414
not problematic. The low heating value of CO is counterbalanced by the effect of H2 during 415
combustion in the cylinder of SI engine.
416
• The overall electric efficiency of an engine increases by 0.2% when the AGRC system is
417
applied. Although the increase is not large, it is balanced by the fact that the AGRC system is
418
simple to setup and cost effective.
419
• Equipping an SI engine with AGRC does not change significantly exhaust emissions (CO and
420
HC) in comparison with the original configuration.
421
• AGRC appears to be advantageous compared to reformed gas recirculation because RGR
422
decreases the electric efficiency of the overall system compared to an SI engine without
423
reforming, while AGRC improves the electric efficiency.
424
• No knock or misfiring occurred during experimental tests. But, if abnormal conditions appear for
425
some operating conditions, it is possible to adjust the natural gas main flow and the AGRC flow
426
to avoid the problematic conditions by measuring and controlling the relative methane content
427
of the combustion mixture so that it remains in the correct operating window, as defined by the
428
engine manufacturer.
429 430
ACKNOWLEDGEMENTS
431
Authors would like to thank Dr C. Rahmouni, Dr S. Rousseau and Dr L. Truffet for their valuable
432 contributions. 433 434 REFERENCES 435
[1] Le Corre O., Rahmouni C., Saikaly K. and Dincer I. (2011), Effect of H2 produced through steam methane 436
reforming on CHP plant efficiency, International Journal of Hydrogen Energy, 36(17):11457-11466.
437
[2] Einewall P., Tunestal P. and Johansson B. (2005), Lean burn natural gas operation vs. stoichiometric
438
operation with EGR and a three way catalyst, Society of Automotive Engineers, paper 2005-01-0250.
439
[3] Yap D., Peucheret S.M., Megaritis A., Wyszynski M.L. and Xu H. (2006), Natural gas HCCI engine
440
operation with exhaust gas fuel reforming. Int. J. Hydrogen Energy, 31(5):587-595.
441
[4] Hadj-Sadok Ouaguenouni M., Benadda A., Kiennemann A. and Barama A. (2009), Preparation and
442
catalytic activity of nickel-manganese oxide catalyst in the reaction of partial oxidation of methane, Comptes
443
Rendus Chimie, 12(6-7):740-747.
444
[5] Torniainen P.M., Chu X. and Schmidt L.D. (1994), Comparison of monolith-supported metals for the
445
direct oxidation of methane to syngas, J. Catal. 146(1):1-10.
446
[6] Schmidt L.D. and Huff M. (1994), Partial oxidation of CH4 and C2H6 over noble metalcoated monoliths, 447
Catalysis Today, 21(2-3):443-454.
448
[7] Schmidt L.D., Deutschmann O. and Goralski Jr. C.T. (1998), Modeling the partial oxidation of methane to
449
syngas at millisecond contact times, Studies in Surface Science and Catalysis, 119:685-692.
450
[8] Deutschmann O. and Schmidt L.D. (1998), Modeling the partial oxidation of methane in a
short-contact-451
time reactor, AIChE Journal, 44(11):2465-2477.
452
[9] Le Corre O., Rousseau S. and Solliec C. (1998), One zone thermodynamic model simulation of a
453
stationary spark ignition gas engine: Static and dynamic performances, Society of Automotive Engineers,
454
paper 982694.
455
[10] Peucheret S., Wyszynski M.L., Lehrle R.S., Golunski S. and Xu H. (2005), Use of catalytic reforming to
456
aid natural gas HCCI combustion in engines: experimental and modelling results of open-loop fuel,
457
International Journal of Hydrogen Energy, 30(15):1583-1594.
458
[11] Bauer C.G., Forest T.W (2001), Effect of hydrogen addition on the performance of methane-fueled
459
vehicles. Part I: Effect on S.I. engine performance, International Journal of Hydrogen Energy, 26(1):55-70.
460
[12] ISO/IEC Guide 98-3:2008 Guide to the expression of uncertainty in measurement (GUM). International
461
Organization for Standardization.
462
[13] Le Corre O., Rahmouni C., Rousseau S. and Truffet L. (2008), Method for protecting a gas engine and
463
associated device. Patent WO2008035014, 27 March 2008.
464
[14] Saikaly K., Rousseau S., Rahmouni C. and Le Corre O. (2008), Safe operating conditions determination
465
for stationary SI gas engines, Fuel Processing Technology, 89(11):1169-1179.
466
[15] Saikaly K., Le Corre O. and Rahmouni C. (2010), Preventive knock protection technique for stationary
467
SI engines fuelled by natural gas, Fuel Processing Technology, 91(6):641-652.
468
[16] Saikaly K., Rahmouni C., Le Corre O. and Truffet L. (2009), Industrial application of a preventive knock
469
technique, Society of Automotive Engineers, paper 2009-01-2750.
470
[17] Rahmouni C. and Le Corre O. (2010), Reforming method, and energy conversion machine including
471
reforming device. Patent WO2011010069, 27 Jan. 2011.
[18] Rahmouni C., Tazerout M. and Le Corre O. (2003), Method for determining at least one energetic
473
property of a gas fuel mixture by measuring physical properties of the gas mixture. Patent WO03012435, 28
474
April 2004.
475
[19] Rahmouni C., Tazerout M. and Le Corre O. (2003), Determination of the combustion properties of
476
natural gases by pseudo-constituents, Fuel, 82(11):1399-1409.
477
[20] Rhamouni C., Le Corre O. and Tazerout M. (2003), Online determination of natural gas properties,
478
Comptes Rendus Mécanique, 331(8):545-550.
479
[21] Loubar K., Rahmouni C., Le Corre O. and Tazerout M. (2007), A combustionless determination method
480
for combustion properties of natural gases, Fuel, 86(16):2535-2544.
481
[22] Leiker M., Cartelliere W., Christoph H., Pfeifer U. and Rankl M. (1972), Evaluation of antiknocking
482
property of gaseous fuels by means of methane number and its practical application to gas engines, Diesel
483
& Gas Engine Power Conference & Exhibition, American Society of Mechanical Engineers, St. Louis, Mo.,
484
Paper No. 72-DGP-4, pp. 1-16.
485 486 487
List of figures
488 489
Fig. 1. Variation of selected engine performance parameters with equivalence ratio, highlighting challenges
490
(firing problems, emissions) in improving engine performance
491 492
Fig. 2. Engine system incorporating the air gas reforming circulation (AGRC) concept.
493 494
Fig. 3. Reforming device installation (at left) on a 210 kWe CHP gas engine (orange).
495
Legend: (10) air flow meter, (11) air filter, (12) carburetor, (13) turbocharger, (14) intercooler, (15) actuator,
496
(16) engine, (17) catalyst device, (18) exhaust heat exchanger, (20) natural gas flow meter, (21) Methane
497
Number sensor, (30) additional air flow meter, (40) additional natural gas flow meter, (50) methane number
498
sensor.
499 500
Fig. 4. Schematic of catalytic device. UHC denotes unburned hydrocarbons.
501 502
Fig. 5. Experimental design of flow rates of additional air over the catalyst in the feed line of the SI engine,
503
for various NGR/O2 ratios and catalysts. 504
505
Fig. 6. Variations in concentrations of main gases with the ratio NGR/O2 of at the exhaust of catalyst for two 506
catalysts and air flow rates.
507 508
Fig. 7. Variation of H2 concentration with CO concentration for two catalysts and air flow rates. 509
510
Fig. 8. Absolute difference of electric efficiency.
511 512
Fig. 9. Time recording of electric efficiency and H2 production.
513 514
Fig. 10. Variation with NGR/O2 ratio of the exhaust emission concentrations of the CHP plant equipped with 515
a Pd catalyst device, for two air flow rates.
516 517
Fig. 11. Piston damage from engine knock.
518 519
List of tables
520 521 522Table 1. Engine specifications.
523 524
Table 2. Features of tested catalysts
525 526
Table 3. Comparison of impact on technical and environmental performance of various engine modifications
527
relative to a base case engine.
528 529
Table 4. Methane number of natural gas and reformed gas
530 531
Table 1. Engine specifications.
Parameter Value/Description
Engine manufacturer GUASCOR FGLD 180
Number of cylinders 6
Bore 152 mm
Stroke 165 mm
Displaced volume by cylinder / total 2,994 / 17,964 cm3
Clearance volume 300 cm3
Compression ratio 11:1
Number of suction valves/exhaust
valves 2 / 2 per cylinder
Valve train*: IO/IC/EO/EC 25 CA ATDC/ 45 CA ABDC/ 60 CA BBDC/ 15 CA BTDC
Turbo-charger pressure 1.8 bar
Engine speed 1,500 RPM
Ignition timing 14 CA BTDC
* CA: crankshaft angle; ATDC: after top dead center; BBDC: before bottom dead center; ABDC: after bottom dead center; BTDC: before top dead center; IO: inlet opens before TDC; IC: inlet closes after BDC; EO: exhaust opens before BDC; EC: exhaust closes after TDC.
Table 2. Features of tested catalysts
Parameter Value
Catalyst reference code DC10LQ-1W10-21
Hourly space velocity (HSV) 28,000 h-1 Length of honey-comb catalyst 9 cm Diameter of honey-comb catalyst 21.7 cm
Table 3. Comparison of impact on technical and environmental performance of various engine modifications relative to a base case engine.
Modified engine cases Performance
parameter Base case with EGR Base case with RGR Base case with AGRC Electrical efficiency Decrease by 2% absolute Decrease by about 1.5% absolute Increase by 0.2-0.4% absolute NOx emissions
Decrease Same effect as EGR No important effect CO
emissions
Increase Same effect as EGR No important effect UHC
emissions
Increase Same effect as EGR Slight decrease Valve fouling EGR valve fouling
problem
RGR valve fouling problem
No fouling problem (no valve on exhaust line; standard valve on air line)
Table 4. Methane number of natural gas and reformed gas
Content (vol. %) Natural gas Reformed gas with AGRC O2 0 0 CO2 0.54 6.28 N2 2.85 56.25 H2 0 21.17 H2S 0 0 CO 0 8.14 CH4 87.68 8.16 C2H6 3.04 0 C3H8 5.6 0 C4H10 0.29 0 MN* 71.8 78.8
* Methane number is calculated based on the definition of Leiker et al. [22].