HAL Id: hal-00808226
https://hal-mines-paristech.archives-ouvertes.fr/hal-00808226
Submitted on 4 Jun 2018
HAL is a multi-disciplinary open access archive for the deposit and dissemination of sci-entific research documents, whether they are pub-lished or not. The documents may come from teaching and research institutions in France or abroad, or from public or private research centers.
L’archive ouverte pluridisciplinaire HAL, est destinée au dépôt et à la diffusion de documents scientifiques de niveau recherche, publiés ou non, émanant des établissements d’enseignement et de recherche français ou étrangers, des laboratoires publics ou privés.
EBSD coupled to SEM in situ annealing for assessing
recrystallization and grain growth mechanisms in pure
tantalum
Christophe Kerisit, Roland E. Logé, Suzanne Jacomet, Valérie Llorca,
Nathalie Bozzolo
To cite this version:
Christophe Kerisit, Roland E. Logé, Suzanne Jacomet, Valérie Llorca, Nathalie Bozzolo. EBSD cou-pled to SEM in situ annealing for assessing recrystallization and grain growth mechanisms in pure tan-talum. Journal of Microscopy, Wiley, 2013, 250 (3), pp.189-199. �10.1111/jmi.12034�. �hal-00808226�
EBSD coupled to SEM in situ annealing for assessing recrystallisation
and grain growth mechanisms in pure tantalum
C. Kerisita,b, R.E. Logéb, S. Jacometb, V. Llorcaa, N. Bozzolob
a CEA DAM Valduc, F-21120 Is-sur-Tille
b Mines ParisTech, CEMEF – Centre de mise en forme des matériaux, CNRS UMR 7635, CS 10207, 06904
Sophia Antipolis cedex, France
Summary
An in situ annealing stage has been developed in-house and integrated in the chamber of a Scanning Electron Microscope (SEM) equipped with an EBSD system (Electron BackScattered Diffraction). Based on the Joule effect, this device can reach the temperature of 1200°C at heating rates up to 100°C/s, avoiding microstructural evolutions during heating. A high-purity tantalum deformed sample has been annealed at variable temperature in the range 750°C-1030°C, and classical mechanisms of microstructural evolutions such as recrystallisation and grain coarsening phenomena have been observed. Quantitative measurements of grain growth rates provide an estimate of the mean grain boundary mobility which is consistent with the value estimated from physical parameters reported for that material. In situ annealing therefore appears to be suited for complementing bulk measurements at relatively high temperatures, in the context of recrystallisation and grain growth in such a single phase material.
Key words: in situ, static recrystallisation, grain growth, EBSD, tantalum, grain boundary
mobility
Corresponding author: Christophe Kerisit
CEMEF, Mines ParisTECH 1, rue Claude Daunesse CS10207 06904 Sophia Antipolis cedex, FRANCE Tel: +33 4 93 67 89 32
Fax: +33 4 92 38 97 52
INTRODUCTION
Mechanical and physical properties of metals are notably controlled by microstructure. Microstructure evolves during thermomechanical processing and must be controlled adequately. Under annealing conditions, static recrystallisation and recovery are responsible for drastic changes in the microstructure of deformed metals. These phenomena are generally studied on a statistical basis from bulk samples, to get recrystallisation kinetics, or grain size and texture evolutions. In this work, a quasi in situ approach is adopted to complement bulk type measurements with the observation of local recrystallisation and grain growth mechanisms. A heating stage, designed after the work of Liao, Le Gall & Saindrenan (1998), is used within an SEM chamber to periodically anneal the sample, with fast heating and cooling rates. The microstructure evolution of a selected area is then characterised after each annealing step, with the EBSD technique. Annealings are done in a temperature range (750°C-1030°C) higher than those described in the literature for similar in situ experiments. The range reached in the present study is the classical range in which most of the metallurgical phenomena occur in many metals of industrial interest. This annealing device is applied to a highly deformed tantalum sample to observe recrystallisation and grain growth. Above 600°C, static recovery is active in tantalum and can modify the onset of recrystallisation (Beckenhauer, Niessen & Pick, 1993). The heating stage used here allows achieving fast heating to dissociate recrystallisation from recovery. The major concern of this work is to show that the local mechanisms observed with this in situ technique are consistent with the classical ‘bulk’ observations. The challenging part of this study is to show how to quantitatively measure a material parameter such as the grain boundary mobility, and to analyse the possible artefacts of the technique on the quantitative analysis of local mechanisms of recrystallisation and grain growth.
This paper will first describe the in situ annealing system and compare it to the other available systems. The recrystallisation and grain growth behaviour of a highly deformed tantalum sample will then be described and the local mechanisms discussed and quantified when possible. A special attention is also paid to the possible influence of the free surface on the results.
EXPERIMENTAL SETTINGS
A high purity tantalum sample has been taken from a part severely deformed at high strain rate. A 3mm x 5mm sample was cut, polished down to a thickness of 0.3 mm and etched with a ¼ HF + ¾ HNO3 solution during 45 to 60 s to achieve the surface quality required for
EBSD measurements.
Heating system
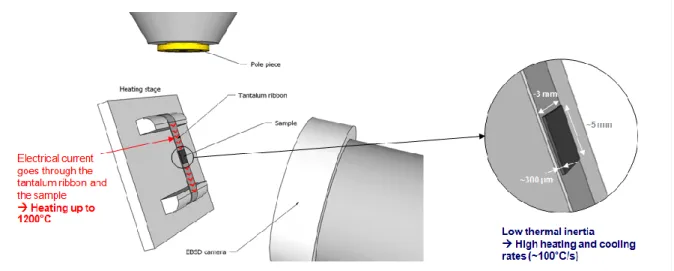
The heating stage is mounted inside the chamber of an XL30 ESEM (FEI, Eindhoven, The Netherlands) equipped with a TSL-EDAX (Mahwah, New Jersey, USA) EBSD system. The stage is positioned so that the analysed surface of the sample is tilted at 70° (figure 1). The sample is spot-welded on a thin tantalum ribbon (30 µm thick and 5 mm wide) chosen for its low electrical conductivity and its high melting temperature. An electrical current, generating
a maximum power of 60 W, goes through the tantalum ribbon to heat it by Joule effect. The welded sample is then heated as well, by conduction. Temperature is controlled and measured with two thermocouples welded on the top surface of the sample. The microstructure observation area is chosen at a certain distance of the welding spots (~2mm), in order to avoid an impact of the welding on the microstructure. This impact has been clearly seen in the welding zone, and results in a quasi recrystallised state. More details on this device are given in Bozzolo, Jacomet & Logé (2012).
Figure 1. Schematic view of the heating stage in EBSD configuration integrated in the SEM.
Other devices have been developed formerly to perform in situ observations of recrystallisation (Humphreys, Ferry, Brough & Johnson (1996); Kiaei, Chiron & Bacroix (1997)), grain boundary migration (Czubayko, Sursaeva, Gottstein & Shvindlerman (1998); Paul, Driver, Morgiel, Lens, Bydalek & Bijak (2006)) and also phase transformation (Seward, Celotto, Prior, Wheeler & Pond (2004)). Most of the reported heating stages are introduced in an SEM chamber, even though other systems are associated with optical (Czubayko, Sursaeva, Gottstein & Shvindlerman (1998)) or laser microscopes (Yogo, Tanaka & Nakanichi (2010)). When using an SEM, microstructural evolutions are followed either by BackScattered Electron (BSE) imaging (Vorhauer, Scheriau & Pippan (2008)) or by EBSD measurements (Hurley & Humphreys (2004)). The second technique has the advantage of providing accurate crystallographic orientation maps and is therefore more quantitative. Usually, both observation techniques are combined (Seward, Prior, Wheeler, Celotto, Halliday & Paden (2002); Bestmann, Piazolo, Spiers & Prior (2005); Nakamichi, Humphreys & Brough (2008)).
Only few systems use the Joule effect heating principle (Liao, Le Gall & Saindrenan (1998); Vorhauer, Scheriau & Pippan (2008); Lens, Maurice & Driver (2005)). Most of the in situ furnaces consist in a heated floor on which the sample is laid down. Thermal exchanges are done by conduction to heat the sample (Kirch, Ziemons, Burlet, Lischewski, Molodova, Molodov & Gottstein (2008); Borthwick & Piazolo (2010); Piazolo, Seward, Seaton & Prior (2004)). Depending on the heating device, samples may have different sizes. The area is generally of a few mm², and the thickness varies from 120 µm (Mattissen, Wærø, Molodov, Schvindlerman & Gottstein (2004)) to 2 mm (Yogo, Tanaka & Nakanichi (2010); Nakamichi, Humphreys & Brough (2008)), with a mean value around 1 mm. In the present work, the
thickness of the sample is reduced to 0.3 mm to ensure low thermal inertia and negligible temperature gradients through the thickness. Heating a system of low thermal inertia by the Joule effect allows achieving heating rates up to 100°C/s. Similar cooling rates can be obtained simply by switching off the electric current. These values are significantly higher than those reported in the literature (typically from 0.2°C/s to 10°C/S, but generally below 2°C/s), and justify the method consisting in periodically interrupting the annealing for microstructure characterisation (Humphreys, Ferry, Brough & Johnson (1996); Kiaei, Chiron & Bacroix (1997)). Real in situ characterisations imply slow microstructure evolution kinetics (Hurley & Humphreys (2004)) when using EBSD. For fast processes, the only option left is BSE imaging (Seward, Prior, Wheeler, Celotto, Halliday & Paden (2002)), but the temperature is then limited to relatively low values. In case of materials which do not undergo a phase transformation between the annealing and the room temperature, the sequential approach is preferable, if sufficient heating and cooling rates hinder any microstructure change during the transients.
Another asset of our device is the maximal reachable temperature (1200°C). The classical temperature range for the different studies using other types of heating stages is between 200°C and 600°C. Few works were done around 900°C (Seward, Celotto, Prior, Wheeler & Pond (2004); Kirch, Ziemons, Burlet, Lischewski, Molodova, Molodov & Gottstein (2008)). To our knowledge, only one study was done at a higher temperature of 1250°C but the stage was not integrated in an SEM chamber (Yogo, Tanaka & Nakanichi (2010)).
In this paper, the in situ annealing technique has been applied to study the recrystallisation of tantalum. This metal is single phased and presents a body centred cubic structure without any allotropic transformation. Due to its high melting temperature (2996°C), recrystallisation triggers at relatively high temperature. Moreover, tantalum has the propensity to recover during heating at low heating rates so that the recrystallisation onset could be affected by recovery (Stüwe, Padilha & Siciliano (2002)). High heating rate should ensure that both recovery and recrystallisation occur only under the applied isothermal conditions, and not during the transient heating and cooling stages.
Annealing sequence
A series of nine successive thermal treatments has been carried out, together with intermediate EBSD measurements to follow the microstructure evolution (figure 2). The annealing temperature is 1030°C initially, to trigger nucleation of recrystallisation. Annealing at lower temperatures might only induce grain boundary migration and static recovery. The surface fraction of recrystallised grains being significant after 2 s at this temperature, the temperature has been reduced a first time to 900°C and then to 750°C such that static recrystallisation and subsequent grain coarsening develop at a reasonable rate. The annealing time has been adjusted as well, according to the kinetics of the different metallurgical phenomena.
Figure 2. Schematic representation of the annealing sequence applied to the sample (measured temperatures).
Heating steps are indicated between parentheses and plateau length, in seconds, above the curve. An example of a real temperature measurement is given for step 6.
EBSD measurements and data analysis
EBSD measurements were done in between annealing steps. The acquisition parameters were adjusted to achieve a compromise between the diffraction pattern quality, the spatial resolution of the map and the acquisition time: the map size is 350 x 600 µm² with a step size of 2 µm. Acquisition rate is about 30 points per second.
Considering the grain size of the undeformed material (around 200 µm) and the map size, the data set is statistically limited. However, the microstructural evolutions observed here are local observations which depend on the local deformed microstructure (grain boundaries, local texture, and fragmentation of the grain orientation). The amount of EBSD data is also mainly limited by the performance of the scanning electron microscope, and of the camera. One way to overcome this problem would be to integrate the heating stage in a FEG-SEM equipped with a more efficient EBSD device. Nevertheless, the objective of this technique is to observe local mechanisms, hence, it would be preferable to increase the spatial resolution rather than the map size, to better resolve the deformed microstructure. Grain boundaries were defined with a minimum crystallographic misorientation angle of 5°. Pixels having a misorientation angle above 5° with all their first neighbours were considered as misindexed and were therefore not taken into account. These ignored pixels appear as black points in the EBSD maps, together with the non-indexed ones.
Microstructures of the area of interest will be shown and analysed through two types of maps. The first one is the Image Quality (IQ) map which represents for each pixel the quality of the EBSD pattern. Considering a gray scale, a dark pixel indicates a poor pattern quality. Being notably sensitive to the presence of crystalline defects like dislocations, and to grain
orientation, pattern quality imaging is a relevant tool to observe microstructure and its evolution during annealing (Wilkinson & Dingley (1991); Krieger Lassen, Juul Jensen & Conradsen (1994)).
The stored energy can be related to local intragranular misorientations (Godfrey, Cao, Hansen & Liu (2005); Liu, Juul Jansen & Hansen (1998)). To quantify the local misorientations, we have used the Kernel Average Misorientation (KAM) parameter which is available in the OIM software. For a given pixel, the average misorientation with all neighbours at a given distance is computed and allocated to the pixel. Since the objective is to quantify only intragranular misorientation, misorientations above 5° were not taken into account for the sake of consistency with the chosen definition of a grain boundary. In this work the kernel radius has been set to three pixels, i.e. 6 µm. The step size being too large to resolve deformation substructures, this kernel analysis gives a qualitative indication of the spatial distribution of stored energy in the microstructure. The number of neighbours has been chosen to limit the noise in stored energy maps.
This local misorientation parameter keeps being step-size dependant. In the present case, all successive maps have been acquired with the same step size. KAM maps could therefore have been directly compared. Nevertheless, to be consistent with the idea that the density of geometrically necessary dislocations is proportional to the orientation gradient (Gao, Huang, Nix & Hutchinson (1999); Kubin & Mortensen (2003)), the raw KAM values have been normalised by the kernel radius and will be given in degrees per micrometer instead of degrees. This new parameter will be called the Local Orientation Gradient (or LOG). In the LOG maps, red pixels indicate high values of intragranular misorientations, and will be interpreted as denoting a high density of GNDs and therefore a high stored energy.
Intragranular misorientations may also be used as a criterion for identifying recrystallised grains in the microstructure. However this is a local indicator (related to a pixel value) which may be low only in part of a grain. A grain based indicator should then be preferred. The Grain Orientation Spread (GOS) is the average value of the misorientation angles between each pixel belonging to the grain and the mean orientation of the grain. Grains were considered to be recrystallised if they had a GOS value below 1°, which is the range of the orientation determination accuracy under the actual EBSD settings. Similar threshold values have been found in (McCabe & Teter, 2006; Helbert, Wang, Brisset, Baudin & Penelle, 2012). Cross analysis with KAM results can however help in resolving ambiguities between recrystallised and recovered grains.
RESULTS
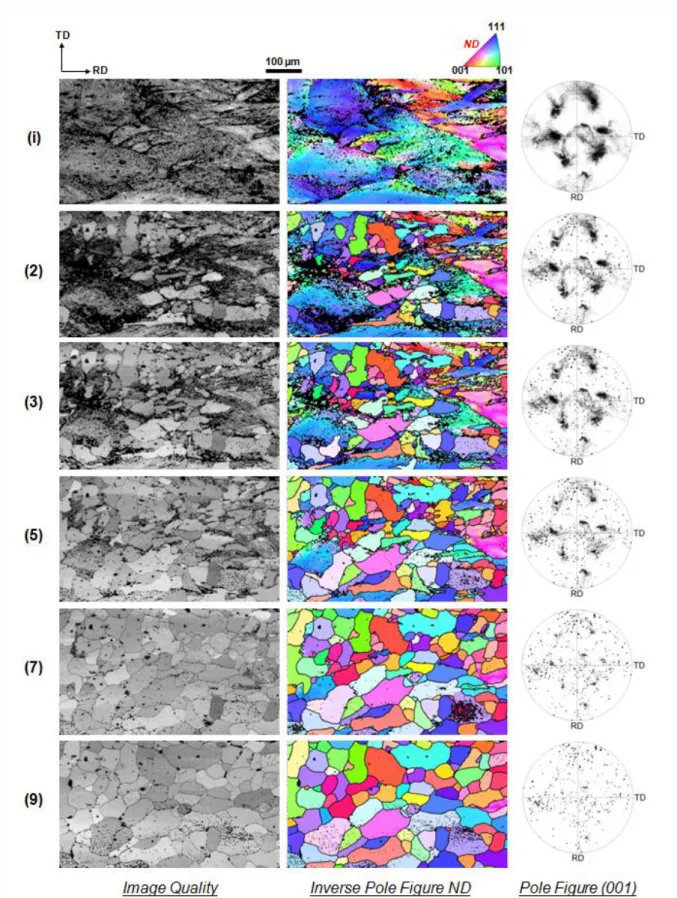
The first result obtained with in situ annealing is the direct observation of how static recrystallisation and grain growth progress in a given area. Nucleation and growth phenomena are clearly observed in figure 3 from step 1 to step 5 (see figure 2 for time and temperature of each step). The four subsequent steps (6 to 9) are slower and relate essentially to grain growth. The different steps of microstructural evolution are analysed in more details below.
Figure 3. Evolution of the microstructure during the annealing sequence.
Deformed state
The initial microstructure contains few grains (figure 2 (i)). Grains are mainly oriented with the <111> axis close to the normal direction to the free surface but pole figures indicate a significant spread of these orientations. They reflect the fragmentation of the grains during
plastic deformation (Sandim, Padilha, Randle & Blum, 1999). For severe deformation, this fragmentation could even lead to the formation of a substructure with cells delimited by dislocation walls. The step size used in this work is not small enough to resolve with details this deformed microstructure, especially in highly deformed areas such as in the vicinity of grain boundaries. As a consequence, only 75 % of the pixels are considered as well-indexed in the deformed microstructure.
Nucleation
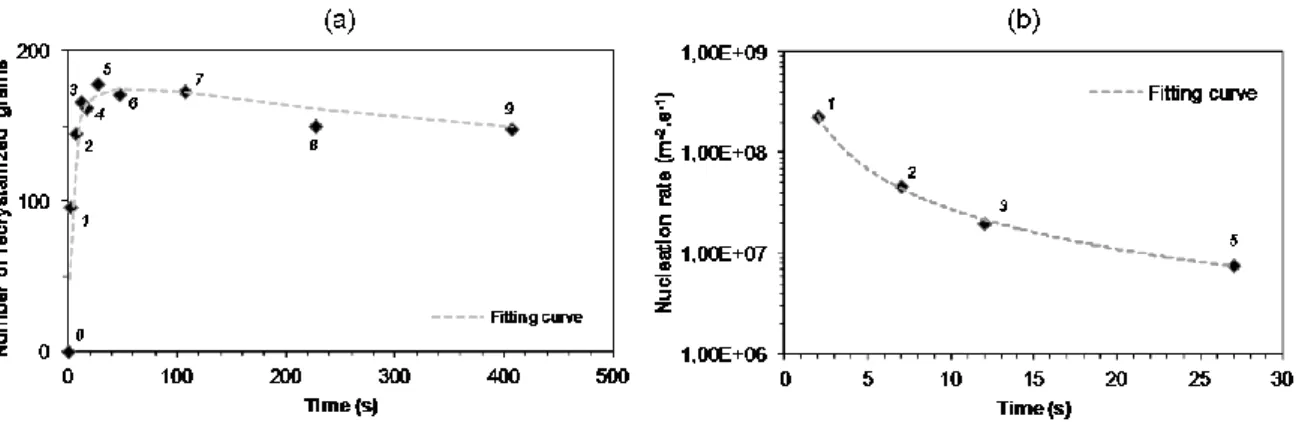
Discontinuous static recrystallisation is a nucleation and growth process. As mentioned by Hutchinson (1992), they cannot really be distinguished. Nucleation is defined as the instant when a small element of volume in the material has reached the critical conditions to grow within the deformed matrix. When a new recrystallised grain is identified in the microstructure, it means that a nucleus has been “activated” and grew. Nucleation is therefore detected indirectly from the appearance of new grains in the microstructure. This observation is also dependent on the spatial resolution of the analysis. Smaller newly recrystallised grains could be detected with a higher resolution analysis of the microstructure during annealing. Nucleation is mostly occurring during the first step of the annealing sequence (step 1 in figure 3) but occurs also continuously until the fifth stage increasing the number of recrystallised grains (figure 4.a). The nucleation rate can be estimated from the number of new grains appearing per unit surface and unit time:
t S N N . (1)
where N is the number of new grains appeared on the observed surface S (350 µm x 600 µm) during the annealing step of time t.
The time evolution of the number of recrystallised grains and of the nucleation rate are shown in figure 4. The highest nucleation rate corresponds to the first annealing step which is at the highest temperature (1030°C) (figure 4.b.). For this step, the nucleation rate is about 2.3 ×10⁸ m-2.s-1. In the following steps, the lower temperature and the reduced number of potential nuclei lead to lower nucleation rates (figure 4.b). It is worth mentioning that some of the grains observed after some time in the analysed section may come from the growth of grains which would have nucleated earlier at some distance from the free surface. This bias cannot be avoided unless doing 3D observations.
To be activated at a given temperature, a nucleus must fulfil two conditions: being sufficiently misoriented with respect to the neighbourhood, and having a favourable balance between its surface energy and the surrounding stored energy level (i.e. having reached the critical nucleus size). During the first annealing step, new grains appear to grow from areas with the highest local misorientations, which correspond to the prior grain boundaries where the microstructure is not well resolved (figure 5). A high local intragranular misorientation indicates a high stored energy and would also favour the emergence of high angle boundaries with sufficient mobility.
In the pole figure of figure 5, blue dots represent the orientations of recrystallised grains, and red dots those from the deformed state. A recrystallised grain displays an homogeneous crystallographic orientation. On the contrary, deformed grains exhibit significant orientation spread, which is furthermore very likely to be underestimated due to the low indexing rate in the most deformed areas. The number of grains in the measured area is too small to allow for any global texture analysis. On the other hand, the orientation of a new grain at a specific location cannot be directly compared to the orientations in the deformed state at the same location, because the exact nucleation point may be below the surface. Nevertheless, since most of the newly recrystallised grains orientations are within or close to the orientation spread measured in the deformed state (see also figure 3), one can reasonably assume that no new orientation has been generated by the recrystallisation process.
Figure 5. Recrystallised grains observed after annealing at 1030°C during 2s. Orientation relationship between
recrystallised (blue dots) and deformed grains (red dots) is shown on the pole figure.
Growth of recrystallised grains
The difference in dislocation content between the activated nuclei and the surrounding material provides a driving force for the newly recrystallised grains to grow within the deformed matrix. In the considered annealing sequence, this phenomenon could be observed until step 5.
The newly recrystallised grains grow quickly. To estimate the grain boundary velocity during recrystallisation at 750°C, a set of 10 recrystallised grains is picked up randomly in the microstructure. Assuming all grains are ideal circles in the analysed 2D section, their sizes are followed until step 5 which is the final step of primary recrystallisation. An average diameter growth rate is calculated for each of these grains. The average value of these individual velocities gives the average equivalent circle diameter growing rate which is around 1.8 µm.s
-1
, leading to 0.9 µm.s-1 as an estimate of the grain boundary velocity. Considering the average equivalent circle diameter of all recrystallised grains (figure 6) during primary recrystallisation at 750°C (stages 3 to 5), the growing rate is about 1.5 µm.s-1, a value close to the one obtained from the set of 10 grains. This value is the boundary trace velocity as observed in the 2D section, and is therefore an upper bound of the normal boundary velocity in 3D.
Figure 6. Evolution of the recrystallised grain size (average equivalent circle diameter) during the annealing
sequence. Only annealing steps carried out at 750 °C are represented (steps 3 to 9).
From EBSD maps, the migration of grain boundaries can be observed and related to the local driving forces. Figure 7 illustrates the growth of recrystallised grains during steps 3 to 5. Maps are representing the Local Orientation Gradient which can be interpreted in terms of dislocation content, with a value close to zero for recrystallised grains. In the recrystallisation regime, the boundary migration is mainly driven by the difference in dislocation content between neighbouring grains. Evolution is faster where the dislocation density gradients are higher as shown for the grains marked with a red symbol. In this regime, the grain size does not influence the migration rate significantly. Where the orientation gradient is weaker, boundaries are pinned (white arrows). The difference in migration rate along a given boundary leads to large local curvature which increases the contribution of the capillarity forces to the overall driving force acting on grain boundaries (Zhang, Godfrey & Jensen (2011); Martorano, Sandim, Fortes & Padilha (2007)).
Figure 7. Grain boundary migration during the growth of recrystallised grains from steps 3 to 5. Microstructure
is shown using Local Orientation Gradient maps.
Grain growth after recrystallisation
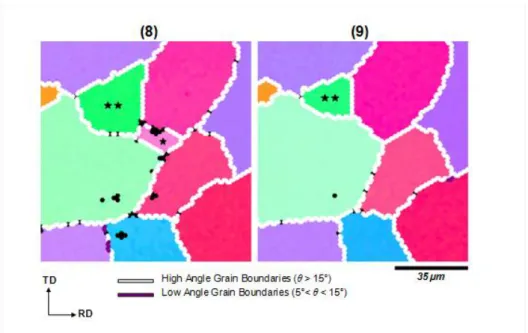
Grain coarsening follows static recrystallisation in steps 6-9 in figure 3. As expected, large grains grow at the expense of smaller grains in order to minimise the total amount of grain boundaries. An example of such a process is given in figure 8 corresponding to the annealing step 9. The total number of grains is obviously decreasing, as noticed in figure 4.a.
Figure 8. Disappearance (*) and shrinkage (**) of small grains at annealing step 9, in grain coarsening regime.
The average equivalent circle diameter growing rate is 36 times slower than the one previously calculated in the recrystallisation regime, with an average value around 0.05 µm.s
-1
. This time, the migration rate of individual grains is linked to their size, consistently with the nature of capillarity forces.
The ratio of grain boundary migration rate between recrystallisation and grain coarsening regimes is related to the different driving forces involved in grain boundary migration. The stored energy attributed to dislocations is (Humphreys & Hatherly (2004))
Es=~0.5ρGb², (2)
with ρ the average dislocation density, G the shear modulus (= 69 × 109 N.m-2), and b the norm of the Burgers vector (= 2.86 × 10⁻¹⁰ m).
The dislocation density of the deformed state will be assumed to be on the order of 1015 m-2 (Hosseini & Kazeminezhad (2009)). The driving pressure associated to this stored energy is around 3 × 10⁶ N.m-2.
The driving pressure for grain growth under capillarity forces is (Humphreys & Hatherly (2004))
P = ~2γs/R, (3)
with γs the surface energy of grain boundaries (which can be estimated as Gb/48 = 0.41 J.m-2 (Stüwe, Padilha & Siciliano (2002)) and R the average radius of curvature. For a 15 μm average radius, the driving pressure would be around 5.5 × 10⁴ N.m-2.
From these simple calculations it is found that the ratio between driving pressures in recrystallisation and grain growth regimes is around 54, which corresponds well to the magnitude of the ratio between the measured growth rates.
The average velocity of grain boundaries is directly linked to the driving pressure P through the mobility of grain boundaries m (Humphreys & Hatherly (2004)):
v = mP (4)
Using the measured growth rates and calculated driving pressures for recrystallisation and grain growth regimes, a value of mobility is obtained in each regime. Since the estimated values of mobility are close, a resulting average mobility is computed m ≈ 4 × 10-13 m4.J-1.s-1 at 750°C.
The mobility can be expressed using an Arrhenius law with an activation energy Qgbm and a pre-exponential term m0. The activation energy for grain boundary migration Qgbm is usually half the activation energy for self diffusion (Humphreys & Hatherly (2004)), and from (Richards, Kramer, House & De Angelis (2003)) an approximate value, Qgbm ≈ 180 kJ.mol-1, is deduced for Ta. The pre-exponential term m0 is (Stüwe, Padilha & Siciliano (2002))
m0 ≈D0V/bRT, (5)
where V is the molar volume ( =10.85 × 10⁻⁶ m3.mol-1), b the norm of the Burgers vector and
T the temperature. D0 is the self diffusion coefficient which can be estimated to (Bénard, Michel, Phillibert & Talbot (1969))
D0 ≈7a²ν, (6)
where a is the lattice parameter ( =0.33 nm), and ν the Debye frequency (usually estimated around 1013 s-1 (Stüwe, Padilha & Siciliano (2002))). Therefore, using D0 ≈ 0.07 cm².s-1, a theoretical value of the mobility at 750°C could be estimated as 2 × 10-14 m4.J-1.s-1, which is one order of magnitude below the value extracted from in situ annealing. Both values are however approximate and could be further discussed, the interest here is to show that the measured values are consistent with reported data in the literature. Indeed, small amounts of elements in solid solution may easily modify the mobility by one order of magnitude (Humphreys & Hatherly (2004)).
DISCUSSION
Statistical analysis of recrystallisation
The area analysed with the in situ technique is small as compared to the areas needed to perform a statistical analysis of recrystallisation. It is therefore not representative of the material in terms of grain size, texture or stored energy. The in situ technique gives access to local mechanisms and local kinetics of recrystallisation or grain growth. A representative recrystallisation kinetics would only be determined if the number of grains was statistically significant in the considered area.
Nucleation
In the reported experiments, nucleation seems to occur with variable incubation times for the different nuclei. The determination of nucleation kinetics would be possible by performing annealing sequences with a constant annealing temperature (but too low temperature may prevent triggering of nucleation). In the present case the nucleation rate probably decreases due to decreasing of both the temperature and the number of potential nuclei. Such kinetics are also affected by the rise of recrystallised grains growing from below the surface, this artefact being inherent to any 2D microstructure observation. It will also be quantified by performing a 3D full field simulation of the recrystallisation process (Bernacki, Resk, Coupez & Logé (2009); Bernacki, Logé & Coupez (2011)) and counting the fraction of grains coming from below the free surface. In the cited works, only few nuclei were introduced in the deformed microstructure. Further developments are needed to answer the above question, because an increased number of recrystallised grains (ideally a few hundreds) has to be considered.
Surface vs. bulk observation of recrystallisation
The principle of the in situ technique is to observe microstructure evolutions at a free surface but introducing a free surface into the microstructure could itself influence the progress of both recrystallisation and grain coarsening phenomena.
Due to the high energy of the free surface and to the heating process, grain boundaries below the surface would tend to straighten out (Liao, Le Gall & Saindrenan (1998)) and become perpendicular to the free surface. Consequently, boundaries on the surface would groove to reach an energetic equilibrium. Both grooving and reorientation of boundaries below the surface may affect the observed motion of grain boundaries on the surface, leading to lower apparent average grain boundary mobility. It was found instead that the measured mobility is higher than the estimated one. Furthermore, in the recrystallisation regime, the stored energy in the material is likely to be much higher than the pinning forces associated with the equilibrium of grain boundary and free surface tensions, and it can therefore be assumed reasonably that the effect of a free surface on the measured mobility is small in the recrystallisation regime. On the other hand, grain growth could, in principle, be affected by the free surface. This was not demonstrated here, since driving forces ratios agree with the measured grain coarsening rates when comparing recrystallisation and grain growth regimes.
Several analyses have been done in the literature to assess the effect of the free surface on recrystallisation. Comparison of surface recrystallisation with bulk recrystallisation have been done either on the same sample or on another sample annealed in a classical furnace. Recrystallisation kinetics, as well as final grain sizes, appeared to be similar (Liao, Le Gall & Saindrenan (1998); Hurley & Humphreys (2004)), which agrees our results on Ta. In the case of aluminium, grain boundary migration was shown not to be affected by the presence of a free surface (Lens, Maurice & Driver (2005); Huang & Humphreys (1999)).
Figure 9. Observation of the microstructure in a cross-section perpendicular to the previously observed free
surface and comparison with the microstructure observed on the free surface (the length scale is the same for both microstructures).
Nevertheless, some differences were observed between surface and bulk recrystallisation when making comparisons on the same sample of an IF steel (Nakamichi, Humphreys & Brough (2008)). Authors suggested that these differences could arise from the sample geometry which generates a temperature gradient in the sample. In order to confirm that the free surface had a low impact on grain size in Ta, a cross section perpendicular to the previously analysed section was polished and prepared for EBSD analyses. The resulting map is shown in figure 9. An "in situ annealed" Ta sample does not show any significant difference of microstructure between the bulk and the vicinity of the analysed free surface. The grain size is almost the same, which indicates that the device used in this study would not
surface with the moving boundaries would not prevent grains from growing as much as in the bulk. Nevertheless, more detailed comparisons between the in situ technique and bulk measurements would be needed to confirm that the free surface is not influencing the microstructural evolutions in tantalum.
CONCLUSION
1. A device compatible with EBSD geometrical settings has been used to perform in
situ annealings inside an SEM chamber. This device could reach 1200°C and
heating rates up to 100°C/s. Such a rate gives the possibility to study recrystallisation without any microstructure evolution during the heating and the cooling stages. This device is then particularly suited for studying recrystallisation in tantalum in which recovery is active from 600°C.
2. An annealing sequence has been carried out on a high-purity tantalum sample severely deformed. Recrystallisation and grain coarsening are observed during the sequence and follow classical mechanisms. Despite a statistically limited data set, results in terms of nucleation rates, number of recrystallised grains and equivalent grain diameter look very reasonable. The in situ technique is qualitatively validated.
3. An average grain boundary mobility of tantalum at 750°C has been determined from the average grain boundary velocity. The order of magnitude is shown to be reasonably consistent with the reported data in literature.
4. The free surface appears to have minor effects on recrystallisation and grain growth kinetics in tantalum. More detailed analyses would be needed to confirm that the microstructure evolution itself is quantitatively similar to that in the bulk.
5. This technique could be improved by integrating the heating stage in a FEG-SEM equipped with a more efficient EBSD device allowing improving the acquisition rate, the spatial resolution and therefore the resolution of the deformed microstructure or the size of the analyzed area.
ACKNOWLEDGMENTS
The authors are very grateful to the CEMEF-MEA staff for designing and making the heating stage.
REFERENCES
Beckenhauer, D., Niessen, P., Pick, R. (1993) Effect of the heating rate on the recrystallization temperature of tantalum. Journal of materials science letters, 12, 449-450.
Bénard, J., Michel, A., Philibert, J., Talbot, J. (1969) Métallurgie générale. Masson et Cie, Paris.
Bernacki, M., Resk, H., Coupez, T., Logé, R.E. (2009) Finite element model of primary recrystallization in polycrystalline aggregates using a level set framework. Modelling and Simulation in Materials Science and Engineering, 17, 064006.
Bernacki, M., Logé, R.E., Coupez, T. (2011) Level set framework for the finite element modeling of recrystallization and grain growth in polycrystalline materials. Scripta Materialia, 64, 525-528.
Bestmann, M., Piazolo, S., Spiers, C.J., Prior, D.J. (2005) Microstructural evolution during initial stages of static recovery and recystallisation: new insights from in situ heating experiments combined with electron backscatter diffraction analysis. Journal of Structural Geology, 27, 447-457.
Borthwick, V.E., Piazolo, S. (2010) Post-deformational annealing at the subgrain scale: Temperature dependent behaviour revealed by in situ heating experiments on deformed single crystal halite. Journal of Structural of Geology, 32, 982-996.
Bozzolo, N., Jacomet, S., Logé, R.E. (2012) Fast in-situ annealing stage coupled with EBSD: a suitable tool to observe quick recrystallization mechanisms. Materials Characterization, 70, 28-32.
Czubayko, U., Sursaeva, V.G., Gottstein, G., Shvindlerman, L.S. (1998) Influence of triple junctions on grain boundary motion. Acta Materialia, 46(16), 5863-5871.
Gao, H., Huang, Y., Nix, W.D., Hutchinson, J.W. (1999) Mechanism-based strain gradient plasticity – I. Theory. Journal of Mechanics and Physics of Solids, 47, 1239-1263.
Godfrey, A., Cao, W.Q., Hansen, N., Liu, Q. (2005) Stored energy, microstructure and flow stress of deformed metals. Metallurgical and Materials Transactions A, 36A, 2371-2378.
Helbert, A.L., Wang, W., Brisset, F., Baudin, T., Penelle, R. (2012) In Situ EBSD Investigation of Recrystallization in a Partially Annealed and Cold-Rolled Aluminum Alloy of Commercial Purity. Advanced engineering materials, 14, 40-44.
Hosseini, E., Kazeminezhad, M. (2009) Dislocation structure and strength evolution of heavily deformed tantalum. International journal of refractory metals & hard materials, 27, 605-610.
Huang, Y., Humphreys, F.J. (1999) Measurements of grain boundary mobility during recrystallization of a single-phase aluminium alloy. Acta Materialia, 47, 2259-2268.
Humphreys, F.J., Ferry, M., Brough, I., Johnson, C.P. (1996) Combined in situ SEM annealing and EBSD of deformed materials. Textures and Microstructures, 26-27, 281-301.
Humphreys, F.J., Hatherly, M. (2004) Recrystallization and related annealing phenomena. 2nd ed., Elsevier, Oxford.
Hutchinson, B. (1992) Nucleation of recrystallization. Scripta Metallurgica and Materialia, 27, 1471-1475. Hurley, P.J., Humphreys, F.J. (2004) A study of recrystallization in single-phase aluminium using in situ annealing in the scanning electron microscope. Journal of Microscopy, 213, 225-234.
Kiaei, M., Chiron, R., Bacroix, B. (1997) Investigations of recrystallization mechanisms in steels during in situ annealing in a SEM. Scripta Materialia, 36, 659-666.
Kirch, D.M., Ziemons, A., Burlet, T., Lischewski, I., Molodova, X., Molodov, D.A., Gottstein, G. (2008) Laser powered heating stage in a scanning electron microscope for microstructural investigations at elevated temperatures. Review of Scientific Instrument, 79(4), 043902.
Krieger Lassen, N.C., Juul Jensen, D., Conradsen, K. (1994) Automatic recognition of deformed and recrystallized regions of partially recrystallized samples using electron back scattering patterns. Materials Science Forum, 157-162, 149-158.
Kubin, L.P., Mortensen, A. (2003) Geometrically necessary dislocations and strain gradient plasticity: a few critical issues. Scripta Materialia, 48, 119-125.
Lens, A., Maurice, C., Driver, J.H. (2005) Grain boundary mobilities during recrystallization of Al-Mn alloys as measured by in situ annealing experiments. Materials Science & Engineering A, 403, 144-153.
Liao, G.J., Le Gall, R., Saindrenan, G. (1998) Experimental investigations into kinetics of recrystallization of cold rolled nickel. Materials Science and Technology 14, 411-416.
Martorano, M.A., Sandim, H.R.Z., Fortes, M.A., Padilha, A.F. (2007) Observations of grain boundary protrusions in static recrystallization of high-purity bcc metals. Scripta Materialia, 56, 903-906.
Mattissen, D., Wærø, A., Molodov, D.A., Schvindlerman, L.S., Gottstein, G. (2004) In situ investigation of grain boundary triple junction kinetics in aluminium-10 p.p.m. magnesium. Journal of Microscopy, 213, 257-261. McCabe, R.J., Teter, D.F. (2006) Analysis of recrystallized volume fractions in uranium using electron backscatter diffraction. Journal of Microscopy, 223, 33-39.
Nakamichi, H., Humphreys, F.J., Brough, I. (2008) Recrystallization phenomena in an IF steel observed by in
situ EBSD experiments. Journal of Microscopy, 230, 464-471.
Paul, H., Driver, J.H., Morgiel, J., Lens, A., Bydalek, A., Bijak, M. (2006) Scanning electron microscopy and transmission electron microscopy in situ studies of grain boundary migration in cold-deformed aluminium bicrystals. Journal of Microscopy, 223, 264-267.
Piazolo, S., Seward, G.G.E., Seaton, N., Prior, D.J. (2004) The potential of combined in situ heating experiments and detailed EBSD analysis in the investigation of grain scale processes such as recrystallization and phase transformation. Materials Science Forum, 467-470, 1407-1412.
Richards, D.W., Kramer, M.P., House, J.W., De Angelis, R.J. (2003) Annealing studies of pure and alloyed tantalum employing rocking curves. Advances in X-Ray Analysis, 46, 285-290.
Sandim, H.R.Z., Padilha, A.F., Randle, V., Blum, W. (1999) Grain subdivision and recrystallization in oligocrystalline tantalum during cold swaging and subsequent annealing. International journal of refractory metals & hard materials, 17, 431-435.
Seward, G.G.E., Celotto, S., Prior, D.J., Wheeler, J., Pond, R.C. (2004) In situ SEM-EBSD observations of the hcp to bcc phase transformation in commercially pure titanium. Acta Materialia, 52, 821-832.
Seward, G.G.E., Prior, D.J., Wheeler, J., Celotto, S., Halliday, D.J.M., Paden, R.S. Tye, M.R. (2002) High-temperature electron backscattered diffraction and scanning electron microscopy techniques: in situ investigations of dynamic processes. Scanning, 24, 232-240.
Stüwe, H.P., Padilha, A.F., Siciliano Jr, F. (2002) Competition between recovery and recrystallization. Materials Science & Engineering A, 333, 361-367.
Vorhauer, A., Scheriau, S., Pippan, R. (2008) In situ annealing of severe plastic-deformed OFHC copper. Metallurgical & Materials Transactions A, 39A, 908-918.
Wilkinson, A.J., Dingley, D.J. (1991) Quantitative deformation studies using electron back scatter patterns. Acta Mettallurgica and Materialia, 39(12), 3047-3055.
Yogo, Y., Tanaka, K., Nakanishi, K. (2010) In situ observation of grain growth and recrystallization of steel at high temperature. Materials Science Forum, 638-642, 1077-1082.
Zhang, D., Godfrey, A., Jensen, D.J. (2011) Local boundary migration during recrystallization in pure aluminium. Scripta Materialia, 64, 331-334.