HAL Id: tel-01535612
https://tel.archives-ouvertes.fr/tel-01535612
Submitted on 9 Jun 2017HAL is a multi-disciplinary open access archive for the deposit and dissemination of sci-entific research documents, whether they are pub-lished or not. The documents may come from teaching and research institutions in France or abroad, or from public or private research centers.
L’archive ouverte pluridisciplinaire HAL, est destinée au dépôt et à la diffusion de documents scientifiques de niveau recherche, publiés ou non, émanant des établissements d’enseignement et de recherche français ou étrangers, des laboratoires publics ou privés.
In-situ investigation of elemental corrosion reactions
during the surface treatment of Al-Cu and Al-Cu-Li
alloys.
Oumaïma Gharbi
To cite this version:
Oumaïma Gharbi. In-situ investigation of elemental corrosion reactions during the surface treatment of Al-Cu and Al-Cu-Li alloys.. Chemical Physics [physics.chem-ph]. Université Pierre et Marie Curie - Paris VI, 2016. English. �NNT : 2016PA066563�. �tel-01535612�
THÈSE DE DOCTORAT DE
L’UNIVERSITÉ PIERRE ET MARIE CURIE
Ecole doctorale de Chimie Physique et Chimie Analytique de Paris Centre
Institut de Recherche de Chimie de Paris / Interfaces, Electrochimie, Energie
In situ investigation of elemental corrosion reactions during
the surface treatment of Al-Cu and Al-Cu-Li alloys.
Présentée par
Oumaïma Gharbi
Pour obtenir le grade de
DOCTEUR DE L’UNIVERSITÉ PIERRE ET MARIE CURIE
Soutenue le 7 Décembre 2016
Devant un jury composé de :
Pr. Christine Blanc : Professeur au CIRIMAT, Toulouse RAPPORTEUR Pr. Sannakaisa Virtanen : Professeur à l’Université Friedrich Alexander, Erlangen RAPPORTEUR Pr. François Huet : Professeur à l’Université Pierre et Marie Curie EXAMINATEUR Dr. Lionel Peguet : Chercheur à Constellium, Voreppe EXAMINATEUR Pr. Kevin Ogle : Professeur à l’IRCP Chimie Paristech DIRECTEUR DE THÈSE
3
« You can tell whether a man is clever by his answers.
You can tell whether a man is wise by his questions. »
5
ACKNOWLEDGMENTS
L’écriture des remerciements me semble de loin la partie la plus difficile à mettre en forme, car derrière chaque mot, s’entremêle des souvenirs teintés d’une certaine tristesse à l’idée de clôturer toute l’aventure qu’était cette thèse.
Cette aventure n’aurait pas pu avoir lieu sans mon directeur de thèse, Kevin Ogle, à qui j’adresse mes plus sincères remerciements. Je le remercie pour sa bienveillance, ses conseils avisés et pour m’avoir guidé durant ces trois années. Je le remercie de m’avoir accordé cette liberté qui m’a permis d’explorer plusieurs horizons, qui m’ont amené à faire des rencontres et vivre des expériences enrichissantes intellectuellement et humainement.
Ces trois années ont été ponctuées de rencontres déterminantes, et l’une des première qui me vient à l’esprit est celle de Nick Birbilis. Je tiens à lui exprimer ma plus profonde gratitude, pour le temps qu’il m’a accordé malgré les 15 000 km qui séparent la France de l’Australie. Son énergie, son humour et enthousiasme à toute épreuve ont été à mes yeux une source d’inspiration ; son accueil chaleureux et celui de son équipe en Australie m’ont permis de vivre la meilleure expérience Australienne possible. Un grand merci, surtout pour toutes ces anecdotes et petites histoires auxquelles j’ai eu droit, toutes plus drôles les unes que les autres !
Mes plus vifs remerciements s’adressent aux membres du jury pour tout l’intérêt qu’ils ont porté à mes travaux. Je remercie en premier lieu Mr François Huet, pour m’avoir fait l’honneur de présider mon jury, à Mme Christine Blanc et Mme Sannakaisa Virtanen pour avoir accepté d’être les rapporteurs de mes travaux et enfin Mr Lionel Peguet pour avoir participé au jury en tant qu’examinateur.
Je tiens à remercier Constellium pour m’avoir fourni l’alliage d’aluminium 2024 et pour les discussions enrichissantes sur mon projet.
Au cours de cette thèse, j’ai eu la chance de faire d’innombrable rencontres, qui m’ont fait découvrir les multitudes facettes de la recherche. En l’occurrence, je remercie toute l’équipe des TP, et en premier lieu Peggy et Sebastiana pour leur accueil et gentillesse ; mais aussi Sophie Griveau et Fanny D’Orlyé pour m’avoir formé et fait réaliser à quel point j’ai plaisir à faire de l’enseignement. Une pensée pour les autres enseignants : FX, Caroline, Stéphane, Barbara, Olivier…
Comment évoquer ces trois années sans parler de l’équipe I2E ! Une équipe, qui s’apparente à mes yeux plus à une famille, débordante de vie et de convivialité. Je remercie Michel Cassir, pour son accueil et son humanité et pour avoir prodigué un environnement propice aux échanges, au partage et à l’enrichissement personnel et intellectuel. Coté administration, je remercie Elisabeth Brochet et Marjorie Sadaoui pour l’aide administrative, leur efficacité et pour leur capacité à toujours trouver une solution malgré les multitudes d’imprévus que j’ai pu rencontrer. Mes remerciements s’adressent aussi à Polina Volovitch pour sa disponibilité. Coté administration, je remercie Isabelle Duc, Roxanne Hervé, Guy Bichet, Patrick Guezo, Ali et Francine pour leur implication (dans les pots !!), les dépannages du vendredi soir et du samedi matin, et les raclettes et autres déjeuners partagés ensemble.
6
Je remercie Valérie Albin et Virginie Lair pour les discussions, et les innombrables déjeuner où mon régime alimentaire (de moineau) a été disséqué, et commenté allègrement… ! Je pense que maintenant mon prénom est associé au Quinoa et aux Makrouds (n’est-ce pas Virginie… !)
Comment ne pas remercier Marie-Hélène Chavanne, pour ses blagues improbables (j’en rigole encore !), ses boites de thon, ses Actimels et soupe Royco mais surtout pour avoir été aussi présente et encourageante tout au long de ma fin de thèse. Tu as toujours su trouver les mots pour mettre du baume au cœur et me faire relativiser. Merci !!!
Cette fin de thèse fut sans aucun doute un des plus grands défis personnel et professionnel que j’ai eu à relever. Le chemin vers la fin a été plus difficile que prévu, et la présence d’Armelle Ringuedé m’a maintenu sur les rails et m’a aidé à terminer ce projet en temps et en heure. Je la remercie pour le tout le temps qu’elle m’a accordé, pour son implication et pour m’avoir autant soutenu durant ma dernière année de thèse. Ce fut un vrai plaisir de travailler avec toi. Ta spontanéité (y’a encore du travail hein), nos conversations intellectuelles (le mystère des maisons sans murs n’est toujours pas élucidé), ton soutien et ton honnêteté ont été déterminant et m’ont permis de te connaître et de partager les plus gros fous rires qui font partie de mes meilleurs souvenirs de thèse (et RIP à toutes ces clémentines qu’on a englouti).
Au tour de mes compatriotes les doc, post-doc, stagiaires et autres rencontres, parfois brèves, mais qui jonchent ma mémoire d’anecdotes croustillantes, drôle (parfois moins drôles) et de beaux souvenirs. Je remercie les doctorants du PCS et MS : Marion pour ses sourires et sa douceur, Rémi pour partager la même passion des chats, Shadi, Zuzana, Emna pour les afterworks partagé ensemble ainsi que Stéphanie Delannoy et Cedrik Brozek pour leur gentillesse et le temps passé avec moi sur mes échantillons. Je remercie Slava pour son aide et pour m’avoir présenté à « Mme ICP » comme il l’aime l’appeler, et m’avoir appris quelques phrases en Russes (pas assez pour survivre en Russie non plus). Je remercie Arturo Melendez alias « McGyver » pour ses réponses à tout, mais surtout pour son délicieux guacamole et pour avoir supporté mes danses incongrues d’après 18h. Je tiens à remercier Noémie Ott pour son aide durant ma première année de thèse et pour toute les suggestions qu’elle a pu faire sur mon montage expérimental.
Combien de fois ai-je ri, débattu et partagé de moments avec Amandine Calmet (Reine des Neiges, Rene des Doctorant, Reine du Drame), Dorra Dallel (avec ses bon petit plats et son humour décapant), Aziz Nechache (le Tanguy du labo), François Lebreau (alias Fanfan l’encyclopédie Larousse/Robert, ne crois pas que je vais laisser passer l’histoire du T-Shirt…), Junsoo Han (le plus drôle des Coréens !), Andrey Grishin (je garderai tes nettoyages frénétiques en mémoire, à se dire que tu pourrais presque te nettoyer à l’eau de javel), Manel Ben Osman alias Mme la Perchée (merci pour ton aide précieuse et tes encouragements, tu es perchée certes, mais tu es la meilleure des perchées !) et Amandine Michot Mignucci (magle, la tata Loza, l’Arabe refoulée que j’ai adoré détester).
7
Je remercie les stagiaires et autre doctorants, Chloé Alamah, Peng Zhu, Alina Maltseva, Thomas Sanchez, Nour, Karima, Moussa, Cyril Nicard et Perrine Tanguy pour l’aide et leur gentillesse, mais aussi Bradley Da Silva, Olivier Lesage pour les encouragements.
Je remercie mes amis, qui pour certains m’ont encouragé et d’autres m’ont inspiré à suivre ce parcours pour lequel au départ je ne m’étais pas destinée. Une pensée pour Magali Quinet qui m’a ouvert les portes du monde de l’électrochimie et de la corrosion (une vraie révélation !!), André Ouwanssi (Dédé le Toulousain Camerounais de Bretagne), Isabel Arroyo et Mary Shaffer. Je remercie infiniment la famille Hachaïchi et la famille Hasnaoui pour le soutien, leur présence et leur implication dans mon parcours.
Une pensée à ceux chez qui j’ai toujours pu retrouver du réconfort, mes deux petits chats Soussou et Tigrou qui, avec toute leur innocence et leur nonchalance qui caractérisent si bien les chats, m’ont permis de me réfugier dans un monde d’insouciance, de ronron et de douceur le temps de quelques minutes (oui oui, j’ai bien remercié mes chats).
Mes remerciements les plus profonds s’adressent à ma famille sans qui rien de tout ceci n’aurait pu arriver. Je remercie mes deux petits (petit d’âge mais pas de taille) frères, Bassem et Yousri, pour leur amour et humour vache, et leur soutien. Je suis très fière de ce que vous êtes devenus. Je remercie du fond du cœur mes parents, à qui je dédie cette thèse. Bien que la vie n’ait pas été toujours très clémente à votre égard, vous n’avez jamais cessé d’irradier le foyer d’amour et vous m’avez toujours été d’un soutien indéfectible. Je suis très fière de vous avoir comme parents et sachez que je vous admire pour votre force, votre patience et votre générosité.
9
TABLE OF CONTENTS
ACKNOWLEDGMENTS ... 5
LIST OF ACRONYMS & SYMBOLS ... 13
LIST OF FIGURES & TABLES ... 15
CHAPTER I: INTRODUCTION & STATE OF THE ART ... 21
1. INTRODUCTION ... 23
2. STATE OF THE ART ... 26
2.1. Generalities on Aluminum ... 26
2.2. Age hardening and thermal treatment. ... 28
2.3. Aluminum 2024-T3: microstructure ... 29
2.4. Alloy processing and effect of rolling on the surface microstructure ... 31
2.5. The corrosion behavior of AA2024-T3 ... 32
2.5.1. The pitting corrosion of Aluminum ... 32
2.5.2. Intergranular corrosion... 34
2.5.3. The effect of the S-phase particle (Al2CuMg) ... 35
2.5.4. The effect of the 𝜽 phase (Al2Cu) ... 37
2.5.5. The effect of Al7Cu2Fe and Al-Cu-Fe-Mn particles ... 37
2.6. Aluminum-Lithium alloys: microstructure ... 38
2.7. The corrosion behavior of AA2050-T3 ... 41
2.7.1. Intergranular corrosion (IGC) ... 42
2.7.2. Stress corrosion cracking (SCC) ... 45
2.7.3. The effect of age hardening on the corrosion properties ... 45
3. THE SURFACE TREATMENT OF AL-ALLOYS ... 47
3.1. Solvent cleaning ... 47
3.2. Alkaline cleaning ... 48
3.3. Acid deoxidizer (acid pickling) ... 48
4. MOTIVATION AND OBJECTIVES OF THE THESIS ... 51
CHAPTER II: MATERIALS & METHODS ... 53
1. INTRODUCTION ... 55
2. MATERIALS & METHODS ... 57
2.1. Part A: The flow cell and electrolyte transportation. ... 58
10
2.1.2. Flow injection valve system ... 59
2.2. Part B: The inductively coupled plasma atomic emission spectrometer (ICP-AES) ... 59
2.2.1. Electrolyte introduction system ... 59
2.2.2. Internal standard and second peristaltic pump ... 60
2.2.3. Plasma: excitation source of the ICP-AES ... 61
2.2.4. Dispersive system ... 63
2.3. Part C: Element quantification and AESEC data treatment ... 64
2.3.1. Concentration, flow rate and convolution. ... 64
2.3.2. Hydrodynamics ... 66
2.4. Sample preparation ... 68
2.5. Electrochemical characterization ... 68
2.5.1. Potentiodynamic polarization curves ... 68
2.6. Surface ex-situ characterization techniques ... 69
2.6.1. Scanning electron microscopy (SEM) ... 69
2.6.2. Focused Ion Beam (FIB) ... 69
2.6.3. Glow discharge optical emission spectrometer (GDOES) ... 70
2.6.4. Profilometry ... 70
2.6.5. X-ray photoelectron spectroscopy (XPS) ... 71
2.6.6. Vibrational spectroscopy ... 71
2.6.7. X-ray diffraction (XRD) ... 73
CHAPTER III: IN SITU MONITORING OF ALLOY DISSOLUTION AND RESIDUAL FILM FORMATION DURING THE PRETREATMENT OF AL-ALLOY 2024-T3. ... 75
1. INTRODUCTION ... 78
2. EXPERIMENTAL ... 80
3. RESULTS AND DISCUSSION ... 83
3.1. In situ measurement of AA2024 pretreatment kinetics ... 83
3.2. Microstructural analysis of pretreated surfaces ... 86
3.3. Kinetics of Cu rich Particle Release in NaOH ... 90
3.4. Dissolution and passivation in HNO3 ... 91
3.5. Polarization Behavior prior to, and following, pretreatment ... 96
4. CONCLUSIONS ... 100
5. APPENDIX ... 102
5.1. Hydrodynamics ... 102
11
CHAPTER IV: ON-LINE REACTIVITY MEASUREMENT OF AL-LI ALLOY AA2050-T3
DURING A SURFACE PRETREATMENT SEQUENCE USING AESEC ... 105
1. INTRODUCTION ... 108
2. EXPERIMENTAL ... 110
3. RESULTS ... 113
3.1. Dissolution profile AA2050-T3 under pretreatment sequence ... 113
3.2. Reactivity of AA2050-T3 under HNO3 exposure ... 116
3.3. Microstructural analysis of AA2050-T3 before and after pretreatment ... 117
3.4. Particle detection under NaOH exposure ... 119
3.5. AESEC polarization curves prior & after pretreatment ... 120
3.6. GDOES profiles of the surface after pretreatment and polarization curves ... 122
3.7. Potentiodynamic polarization curve of AA2024-T3 in 0.5 M NaCl with the addition of 1 ppm of Li ... 123
4. DISCUSSION ... 125
5. CONCLUSIONS ... 127
CHAPTER V: CHARACTERIZATION OF AN AL-BASED CORROSION PRODUCT AFTER THE ANODIC POLARIZATION OF AN AL-LI ALLOY... 130
1. INTRODUCTION ... 133
2. EXPERIMENTAL ... 135
3. RESULTS ... 136
3.1. GDOES analysis of the corroded surface ... 136
3.2. X-ray diffraction analysis of AA2050 prior and after corrosion testing... 137
3.3. Identification of amorphous corrosion products by Raman spectroscopy ... 140
3.4. Complementary analysis of the corrosion product by Infrared spectroscopy ... 142
4. DISCUSSION ... 145
5. CONCLUSIONS ... 147
PRELIMINARY STUDIES & CONCLUSIONS ... 149
1. PRELIMINARY STUDIES ... 151
1.1. The pretreatment of intermetallic particles: the reactivity of S phase. ... 151
1.2. The statistical analysis of particle detachment: establishment of relationships between elements, signal intensities and particle nature. ... 152
12
2.1. General conclusions ... 157
2.2. Perspectives ... 159
REFERENCES ... 161
APPENDIX ... 175
LIST OF PUBLICATIONS & CONFERENCES ... 179
List of publications ... 179
Conferences ... 179
Oral presentations: ... 179
13
LIST OF ACRONYMS
&
SYMBOLS
AESEC: Atomic emission spectroelectrochemistry LDR: Linear dynamic range
ICP-AES: Inductively coupled plasma atomic emission spectrometer ICP-MS: Inductively coupled plasma mass spectrometer
OCP: Open circuit potential ORR: Oxygen reduction reaction GRSL: Grain refined surface layer GP: Guinier Preston zone
IGC: Intergranular corrosion SCC: Stress corrosion cracking SHT: Solution heat treated PFZ: Precipitate free zone
SSSS: Super saturated solid solution RDE: Rotating disk electrode RBS: Rutherford backscattered SEM: Scanning electron microscopy
EDXS: Energy dispersive X-ray spectroscopy FIB: Focused ion beam
TEM: Transmission electron microscopy
GDOES: Glow discharge optical emission spectrometer XRD: X-ray diffraction
XPS: X-ray photoelectron spectroscopy
ATR-IR: Attenuated total reflectance infrared spectrometer WE: Working electrode
RE: Reference electrode CE: Counter electrode FIV: Flow injection valve SHT: Solution heat treated LDH: Layered double hydroxide
A: Surface area of the working electrode CM: Concentration of dissolved elements
VM: Dissolution rate of dissolved metal
n: Number of electron(s) M: Molar mass of atom
14 t: Time
F: Faraday’s constant c: speed of light
h: Max Planck’s constant h = 3.336 x 10⁻¹¹ s cm-1
k: Boltzmann’s constant
h(t): transfer function or residence time distribution 𝛽 𝑎𝑛𝑑 𝜏: parameters of the transfer function h(t) 𝜆: wavelength
𝐶2𝜎: detection limit
𝑄𝑀𝑖𝑛𝑠: Quantity of insoluble species
je: Total current measured by the potentiostat
ja: Anodic current
jc: Cathodic current
vM: Dissolution rate
15
LIST OF FIGURES
&
TABLES
Figure 1: Pourbaix diagram of Aluminum in water at 25°C [2]. ... 27 Figure 2: Section of ternary Al-Cu-Mg phase diagram at 460°C and 190°C (estimated). θ= Al2Cu, S= Al2CuMg,
T= Al6CuMg4 ... 29 Figure 3: Schematic of the modified structure called Grain Refined Surface Layer (GRSL) resulting from
mechanical processing. This zone is characterized by the presence of oxide particulates and a recrystallized structure [14]. ... 31 Figure 4: Autocatalytic process occurring during the propagation of a pit in aerated NaCl solution. The metal M
undergoes active dissolution at the bottom of the pit, while oxygen reduction takes place at the surface [35]. ... 33 Figure 5: Representation of a grain boundary zone where the θ phase is found at the grain boundaries, surrounded
by a Cu-depleted zone and the α-Al matrix [45]. ... 35 Figure 6: Dealloying process of a S-phase particle. Al and Mg dissolve and form a hydrous gel around the particle.
As a result, Cu clusters detach from the intermetallic and are oxidized. They may be redeposited at the periphery of the particle [47]. ... 36 Figure 7: Dealloying phenomena of a S-phase particle. Al and Mg dissolve and leave Cu remnant on the surface
which increase the cathode area and oxygen reduction. The formation of OH- induce a local alkalization and the dissolution of the α-Al matrix [52]. ... 37 Figure 8: Schematic of the microstructure and intermetallic distribution within a grain boundary in the second (A)
and the third (B) generation Al-Li alloys [59]. ... 41 Figure 9: Schematic illustration of the phase changes occurring within Alloys A and B as a result of SHT (solution
heat treated) and aging at 200°C [74]. ... 44 Figure 10: Potentiodynamic polarization curves of different phases T1, θ and the α-Al matrix in NaCl A) after
direct immersion B) after 10 days of immersion [75]. ... 45 Figure 11 : Schematic of the AESEC method referring to the coupling of an electrochemical flow cell and the
ICP-OES [111]. ... 56 Figure 12 : Schematic of the final experimental set-up showing: the electrochemical flow cell, two pumps with
their electrolyte reservoir a) and b), a flow injection valve c) connected to the electrochemical flow cell. The ICP-AES collects the electrolyte to measure the dissolution rates and the potentiostat follows the electrochemical data. b) Injects, after the flow cell, 2.8 M HNO3 with 15 ppm Y at 1 mL min -1. d) represents the nebulizer and aspiration chamber system which collects ~ 5 % of the electrolyte to inject it in the plasma. The remaining 95 % were collected downstream. A recirculating temperature controlled water bath and a hollow copper block (not shown here) were used to maintain the electrolyte and the sample at a constant temperature (60 °C). ... 57 Figure 13 : Detailed schematic of the electrochemical flow cell showing the compartment with the flowing
electrolyte reacting with the WE, separated from the second compartment by a cellulose membrane where there is the RE and CE. ... 58
16
Figure 14 : Picture showing the electrochemical flow cell with the compartment containing a) the reference electrode, b) a Teflon block (changed to a Copper block if working at high temperature is needed)
maintaining the sample c) at a constant pressure, against the flow cell d) and e) the flow injection valve. . 59
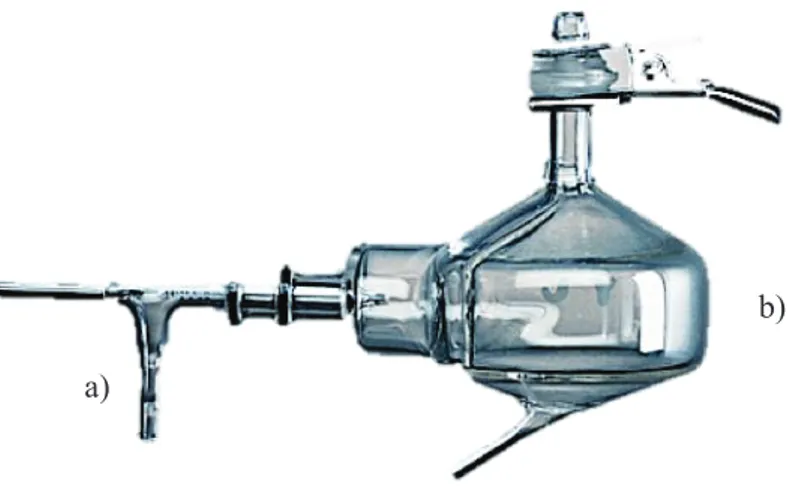
Figure 15 : Picture of the electrolyte introduction system involving a) the nebulizer and b) the cyclonic spray chamber. ... 60
Figure 16 : Picture and schematic of the plasma torch, adapted from [123]. ... 62
Figure 17 : Energy level diagram describing the energy transitions (related to E= Eexcited - Eground ) were a) and b) represent excitation, c) ionization, d) ionization/excitation, photon emission by e) ion and f) g) and h) atom [123]. ... 63
Figure 18 : Schematic representing a Pashen-Runge polychromator composed of a set of photomultiplier tubes. They can collect up to 30 different wavelengths at the same time [124]... 64
Figure 19 : a) Residence time distribution of the flow cell after applying 10 mA pulse to pure Cu in 1.2 M H2SO4 and the Cu intensity was measured in response. t° is defined as the time between the initial pulse and the first at which the signal rises above the background (Iλ°) and τ is defined as the time between t° and the peak maximum and b) corresponds to the curves a) with a log-normal distribution fit of ICu (adapted from [116]). ... 66
Figure 20 : Experimental data and the curve fit used to determine the residence time distribution of an electrolyte between two pretreatment steps. The curve fit is presented as a log-normal distribution with these parameters: β = 1.90 ± 0.03 and τ =7.02 ± 0.04 [128]. ... 67
Figure 21 : Comparison of the experimental data between (in black) the galvanostatic pulse and (in blue) the hydrodynamic experiments used to determine the residence time distributions. ... 68
Figure 22 : Principle of Glow discharge optical emission spectroscopy. ... 70
Figure 23 : Principle of X-ray photoelectron spectroscopy. ... 71
Figure 24 : Principle of Raman spectroscopy. ... 72
Figure 25 : Principle of X-ray diffraction. ... 73
Figure 26: Schematic of the experimental set-up showing: the electrochemical flow cell, two pumps with their electrolyte reservoir a) and b), a flow injection valve c) connected to the electrochemical flow cell. The ICP-AES collects the electrolyte to measure the dissolution rates and the potentiostat follows the electrochemical data. b) Injects 2.8 M HNO3 with 15 ppm Y after the flow cell at 1 mL min -1. d) represents the nebulizer and aspiration chamber system which collects ~ 5 % of the electrolyte to inject it in the plasma. The remaining 95 % were collected downstream. A recirculating temperature controlled water bath and a hollow copper block (not shown here) were used to maintain the electrolyte and the sample at a constant temperature (60 °C). ... 81
Figure 27: AESEC dissolution profiles for Al and Cu and the electrochemical potential during the pretreatment sequence of AA2024 – T3. Exposure to 1.25 M NaOH at 60 °C begins at t=0 indicated with a dashed vertical line. This was followed by water, and then 2.8 M HNO3 both at ambient temperature (≈ 23 °C). Note the indicated multiplicative factors for the two elements in the different regions of the curve. Also the time axis is broken to give the dissolution rates obtained after a longer time period. ... 83
17
Figure 28 : The formation and dissolution of the residual film: showing the evolution of the Al mass loss and the residual Cu calculated from mass balance - during the pretreatment sequence. The quantity of residual and final Cu, Mg, Fe, Mn, and Ti are given in Table 3. ... 85 Figure 29 : SEM of AA2204-T3 showing (A) initial surface, (B) after 1.25 M NaOH at 60 °C for five minutes, (C)
after 2.8 M HNO3 for 15 minutes (backscattered electron images - FEI Quanta 3D FEG). ... 86 Figure 30 : SEM micrographs of AA2024-T3 in (i) image in backscattered electron mode and (ii) secondary
electron mode. The corresponding X-ray mapping and EDS spectra corresponding to the two particles which are labelled as iii) and iv) are shown, revealing Al2CuMg and Al7Cu2Fe after 1.25 M NaOH at 60 °C respectively. ... 87 Figure 31 : EDS maps performed on two locations after the exposure of AA2024-T3 to 1.25 M NaOH at 60 °C for
5 minutes, followed by 2.8 M HNO3 for 15 minutes. I) represents the general surface showing the protruding particles and II) is a map on a remaining particle. ... 88 Figure 32 : SEM micrographs in cross section of the oxidized surface after 1, 3 and 5 minutes of exposure to 1.2
M NaOH at 60°C. (Backscattered electron images) - LEO series 1500 ... 89 Figure 33 : Transient data for Cu, Mg, Fe, and Mn during the reaction of AA2024- T3 with 1.25 M NaOH at 60°C
obtained at 10 points per second. The sharp peaks (single points) correspond to particle release. Different types of particles are detected including those that contain Cu and Mg (solid lines) and Cu Fe and Mn (dashed lines). Particles containing only Cu are indicated with a “*” and only Mg by a “+”. ... 90 Figure 34 : Dissolution profile for AA2024-T3 in 2.8 M HNO3, 23°C, following 1.25 M NaOH exposure at 60 °C,
showing (A) the potential, (B) Al, Cu, the residence time distribution h(t) and (C), Mg, Mn, Fe (x15) and Ti (x100) as a function of time... 92 Figure 35 : Dissolution profile for AA2024 – T3 in 2.8 M HNO3, 23°C, without pretreatment showing Al, Cu, and
Mg dissolution as a function of time (Mn, Fe and Ti were not detected). ... 94 Figure 36 : FIB and SEM micrograph of AA2024-T3 intermetallic particles after 15 min exposure in 2.8 M HNO3
revealing dealloying at the Al/intermetallic particle interface and in the particle. ... 96 Figure 37 : AESEC – polarization curves of treated and untreated AA2024-T3 in 0.5 M NaCl, at pH = 6.7, and at
room temperature, before and after pretreatment, measured at 1 mV s-1. (A) Conventional polarization curves, (B) je (dashed) and jAl (solid) showing the Faradaic yield for Al dissolution in the transpassive domain; (C) jCu showing enhanced Cu dissolution for the pretreated material. The peaks in Cu dissolution indicate particle release. ... 98 Figure 38: Dissolution profile of AA2050-T3 during a complete pretreatment sequence. Shown as function of
time: Al, Li and Cu dissolution rates in µg s-1 cm-2 and the potential in V vs. Ag/AgCl. Note that the Li dissolution rate has been multiplied by 10. ... 113 Figure 39: Evolution of the Al, Cu and Li mass, QM, as a function of time during the pretreatment (in µg cm-2). Al
was calculated as a mass loss by direct integration of Al dissolution profile (Eq 4.). Cu and Li were calculated as residual films from equation 5 assuming homogeneous elemental composition at t=0. ... 115 Figure 40: Dissolution profile of AA2050-T3 during HNO3 exposure where E (upper curve) and Cu, Mg, and Mn
(middle) and Al, Fe, and Li (lower) dissolution rates are shown as a function of time. ... 116 Figure 41: SEM micrograph of T3 before surface treatment in backscattered electron mode of AA2050-T3 and the corresponding X-ray mapping of one constituent particle showing the surface composition of
Fe-18
Cu and Mn. Note that the rectangle on the left does not correspond precisely to the EDS mapping area on the left. ... 118 Figure 42: SEM micrographs after 5 min NaOH at 60°C exposure in backscattered electron mode of the surface
(A) and the corresponding EDS spectras of one particle and the matrix. (B) represents the surface after HNO3 exposure with the corresponding mapping showing the chemical composition of the remaining particles. ... 119 Figure 43: Dissolution profiles during NaOH exposure of AA2050-T3 at 10 pts/s showing Cu, Mg, Mn and Fe.
The very sharp spikes indicated with a vertical line are attributed to the release of intermetallic particles. ... 120 Figure 44: Potentiodynamic polarization curves of AA2050-T3 before and after pretreatment in 0.5 M NaCl, 1 mV
s-1, pH 6.8 at T= 23°C. A/ represents the conventional polarization curves, B/ and C/ their corresponding dissolution profiles in the anodic domain before pretreatment (B) and after pretreatment (C). The dashed area in (C) indicates the difference between Je and Jm, which is attributed to oxide formation. ... 121 Figure 45: GDOES profiles of AA2050-T3 before and after polarizing. The Li/Al ratio is represented as a function
of the erosion time indicated a Li enrichment at the surface. ... 123 Figure 46: Potentiodynamic polarization curves of AA2024-T3 after pretreatment in 0.5 M NaCl + 1 ppm of Li at
1 mV s-1, pH= 6.7 at T= 23°C. Represented as a function of the potential, the total current and jAl. Note that the Al was the major element contributing to the total current... 124 Figure 47: Schematic of the dissolution/ precipitation process of Li and Al during the anodic polarization of
AA2050-T3 after pretreatment. ... 126 Figure 48 : GDOES profiles of Li, C, H and O expressed as a ratio versus the Al signal. ... 136 Figure 49 : Diffraction patterns of the AA2050 alloy after the different steps. Values normalized vs the intensity
at 2 θ = 45°, corresponding to the maximum intensity recorded for the as received 2050 substrate, after pretreatment and after corrosion test. ... 137 Figure 50 : Focus on the lower intensities of the X-ray diffraction patterns for the as received and after corrosion
test 2050. ... 138 Figure 51 : Raman spectra of two different spots of the film (black and grey) and the matrix (blue). ... 141 Figure 52 : IR spectra of the corrosion product. ... 143 Figure 53 : Dissolution profile of S-phase particle during a pretreatment sequence. The first step corresponds to
the exposure to 1.25 M NaOH, followed by water rinse at 23°C and an acid pickling in HNO3 during 15 min at 23°C. Note the multiplicative factors for Al and Mg demonstrating that Cu is the major element dissolving during this experiment. ... 151 Figure 54 : SEM micrograph in backscattering mode of the S-phase after the pretreatment sequence. The chemical
contrast shows the presence of remnant nanoparticulates that could be attributed to Cu. ... 152 Figure 55: Correlation factor diagram representing the relationship between the elements. ... 153 Figure 56: Distribution of Cu peaks as a result of the statistical calculations. Each node corresponded to an element
with its corresponding color and the thickness of its link represented the co-occurrence between the element and another. ... 155
19
Table 1: Specifications of the different Aluminum Alloy series reported in the literature. ... 27
Table 2: Chemical composition of AA2024-T3 used during this PhD (wt %)... 29
Table 3: List of the intermetallic particles found in 2XXX series Al alloys reported in the literature. ... 30
Table 4 :Corrosion potential of various intermetallic phases reported in the literature... 34
Table 5: Chemical composition of the AA2050 used during this PhD (in wt %) ... 39
Table 6: List of the intermetallic particles reported in the literature, found in Al-Cu-Li alloys... 41
Table 7: Elemental composition of AA2024-T3 ... 80
Table 8 : Detection limits (C2σ) of the different elements in all electrolytes. ... 82
Table 9 : Elemental composition of alloying elements and surface composition after NaOH and HNO3 exposures determined from EDS spectras and mapping (in wt% and at%). ... 89
Table 10 : Elemental composition and absolute quantity of the residual film (calculated from integral of fig 8.) and from the mass balance ... 93
Table 11 : Chemical composition of AA2050-T3 (wt%). ... 110
Table 12 : Detection limits (C2σ) of the elements analyzed in the different electrolytes. ... 111
Table 13 : Elemental composition and absolute quantity of the residual film after NaOH exposure (calculated from integral of Fig and mass balance). ... 117
Table 14: Elemental composition of AA2050-T3 in wt % ... 135
Table 15: Raman vibrational modes assigned to boehmite, bayerite and gibbsite taken from the literature... 140
Table 16 : Raman vibrational modes for free CO32- and in LDH ... 142
Table 17 : Raman vibrational modes for Li reported in the literature and our study ... 142
Table 18 : IR Vibrational modes for free CO32- and LDH ... 143
21
CHAPTER I
:
INTRODUCTION
&
STATE OF THE ART
“If you know then it is a disaster, and if you don’t know
then it is a greater disaster.”
23
1.
INTRODUCTION
Aluminum is a light, silvery-white metal and mostly the third most abundant metal in the Earth’s crust. It is also one of the most common elements in use today, but it has not always been the case. Etymologically, alumina (and by extension aluminum) comes from the Latin word “alumen”, term used to designate potassium alum KAl(SO4)2.12H2O during the Roman times.
In 1821, Pierre Berthier discovered aluminum ore, called bauxite because he found it near the village of Les-Beaux-de-Provence in southern France. It was not only in 1854 that pure aluminum was successfully extracted by a French chemist, Henri Saint-Claire Deville who saw the potential and the future impact of this metal in our daily life.
Alumina is considered to be one of the most stable oxides and its reduction to produce pure aluminum (Al) is very difficult (∆𝐺 = -1582 kJ mol-1). Throughout much of the 19th century, aluminum was
considered as a very precious metal, as pure aluminum metal was harder to extract from nature than gold or silver. The first kilogram of aluminum manufactured in 1856 was more expensive than silver. As indication of its value, the Emperor Napoleon III had a special aluminum set for his important guests and in 1858, his infant was offered a rattle made of aluminum.
Following the development of cost effective production processes, in less than a century aluminum became one of the most popular structural materials in the world. Today it is used in diverse range of applications in the automobile, construction and packaging industries. In the recent decades, aluminum alloys such as AA2024-T3 (Al-Cu-Mg) have been used in aerospace application for their excellent strength-to-weight ratio. The recent emphasis on developing lighter structures suggest that Al use will increase in the future.
The difficulty with Al is the optimization of mechanical properties with corrosion resistance. It is well-known that the alloying elements control the microstructure, and enhance remarkably the mechanical properties. However, they also lead to a highly heterogeneous surface chemistry leading to a decrease in corrosion resistance. One way to overcome this problem is to protect the aluminum alloy surface by coatings; the most efficient ones are CrVI based coatings. However, CrVI based formulations for surface
treatments are CMR (carcinogenic, mutagenic, reprotoxic) and they have to be progressively removed from the market. Consequently, the focus of research has shifted to finding different alternatives to supersede CrVI. To date, no suitable candidates has been found.
Surface treatments were extensively studied through a large variety of ex situ characterization methods, in view of developing and studying new processes and formulations. The literature describes the use of various techniques such as the scanning electron microscopy, X-ray photoelectron spectroscopy, weight loss measurements or ICP (Inductively coupled plasma) analysis of electrolyte baths to routinely monitor and assess the effectiveness of the surface treatment. It is commonly accepted that parameters such as surface topography, chemical distribution of the alloy, selective dissolution or dissolution rate (“etch rate”) determine the efficacy of the surface treatment. Obviously, the ultimate goal of these
24
characterization techniques is to be able to determine accurately the reactivity of very complex microstructure during the course of the surface treatment. Ideally, this knowledge should help tailoring new CrVI free formulations that will ensure excellent corrosion protection. In this context, the AESEC
(atomic emission spectroelectrochemistry) would correspond to the ideal analytical tool for the in situ analysis of Al alloys reactivity in nearly industrial conditions. This method can give access to quantitative analysis of elemental dissolution rates at open circuit conditions. In addition, it can provide accurate measurement of etch rate, dissolution kinetics for about 30 elements or follow selective dissolution and enrichment mechanisms in real time. This is one of the specific interests of AESEC compared to the ex situ techniques mentioned above. Furthermore, AESEC contribution could be extended to the study of new formulations or alloys and give significant insights pertaining to the mechanisms involved during these surface treatments processes.
The first part of this research was focused on the development of this methodology for our specific application. The AA2024 alloy has been extensively studied in a similar context and it therefore seemed to be the best reference for the optimization and the validation of our methodology, along with the modifications of our analytic procedure. The use of this combination provided answers about the reactivity of the alloy during an industrial pretreatment sequence. It furthermore enabled the determination of dissolution kinetic, the specific observation of the detachment of intermetallic particles and the selective dissolution mechanism in real time. This methodology could be used on a daily basis as a powerful characterization tool. In the long term, this would help to tailor formulations as a function of the substrate and accelerate the development of more environmental friendly coatings.
In a second part, this study was expanded to include the new Aluminum – Copper – Lithium alloy AA2050. Lithium addition proved to be beneficial, as it improves weight reduction and enhances the mechanical properties. However, because it is very light, Li is very difficult to analyze with most of the usual characterization techniques. As a result, unlike the AA2024, no information exists about Li reactivity during surface treatment or about the underlying mechanims. This methodology appears to be the only one that can provide information about the behavior of Li during a complete surface treatment sequence.
This PhD dissertation is organized into 5 chapters:
Chapter I gives a literature review of Al alloys: their manufacture, corrosion susceptibility, general microstructure, with a specific focus on the 2XXX series, AA2024 and AA2050 which are the two alloys studied within the scope of this research project.
Chapter II to V will cover in details the results of the dissertation, and each chapter will be presented as a standalone paper, as the majority is or will be published individually.
Chapter II will present the main methodology used during this PhD and its development, the experimental procedure and the materials studied.
25
Chapter III will be devoted to the presentation of the results on the AA2024-T3 alloy, allowing us to optimize and validate our approach.
Chapter IV will focus on the new Al-Li AA2050-T3 alloy and present the results dealing with the in situ analysis of the corrosion product
Chapter V will be devoted to the surface characterization of the AA2050-T3 after pretreatment and potentiodynamic polarization, in order to provide new data in terms of corrosion product formation mechanisms and its structure.
The preliminary studies and conclusion part will summarize the different results and give the perspectives of this thesis. In addition, some preliminary results on the reactivity of single phases illustrated by the S-phase, and an introduction to the use of statistics applied to the particle detachment during the pretreatment will be given.
26
2.
STATE OF THE ART
2.1.
Generalities on Aluminum
Aluminum consumption has constantly increased since the 19th century and has become the second most
used metal just behind steel. It is widely used for automotive, aerospace, packaging but also building and construction applications. The main benefits of using Al are its low volumetric mass density (2.7 g cm-3), low thermal conductivity (equivalent to 60 % of copper thermal conductivity), and its good
corrosion resistance [1]. Moreover, Al is easily recyclable which is a very important factor in the context of recycle friendly politics.
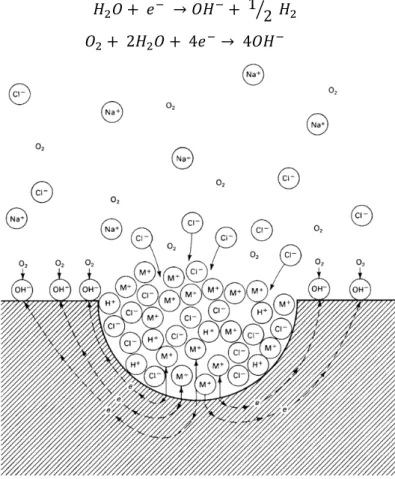
The Pourbaix diagram of Al in water at 25°C is given in Fig. 1. [2] This diagram gives an overview of the thermodynamic stability of Al as a function of potential and pH. This diagram shows that the corrosion of Al is pH - dependent as in acidic and alkaline media (below pH 4 and above 8), a general dissolution of Al will occur to form Al(III) species and generate hydrogen during the reaction:
𝐴𝑙 + 3𝐻+→ 𝐴𝑙3++ 3 2⁄ 𝐻
2 (Acid) (1)
𝐴𝑙 + 𝐻2𝑂 + 𝑂𝐻−→ 𝐴𝑙𝑂
2_+ 3 2⁄ 𝐻2 (Alkaline) (2)
Between these two ranges, Al appears to be kinetically stable by forming a thin film of Al2O3.nH2O
approximately 1 nm thick which protects the metal by forming a barrier between it and the environment. The immunity however is not accessible at potentials below 9, as at this domain, water is no longer stable. The nature of the protective oxide film varies according to the temperature, pH of the electrolyte and immersion time. When Al is exposed to nearly boiling water, relatively thick and amorphous barrier oxide layer, called boehmite can form (Al2O3.H2O 𝛾). At lower temperature however, the bayerite form
is predominant aluminum trihydroxide (Al(OH)3) but other forms of Al oxides can form such as gibbsite
27
Figure 1: Pourbaix diagram of Aluminum in water at 25°C [2].
However, pure Al does not meet the mechanical properties requirements of the market (transport, civil engineering, heat exchangers…[1]), and has to be alloyed with different elements such as copper, magnesium, zinc, lithium or manganese. An International Alloying Designation System was introduced in the 1970s allowing the distinction between alloy series to facilitate their identification between the countries. This designation provides to each alloy a four number series, as the first number refers to the main alloying element present. They have been divided from the AA1XXX series to the AA8XXX series. Table 1 gives the specifications of the different series relative to Aluminum alloys [3][4].
Table 1: Specifications of the different Aluminum Alloy series reported in the literature.
Series
Main alloying elements present in the alloy
1XXX
Pure Al (99.9%) Al2XXX
Al-Cu, Al-Cu-Mg and Al-Cu-Li alloys3XXX
Al-Mn and Al-Mn-Mg alloys4XXX
Al-Si alloys5XXX
Al-Mg alloys6XXX
Al-Mg-Si alloys7XXX
Al-Zn-Mg and Al-Zn-Mg-Cu alloys28
2.2.
Age hardening and thermal treatment.
The age hardening takes a fundamental place in the alloy processing as it defines the microstructure and influence the mechanical and corrosion properties of the alloy. Of all the wrought alloys presented above, only the 2XXX, 6XXX and 7XXX series are heat treatable [5]. These alloys are designed by a letter T and a number which corresponds to specific heat treatment conditions. This designation follows the 4 number series attributed to each alloy. On the other hand, 1XXX, 3XXX, 4XXX and 5XXX are non-heat treatable and their mechanical properties are associated with strain hardening. They are usually alloyed with zinc, iron, chromium or magnesium whereas heat treatable alloys contain higher concentration of copper. Their mechanical properties increase with phase precipitation during the heat treatment. Generally, the age hardening is defined by three steps [6]:
- The solution treatment, generally at 460 - 565°C, where the soluble alloying elements are dissolved in the Aluminum solution.
- The quenching, where the solution is rapidly cooled -usually at room temperature- to obtain a supersaturated solid solution (SSSS) of the alloying element in the Aluminum matrix.
- An age hardening to form from the SSSS the fine precipitates in the Aluminum matrix. The aging parameters (time and temperature) will have an impact on the precipitates size and distribution. Usually the aging temperature is between 115-195°C.
The mechanical properties of the 2XXX series Al alloys are determined by the thermomechanical treatment. Usually, the alloying elements form clusters coherent with the matrix, called Guinier-Preston (GP) zones. These zones are ordered, and they are only one or two atoms planes in thickness. As they grow with temperature and time in the 𝛼(Al) solid solution phase, they become incoherent with the lattice. In the case of the Al-Cu phase diagram, the formation of the 𝜃 phase (Al2Cu) follows this
precipitation sequence:
𝛼𝑆𝑆𝑆𝑆→ 𝐺𝑃 𝑧𝑜𝑛𝑒 → 𝜃′′→ 𝜃′→ 𝜃(𝐴𝑙2𝐶𝑢) (3)
On the other hand, the nucleation of Al-Cu-Mg precipitates is determined by the Al-Cu-Mg ternary diagram:
𝛼𝑆𝑆𝑆𝑆→ 𝐺𝑃(𝐶𝑢, 𝑀𝑔) 𝑧𝑜𝑛𝑒 → 𝑆′′→ 𝑆′→ 𝑆(𝐴𝑙
2𝐶𝑢𝑀𝑔) (4)
The copper in solid solution will segregate as clusters and then precipitate as GP zones to form very rapidly as rods along the < 100 >𝛼 direction. This is followed by the formation of the S’ precipitates as laths in {210}𝛼 planes along < 001 >𝛼 direction. They are semi-coherent and nucleated at dislocations. Fig. 2 represents a section of the ternary Al-Cu-Mg phase diagram at 460°C and 190°C [6].
29
Figure 2: Section of ternary Al-Cu-Mg phase diagram at 460°C and 190°C (estimated). 𝜽= Al2Cu, S=
Al2CuMg, T= Al6CuMg4
2.3.
Aluminum 2024-T3: microstructure
In the past few years, alloy development has been continuously progressing to meet the requirements of the aircraft industry. Al-Cu alloys also referred as the 2000 series aluminum alloys are widely used as they provide an excellent strength to weight ratio, high damage tolerance and fatigue resistance. In the case of the AA2024-T3, an aluminum-copper-magnesium alloy, the addition of Cu and Mg considerably increases the mechanical properties. The enhanced mechanical properties are the consequence of the alloying elements addition with the effect of a heat treatment which allows the control of the alloy features without affecting its weight. Table 2 gives the general composition of the AA2024-T3 used for this study.
Table 2: Chemical composition of AA2024-T3 used during this PhD (wt %)
The heat treatment takes a fundamental place during the alloy manufacture, as the mechanical properties improve with the precipitation of the alloying elements into intermetallic compounds [5]. Recently, Boa et al. reported that these intermetallic particles represent approximately 2.83 % of the total surface [7]. The literature refers to three categories of intermetallic particles which exhibit specific characteristics.
Hardening precipitates start by clustering in the matrix and the grain boundaries from the solid solution
as a called Guinier-Preston zone and they grow by segregation as a function of the temperature and aging time. Their sizes usually vary between 50 nm and few microns and they participate to the
2024-T3
wt %
Al Cu Mg Mn Fe
Si
Zn
Ti
Cr
Ni
Zr
30
mechanical properties. In the case of the 2000 series Aluminum alloys, the S phase-Al2CuMg- or the 𝜃
phase- Al2Cu- are examples of hardening precipitates, furthermore as needles or rods [8].
Dispersoids are the finest intermetallic particles as their sizes do not exceed 500 nm. They form during
the homogenization of the ingot by solid state precipitation. Their main role is to prevent the recrystallization process and to control grain growth. They are highly insoluble, as once formed, they are not affected by age hardening and they are usually associated with Titanium, Zirconium, Manganese or Chromium. For example, Al12Mn3Si, Al3Zr, Al3Ti or Al20Cu2Mn3 typical dispersoids are found in
Al-alloys [3,6].
Constituent particles (also called coarse intermetallic compounds) are the largest intermetallic particles
and they generally do not affect the mechanical properties. One group, usually formed from impurities, is present in the solid solution during the solidification of the initial ingot and they generally do not respond to the heat treatment process. Common constituent particles reported in the literature of this group are Al7Cu2Fe, Al6(Fe,Mn) or Al12(Fe,Mn)3Si [6,7]. The second group however, also called soluble
constituent particles, are composed of the main alloying elements and Al2Cu, Al2CuMg or Mg2Si are
typical examples and can be dissolved during the ingot homogenization [6]. The Al-Cu-Fe-Mn-(Si) particles are irregularly shaped [9], they possess a high hardness [10] and their average size is between 1 to 20 µm. However, their size is considerably reduced (0.5 to 10 µm) during the fabrication of cast ingot where they are fractured and become aligned. Table 3 gives a list of most of the intermetallic particles and their characteristics in 2000 series Al alloys.
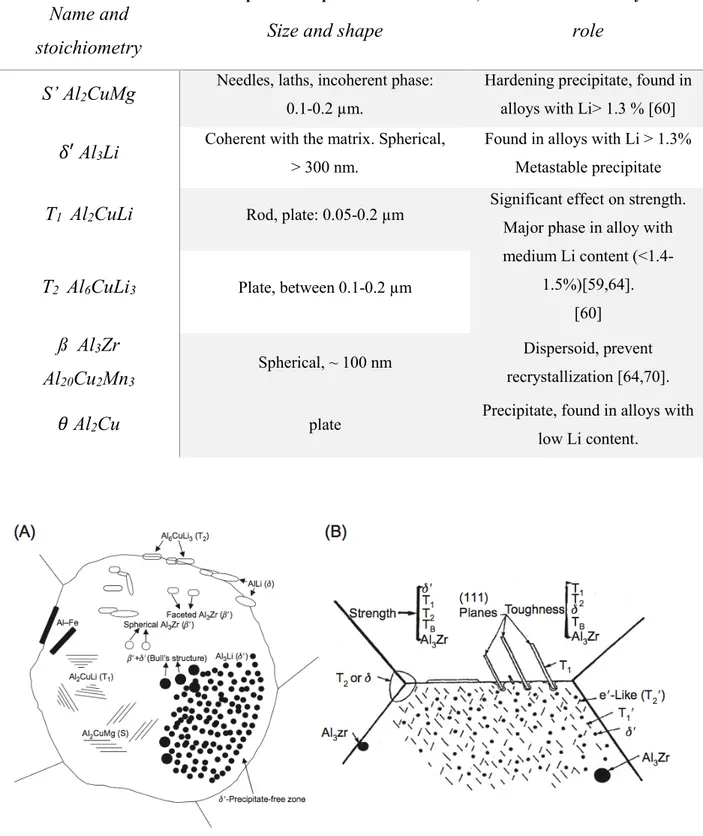
Table 3: List of the intermetallic particles found in 2XXX series Al alloys reported in the literature.
Name and stoichiometry
Size
Characteristics and role
S-phase Al
2CuMg
50 nm to 5 µm spherical [9]
Hardening precipitate or Constituent particle
𝜃 phase Al
2Cu
~ 1 µm Hardening precipitateAl
7Cu
2Fe
Al
3Fe
Al-Cu-Mn-Fe-Si
Al
6Mn
ß phase Mg
2Si
~5-20 µmLarge and irregularly shaped [9]
Constituent particle Do not participate to the
mechanical properties Detrimental effect on the
corrosion resistance [6].
Al
3Zr
0.05 to 0.5 µm DispersoidControl grain growth Retard recrystallization [6]
31
2.4.
Alloy processing and effect of rolling on the surface microstructure
During alloy processing, the final step consists in a mechanical shaping of the alloy to achieve a semi-fabricated form [6]. The ingot passes through two sets of steel or copper rolls that rotate in opposite directions. As a consequence, the slab undergoes a severe deformation reducing its thickness to usually 16-20 mm and up to 1800 mm in width [6,11]. This process, causes a considerable modification to surface and generates a new surface layer, induced by the breakdown of the intermetallic particles, their coverage by an aluminum oxide layer and their redistribution on the surface. This phenomenon has been mentioned in the 1980s and is increasingly studied in the context of corrosion susceptibility and surface treatment of Aluminum alloys. The rolling process will create a new surface layer approximately 3 to 5 µm thick, characterized by a high porosity, fine grain structure [12] and incorporated oxides including 𝛾-Al2O3 and MgO [13] (Fig. 3). The mechanism of the surface modification reported by Fishkis et al.
[13] involves three steps:
- Formations of surface depressions by plowing, adhesive wear, delamination wear or transverse surface cracking,
- Filling of the cavities with wear debris which include oxide, metal and lubricants,
- Coverage of the cavities with a thin metal layer during the rolling process creating a “shingled” surface appearance.
Figure 3: Schematic of the modified structure called Grain Refined Surface Layer (GRSL) resulting from mechanical processing. This zone is characterized by the presence of oxide particulates and a
recrystallized structure [14].
This modified surface layer was defined by Leth-Olsen as the Grain Refine Surface Layer (GRSL); its composition depends on the alloy [15].
Previous studies mentioned an alteration on the particles distribution and reported an increase of the intermetallic particles (Al-Cu and Al-Cu-Mn-Fe) density on the alloy surface after the rolling process [7], accompanied with decrease of their sizes by approximately one third. Moreover, Lunder and
32
Nisancioglu [16] reported that after rolling, the constituent particles were covered by the Aluminum matrix.
However, alloying elements enrichment can also be explained by other theories. Indeed, it has been shown by Textor and Amstutz that elements such as magnesium, lithium or silicon segregate readily to the alloy surface [17]. This surface enrichment was determined by two major mechanisms: a) bulk diffusion which can occur during the heat treatment process and b) grain boundary segregation process [17].
In summary, the complexity of the Al alloy surface and its singular microstructure reveal that parameters such as mechanical processing, storage environment or alloy composition need to be controlled and must be taken into account when considering the application of a surface treatment to the alloy.
2.5.
The corrosion behavior of AA2024-T3
The electrochemical reactivity of AA2024-T3 is controlled by the highly heterogeneous microstructure, and more precisely by the second phase particles as they exhibit a different electrochemical behavior regarding the aluminum matrix [18–24]. It has been shown that Cu as well as the impurities are the main cause of corrosion failure as they create local sites where a micro-galvanic coupling between the particle and the matrix occurs [8,9,25–28]. Over the years, the reactivity of AA2024-T3 has been extensively studied to understand the mechanisms and determine the factors involved during the corrosion process. In this chapter, only the most common corrosion mechanisms along with the contribution of different intermetallic particles will be presented.
2.5.1.
The pitting corrosion of Aluminum
Pitting is considered to be the most common mechanism of corrosion propagation for pure aluminum and high strength Al-alloys. The different steps involved during the pitting process were extensively studied and reported in the literature [29–34] (Fig. 4.): a) the film breakdown b) metastable pitting c) pit growth and d) pit stifling or death. The pit initiation - propagation is also facilitated by the presence of halides such as chloride ions in solution. These ions are very-well known to be aggressive to aluminum oxide as they will adsorb at the surface of the oxide film. Then adsorption of Cl- on the oxide
occurs, preferentially localized on the irregularities of the film.
Secondly, the Cl- ions migrate through the film, creating a defect which exposes the bare metal to the
solution. This will induce a pit propagation through the metal, nevertheless, a majority of the pits will not propagate and rapidly passivate. Those pits which initiate and grow only for a limited period before being passivated are called metastable pits. Indeed, the growth and propagation of pit requires very specific conditions such as local acidification and a high chloride concentration which is not always the case. At the bottom, the pit initiation is determined by the Aluminum oxidation and water hydrolysis:
33
𝐴𝑙 → 𝐴𝑙3++ 3𝑒− (5)
𝐴𝑙3++ 𝐻
2𝑂 → 𝐴𝑙(𝑂𝐻)2++ 𝐻+ (6)
followed by chloride hydrolysis:
𝐴𝑙(𝑂𝐻)2++ 𝐶𝑙−→ 𝐴𝑙(𝑂𝐻)𝐶𝑙+ (7)
𝐴𝑙(𝑂𝐻)𝐶𝑙++ 𝐻
2𝑂 → 𝐴𝑙(𝑂𝐻)2𝐶𝑙 + 𝐻+ (8)
where this reaction will generate a net gain of H+ ion, involving a pH decrease.
On the other hand, on the surface, the cathodic reactions will take place with the oxygen and water reduction reactions. As a consequence, a decrease of the pH will occur leading to the dissolution of the Al matrix:
𝐻2𝑂 + 𝑒− → 𝑂𝐻−+ 1 2⁄ 𝐻
2 (9)
𝑂2+ 2𝐻2𝑂 + 4𝑒−→ 4𝑂𝐻− (10)
Figure 4: Autocatalytic process occurring during the propagation of a pit in aerated NaCl solution. The metal M undergoes active dissolution at the bottom of the pit, while oxygen reduction takes place
at the surface [35].
Several studies focused on the effect of the intermetallic particles on the pitting corrosion behavior of Al-Cu alloys. For example, Buchheit and more recently Birbilis and Buchheit collected the electrochemical potential of various intermetallic particles in chloride containing solutions [18,19,36]
34
(Table 4) as an attempt to predict their electrochemical behavior regarding to the matrix. Depending on the intermetallic composition, the particle can act anodically or cathodically with respect to the matrix and affect the pit initiation or morphology [37]. For example, particles such as Al2Cu, Al7Cu2Fe or Al3Fe
act as cathodic site and promote the pit initiation at the periphery of the particle [9,38–41]. In such case, the attack is mainly localized on the matrix leaving the particle non attacked as reported by several researchers [42,43]. However, if the particle is active, this may cause selective dissolution, also reported as a dealloying effect. In this case, the pits are found to be in the particle and are in this case usually deeper.
Table 4 : Corrosion potential of various intermetallic phases reported in the literature.
Phase
E
SCE(V)
Environment
Aeration
Al
2Cu
-0.7 -0.695 0.5 M NaCl 0.6M NaCl Air [19] Not stated [18]Al
7Cu
2Fe
-0.654 0.6 M NaCl Not stated [18]Al
3Fe
-0.910 -0.566 0.5 M NaCl 0.6 M NaCl N2 [19] Not stated [18]Al
2CuMg
-0.920 -1.061 0.5 M NaCl 0.6 M NaCl Ar [19] Not stated [18]Al
3Zr
-0.625 -0.801 0.5 M NaCl 0.5 M NaCl N2 [19] Not stated [18]Al
6Mn
-0.913 0.6 M NaCl Not stated [18]Al
2CuLi
-1.096 0.6 M NaCl Air [19]Al
20Cu
2Mn
3 -0.617 0.6 M NaCl Not stated [18]2.5.2.
Intergranular corrosion
The intergranular corrosion propagates along the grain boundaries and can rapidly propagate into the bulk material. As a consequence, the mechanical properties can be seriously affected by the formation of cracks that could, in long term, cause the breakdown of the material. The intergranular corrosion behavior is systematically related to the distribution of Cu in the solid solution. This is usually caused by the heat treatment, which promotes the precipitation of Cu-rich phases such as Al2Cu along the grain
boundaries, subsequently creating a favorable environment for a galvanic coupling between the matrix and the grain boundary. Several studies highlighted the link between pitting corrosion and intergranular corrosion: Zhang and Frankel [44] showed for AA2024-T3 during potentiodynamic polarization, the presence of two breakdown potentials corresponding respectively to the S-phase dissolution and the initiation/propagation of intergranular corrosion. These two breakdown potentials were previously reported by Galvele et Micheli and Guillaumin and Mankowski [8] for high Al-Cu alloys. Galvele and Micheli [45] attributed the first breakdown to the dissolution of Cu-depleted zone and the second to the
35
pitting of grain bodies shown in Fig. 5 (this mechanism will be described in details later). On the other hand, Guillaumin and Mankowski suggested that the first breakdown was caused by the dissolution of the anodic S phase and the second to the precipitate free zone around the particles.
Figure 5: Representation of a grain boundary zone where the 𝜽 phase is found at the grain
boundaries, surrounded by a Cu-depleted zone and the 𝜶-Al matrix [45].
2.5.3.
The effect of the S-phase particle (Al
2CuMg)
The S phase is a particle specific to Al-Cu-Mg containing alloy and they represent approximately 60 % of the intermetallic surface area [46]. This particle exhibits a significantly less noble potential regarding the aluminum matrix and undergoes active dissolution [23,24,46]. Most of the time, pits initiate at the periphery and on the particle. Many tried to understand the corrosion mechanisms involved with the S-phase and its effect on the corrosion of surface finishing. Several theories were discussed in the literature, for example, Buchheit suggested a corrosion process through dealloying (Fig. 6). First, Buchheit, Guillaumin and Mankowski detailed that the magnesium contained in the particle will dissolve, leaving a typical sponge-like shape on the surface [8,47]. The Cu left on the surface will lead to an increase of the particle potential. This Cu rich sponge will then act as a cathode and generate the dissolution of the surrounding matrix showed by characteristic trenches around the particles. Contrastingly, other studies observed the presence of Copper deposits at the periphery of the particles and presented a different mechanism. Buchheit et al. suggested that during the dealloying of the S-phase particle, some Cu-rich clusters will be transported in the solution through a non-faradaic process [47– 50]. The metallic copper, which is no longer in electrical contact with the matrix, will be oxidized by the oxygen present in solution and precipitate as copper oxide. In summary, the major difference between these two theories is that one dissolution mechanism is only driven by a galvanic coupling switch between the particle and the matrix, and the second however, involves a particle detachment/redeposition process. The role and the importance of the S-phase in the Cu enrichment and redistribution process has been also highlighted by the work of Vukmirovic et al. [51], who
36
demonstrated a significant increase of Cu by comparing a commercial AA2024 and a synthetic AA2024 after 0.5 M NaCl exposure.
Figure 6: Dealloying process of a S-phase particle. Al and Mg dissolve and form a hydrous gel around the particle. As a result, Cu clusters detach from the intermetallic and are oxidized. They
may be redeposited at the periphery of the particle [47].
On the contrary, Zhu et Van Ooij [52] presented a mechanism involving a pH increase at the periphery of the S-phase as a result of the oxygen reduction reaction. When the S-phase is exposed to the solution, the selective dissolution of the magnesium and aluminum contained in the particle will occur. As the particle undergoes dealloying, the copper content will increase, leading to an increase of the cathodic surface area which promotes the formation of a significant amount of hydroxyl ions, generated by oxygen and water reductions. Once the pH of the environment surrounding the particle reaches a value above 9, the aluminum in contact with the particle may dissolve. Consequently, in the opposite to the other mechanism, the dissolution of the matrix is not a result of the galvanic switch occurring between the particle and the matrix but is induced by a local alkalization caused by oxygen and water reduction (Fig. 7).
37
Figure 7: Dealloying phenomena of a S-phase particle. Al and Mg dissolve and leave Cu remnant on the surface which increase the cathode area and oxygen reduction. The formation of OH- induce a
local alkalization and the dissolution of the 𝜶-Al matrix [52].
Additional results have been proposed by Jorcin et al. [27] corroborating the idea of a matrix dissolution driven by a local pH increase. They demonstrated, by using a pH indicator (bromothymol blue), that the Al/Cu interface sustains high ORR (oxygen reduction reaction) reactions.
2.5.4.
The effect of the 𝜽 phase (Al
2Cu)
The corrosion process involved with the Al2Cu has also been extensively studied, mainly in chloride
containing environment, and is determined to be driven by a dealloying process. It has been found that this particle acts as a local cathode as its corrosion potential is more noble than the aluminum matrix (corrosion potential). Lebouil et al. demonstrated by AESEC the Cu build-up on the surface of the particle during anodic polarization [53]. Nevertheless, the current densities supported by the Al-Cu intermetallic particles were shown by Lacroix et al. to be 10 times lower than the Al-Cu-Mg intermetallic particles [28]. Moreover, Buchheit et al. also noted the generation of copper ions when the particle is cathodically polarized demonstrating its major role during the corrosion process of Al alloys [47].
2.5.5.
The effect of Al
7Cu
2Fe and Al-Cu-Fe-Mn particles
The Al-Cu-Fe-Mn containing phases represent roughly 40 % of the constituent particles found in the AA2024-T3 alloy. The effect of Fe-containing intermetallic particles such as Al7Cu2Fe on the corrosion
behavior of Al alloys was for a long time not well documented. Fe usually comes from impurities and form the coarse precipitates known also as constituent particles which usually act as cathodic site [23,24,54]. The particles are irregularly shaped, sometimes break into pieces during the rolling process and the particles parts align along the rolling direction. Although the presence of this particle has been noted in AA2024, the electrochemical behavior and the role of Al7Cu2Fe have only been investigated
recently by Ilebevare et al. [55] and further by Birbilis et al. [56]. For example, Birbilis showed that Al7Cu2Fe supports ORR (oxygen reduction reaction) at high current densities over a different range of
![Figure 1: Pourbaix diagram of Aluminum in water at 25°C [2].](https://thumb-eu.123doks.com/thumbv2/123doknet/7765252.255850/28.892.240.634.104.505/figure-pourbaix-diagram-of-aluminum-in-water-at.webp)

![Figure 9: Schematic illustration of the phase changes occurring within Alloys A and B as a result of SHT (solution heat treated) and aging at 200°C [74]](https://thumb-eu.123doks.com/thumbv2/123doknet/7765252.255850/45.892.302.597.107.487/figure-schematic-illustration-changes-occurring-alloys-solution-treated.webp)
![Figure 10: Potentiodynamic polarization curves of different phases T 1 , ࣂ and the ࢻ-Al matrix in NaCl A) after direct immersion B) after 10 days of immersion [75]](https://thumb-eu.123doks.com/thumbv2/123doknet/7765252.255850/46.892.127.770.294.535/figure-potentiodynamic-polarization-curves-different-phases-immersion-immersion.webp)
![Figure 11 : Schematic of the AESEC method referring to the coupling of an electrochemical flow cell and the ICP-OES [111]](https://thumb-eu.123doks.com/thumbv2/123doknet/7765252.255850/57.892.128.748.179.444/figure-schematic-aesec-method-referring-coupling-electrochemical-flow.webp)

![Figure 16 : Picture and schematic of the plasma torch, adapted from [123].](https://thumb-eu.123doks.com/thumbv2/123doknet/7765252.255850/63.892.221.647.116.420/figure-picture-schematic-plasma-torch-adapted.webp)
