HAL Id: hal-01347331
https://hal.archives-ouvertes.fr/hal-01347331
Submitted on 20 Jul 2016
HAL is a multi-disciplinary open access
archive for the deposit and dissemination of
sci-entific research documents, whether they are
pub-lished or not. The documents may come from
teaching and research institutions in France or
abroad, or from public or private research centers.
L’archive ouverte pluridisciplinaire HAL, est
destinée au dépôt et à la diffusion de documents
scientifiques de niveau recherche, publiés ou non,
émanant des établissements d’enseignement et de
recherche français ou étrangers, des laboratoires
publics ou privés.
Measuring Surrounding Space to Assess the Pedestrian
Visual Aperture Angle in the Urban Fabric: Toward a
Kurtosis-Based Isovist Indicator
Thomas Leduc, Vincent Tourre, Philippe Woloszyn, Francis Miguet
To cite this version:
Thomas Leduc, Vincent Tourre, Philippe Woloszyn, Francis Miguet. Measuring Surrounding Space to
Assess the Pedestrian Visual Aperture Angle in the Urban Fabric: Toward a Kurtosis-Based Isovist
Indicator. Vasily V. Popovich; Christophe Claramunt; Thomas Devogele; Manfred Schrenk; Kyrill
Korolenko. Information Fusion and Geographic Information Systems - Towards the Digital Ocean,
5, Springer Berlin Heidelberg, pp.129-142, 2011, 978-3-642-19765-9. �10.1007/978-3-642-19766-6_11�.
�hal-01347331�
Measuring surrounding space to assess the
pedestrian visual aperture angle in the urban fabric:
towards a Kurtosis based isovist indicator
Thomas Leduc1, Vincent Tourre1,2, Philippe Woloszyn3, Francis Miguet1
1
CERMA Laboratory, CNRS – 6, quai François Mitterrand, BP 16202, 44262 Nantes cedex 2, France
2
Ecole Centrale de Nantes - 1 rue de la Noë, BP 92101, 44321 Nantes cedex 3, France
3
ESO Laboratory, CNRS - Maison de la recherche en sciences sociales, Université Rennes 2, Square Henri Le Moal, 35043 Rennes cedex
{Thomas.Leduc, Francis.Miguet}@cerma.archi.fr Vincent.Tourre@ec-nantes.fr
Philippe.Woloszyn@univ-rennes2.fr
Abstract. Partial isovists fields are useful methods to analyze the urban
morphology taking into account the visual perception of the pedestrian. However, as previous studies involve a constant visual aperture angle all along the pathway, this paper presents an adaptative method of aperture angular variation according to urban morphology properties. Aperture angle increasing, nearby a square or at roads junction, or decreasing within a canyon street should improve the micro-behavior visual perception in our simulations. With showing that traditional isovist's shape indicators are not well adapted to achieve urban environmental properties, the aim of this paper is to present this new methodology based on a statistics standardized moment called Kurtosis. Our results show that this method could be used to define a surrounding space typology, one step more towards the modeling of visual dynamics.
Keywords: isovist, function of radial distance, statistics moment, Kurtosis,
1 Introduction: background and objectives
In [1] partial isovists fields have been used to exhibit the fact that it is worth taking strategic visual properties into account in the design of a patrimonial tour in a historic city center. However, in this study, visual aperture angle is constant all along the pathway. It could be interesting to increase it automatically nearby a square or at a roads junction, or decrease it entering a canyon street. That is to say, to improve the micro-behavior visual perception in our simulations, we need to determine the type of surrounding space. The aim of this paper is to show that traditional isovist's shape indicators are not well adapted to achieve such a task. The new one presented here is based on a statistics standardized moment called Kurtosis.
1.1 Shape of the open-space – brief overview of visibility analysis
[2] noticed that “Walls and ceilings, buildings and trees, are positioned in such a way as to modulate experience: not just the experience of those very walls and ceilings (and buildings and trees), but the experience of the people and signs, images and machines, and so on, that move about and populate the room or cityscape”. To this end, the “Theory of Isovists” was developed [3]. An isovist is the set of all points in an environment of opaque surfaces that are visible to a given point, x (the limit of the isovist is an artificial one functioning something like a horizon in the absence of any other intervening surfaces).
This 2D bounded polygon is a useful tool to define the open space concept. From a morphological point of view, open spaces are usually defined as the empty space, the void, between the surrounding buildings. However, although these open spaces are not material components of the physical world, they can be conceived as part and parcel of our urban heritage [4]. [5] puts the emphasis on the fundamental motivations of conducting visibility analysis research. He noticed that the key questions “how far can we see”, “how much can we see”, and “how much space is enclosed” are relevant to develop good urban design.
Essentially, isovists describe local geometrical properties of spaces with respect to individual observation points and weight all the possible view directions equally (see Fig. 1). An isovist is a 2D horizontal slice of pedestrian's surrounding space.
Fig. 1. Isovist symbolic representation (extracted from [6]). The observer is comparable to a visual sensor. Corresponding isovist is the set of all points visible from his given viewpoint punctual position in space with respect to an environment (that is taking surrounding occluding surfaces into account).
1.2 Analyze the visual dynamics of the pedestrian mobility in the urban fabric: lack of a relevant scalar indicator
As written in [2], every point in an environment generally has a uniquely shaped isovist belonging to it. [2] defined five useful measures: the area of the isovist (A), the perimeter of the isovist (P), a measure of the length of the radial (Q), a statistical measure of the variability of the boundary’s distance from viewpoint (M2, the standard deviation), and a measure of the asymmetry of M2 (M3, the skewness). He noticed that our impression of spaciousness is evoked by high A, low P, low Q, and high M3 (M2 seemed to make little difference). Cityspaces and parts of them that have these characteristic values - relative to the local norm - will be perceived as more spacious than those with any other combination.
[7, 8] calculate some other isovist’s geometrical properties such as: - The area to perimeter ratio,
- The circularity (area of a perfect circle whose radius is set to the mean radial length of the isovist divided by the isovist area),
- The drift (distance between the view-point, i.e. the location from which the isovist is generated, and the centre of gravity of the isovist),
- The minimum, mean and maximum radial lengths.
The aim here is to characterize the isovist shape using a relevant indicator. The one mentioned before seem to be inaccurate for some different reasons. Perimeter, area, minimum, mean and maximum radial lengths, but also circularity, are too directly connected with the shape’s scale. The required indicator has to be a dimensionless quantity (independent of any linear change of scale). The drift is a measure of displacement between the centroid of the isovist and its viewpoint. Therefore, as the circularity or the area to perimeter ratio, it is a useful tool for measuring the difference
between actual and ideal geometric shapes. Such an isovist’s surface property does not match our requirement because of the jaggedness of such a shape in the urban context. Moreover the drift parameter is not adapted because, in a given canyon street, for each pedestrian’s punctual position, the isovist remains unchanged (so as its own centroid) whereas the view-point’s position changes.
Finally the standard deviation of the isovist’s radials (M2) and their skewness (M3) measure respectively the “width” of the distribution of radials lengths and the “asymmetry” of the distribution of lengths (it indicates if the values are relatively evenly distributed on both sides of the mean radial length). These two last statistics indicators do not provide a measure of the “peakedness” (whether the data are peaked of flat) of the radials lengths distribution. The 4th standardized moment (also called Kurtosis, M4) is the right shape indicator to identify such a feature. Indeed, a higher Kurtosis means that the variance is the result of infrequent extreme deviations, as opposed to frequent modestly sized deviations.
1.3 Need of a geoprocessing approach - declarative Geoprocessing with the Gearscape Geoprocessing Language
An urban pedestrian pathway and a visualscape are both data that include a spatial component. What is required here is some tool able to process these spatial data using: on one hand the table-oriented programming paradigm (for its table-friendly syntax, its fundamental and consistent collection operations, and its easiness of understanding) and, on the other hand, batch processing with parametric ability and procedural extension. We pretend that the use of a spatial SQL with semantics ability is essential to perform such an objective. That is the reason why we need to take benefits from the GearScape Geoprocessing Language (GGL) specific layer [9], aside the features of robustness, scalability, and easy to use main characteristics.
GGL is a partial implementation of both the SQL'92 standard and the OGC Simple Feature Access.
2 Approach and methods
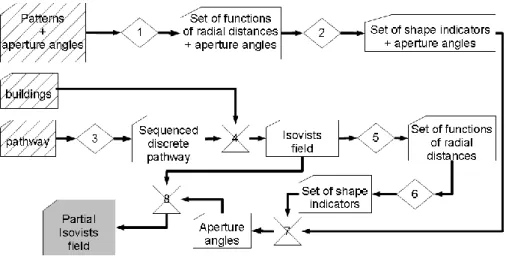
The aim here is to characterize the isovists shapes using a relevant indicator. The method we used is based on a “surface ray casting” strategy presented in the 2.1 and 2.2 subsections. The simplified schema presented in Fig. 2, sums up the whole spatial process we have identified. It is composed of 8 main operations.
Fig. 2. Processing schema we have adopted. The sequence is composed of 8 main operations. Input maps are 45 degrees wide hatched, intermediate results have no background color and final output result is colored in gray.
Steps 1 and 2 are used to build our set of reference indicators. It is a one-shot pre-processing that can be then re-used several times with different urban fabric. Step 1 takes as input data a set of patterns characterizing the city junctions and roads associated with an aperture angle; these patterns are converted into a set of functions of radials distances. From these functions, the reference set of shape indicators is computed in step 2. Steps 3 to 6 are devoted to the actual position of the pedestrian. Step 3 transforms the real pathway into a discrete one (set of equidistant punctual positions) and step 4 computes the corresponding isovists field. Step 5 converts each isovist into a function of radial distance (as in step 1) and step 6 computes for each of them the respective shape indicators (as in step 2). Steps 7 and 8 are spatial join queries between the reference set and the pedestrian pathway: step 7 determines the aperture angle of the pedestrian comparing the Kurtosis of the position against the reference set and step 8 restricts the isovists field to a partial isovists field applying the aperture angle to the previous (full) isovists field.
2.1 Towards an Isovist’s fingerprint
As we need to compute shape indicators from isovist data onto a 1D function, the isovist polygon, which is a complex shape, is transformed into a 1D real-valued function. This reduction of the dimension space is achieved through the sampling of the isovist in polar coordinates with a regular angle (see Fig. 3 and 4). This 1D function is then plotted to obtain a profile that can be seen as a fingerprint of the corresponding isovist's polygon.
Fig. 3. Bird eye view of an isovist in the Nantes (France) city center (buildings are represented by dark gray polygons). The viewpoint, pedestrian punctual position at a given time, is represented by a black focal point. Its corresponding isovist is the pale gray polygon (its perimeter is a black dotted line). 16 isovist radials are drawn (regularly spaced by an angle of 22.5°).
Fig. 4. (Left column) Isovist sampled into several equidistant isovist’s radials: 16 radials on top line and 512 on the bottom one. (Right column) Profiles of radial lengths all around the viewpoint. In each profile, x-axis corresponds to the angle values (in degrees) and y-axis to the radial length. The angle increases in the counter-clockwise direction.
In practical terms, we have chosen to sample the urban isovists into 1024 radials. Indeed, such an angular abscissa sampling is of enough fine granularity for the urban fabric. Thus, it gives the possibility to detect metric fluctuation at a distance of more than 160 meters.
2.2 Isovists’ statistics moment
According to the Hausdorff [10, 11] moment problem in mathematics, for a bounded input interval (as may be seen below, ours is defined by [0, 2π[), a given infinite sequence of moments is a necessary and sufficient condition to define a probability distribution of this observation space. The corresponding normalized central moments of the isovists probability distribution are dimensionless quantities, which represent the distribution independently of any linear change of scale.
As the k standardized moment of a continuous univariate probability distribution x with probability density function p(x) is defined by:
x
d
x
p
x
x
X x k
(1)where respectively average value and standard deviation are defined by:
x
p
x
d
x
x
X x
x
x
p
x
d
x
X x
2
(2)The isovist boundary (from the viewpoint point of view), can be seen as a continuous function from [0, 2π[ to R+. It associates each input azimuth angle α to an output radius' length r(α). In this specific context, the Kurtosis or 4th standardized moment formula mentioned before may be simplified into:
d
r
r
2 0 4)
(
2
1
(3)As written in this last formula, a simple line integral has to be calculated on the classical [0, 2π[ domain of integration.
2.3 Patterns of roads or roads’ junctions
The aim of this section is not to provide the reader an exhaustive typology of urban roads or roads junctions. In existing cities, streets design is quite complex and heterogeneous. We will limit our inventory to few simple and commonly used patterns such as the crossroad (pattern number 9), the Y junctions (patterns number 5, 17, and 33), the straight piece of road (pattern number 4), and the cul-de-sac (patterns number 0, 12, and 28). Indeed, the piece of core inventory presented in Fig. 5 corresponds to some representative urban locations of our use cases.
Fig. 5. Some patterns of roads or roads’ junctions.
3 Use cases - results
The pedestrian pathways we have to analyze are more or less of 1.5 km length. To characterize them using isovists field tool, we have to sample them into a set of about one thousand points regularly distributed all along each pathway. Due to the huge amount of involved geo-processes, this task requires a scalable indicator. The one-dimensional one, resulting from the previous line integral, is enough robust, easy and efficient to compute.
3.1 Patterns’ characterization using the statistics moments
As described in the chain of processes (Fig. 2), the pre-processing phase consists in two tasks. The first one samples each pattern into a set of functions of 1024 radials distances and the second one computes the spatial indicator of each radials distribution.
Empirically, we noticed that this dimensionless indicator seems to depend on the patterns’ largest radial length (assuming the street’s width is a constant). That is the reason why, in practice, we divide the Kurtosis value by the largest radial length so as to stabilize the values presented in Table 1. To emphasize this nuance, we have decided to call this indicator “relative Kurtosis”.
As may be noticed, the crossroad’s relative Kurtosis (pattern 9) is less than 2, the Y junctions’ relative Kurtosis (patterns 5, 17, and 33) is almost equals to 4, the straight piece of road’s relative Kurtosis (pattern 4) is almost equal to 6 and the cul-de-sac’s relative Kurtosis (patterns 0, 12, and 28) is greater than 13. This key indicator seems not only differentiating but also stable.
Table 1. Relative Kurtosis value for each pattern. The given values correspond to
streets of 8 meters width and to squares of 24 meters of radial length. The streets length’s confidence interval starts from about 160 meters to 1600 meters.
Pattern id Relative Kurtosis
0 13.6 4 5.8 5 3.2 9 1.9 12 16.9 17 3.9 28 16.5 33 4.1
3.2 A Nantes’ pathway characterization using the statistics moments
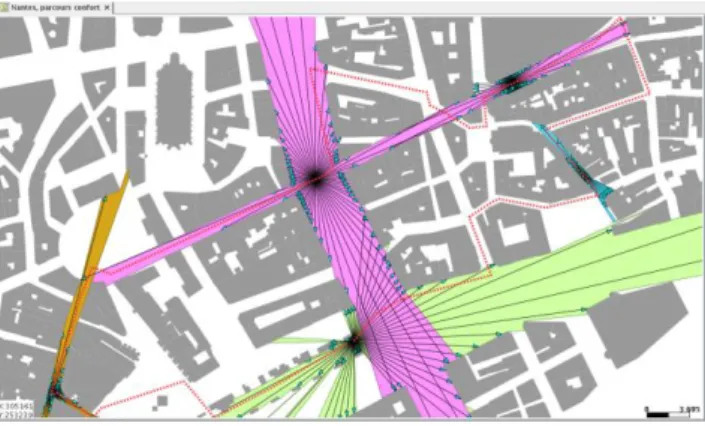
In order to exhibit the relevance of our model and its potentialities, we have decided to apply it to a pedestrian pathway called parcours confort1 proposed by the Nantes
Métropole Tourist Office (see Fig. 6). This tour, accessible to all (even for people in a
wheelchair), proposes to those who have some time to spend wandering in Nantes, a west-coast located city in France, a discovery of the historical city center from medieval to 19th century morphologies.
Fig. 6. Overview of one of the Nantes Métropole Tourist Office tour in the historical city center (dashed line). This path is sampled into 983 discrete locations. On each of them a full isovist is computed. In this figure, only 5 of them are represented.
This 1590 meters long tour has been divided into 983 equidistant punctual locations or time steps. The distance between each of these locations is equal to 1.6 meter (time-slice between two successive "snapshots" is approximately equals to 1.5 second for a walking speed of about 4 km/h). In each location, an isovist has been computed and transformed into a discrete function of 1024 radials distances so as to
obtain corresponding Kurtosis. As shown in Fig. 7, this scalar indicator helps us identify some of the previously mentioned streets patterns.
Fig. 7. Among all the 983 computed isovists, 4 have been selected with their corresponding Kurtosis shape indicators. As may be seen in this Figure, the relative Kurtosis values make it possible to identify digitally the right patterns.
3.3 Characterization of a pathway in the city of Le Havre using the same techniques
To put this new morphological indicator to the test, we have decided to apply the same techniques to a city, located in Normandy (France), called Le Havre. As written on its tourist office website2, Le Havre city centre is the first 20th century urban settlement in Europe to be added to the World Heritage List. Indeed, this city centre, the largest post-war unitary reconstruction site, presents a particular (orthogonal grid based) morphology.
Because of its really specific morphology (but also completely different from the previous one), one must admit that this second use case is relevant to test the robustness of our new indicator.
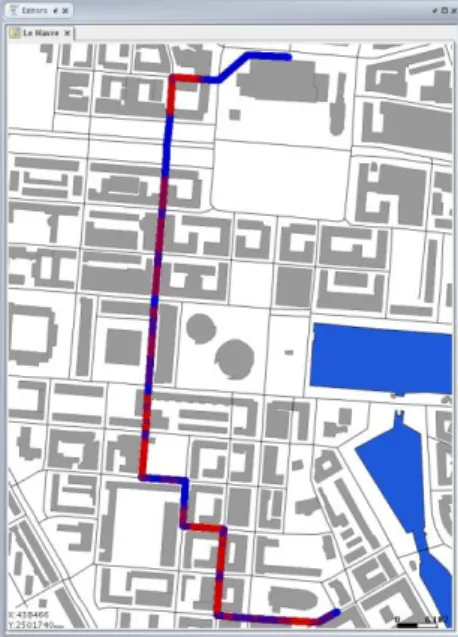
The pedestrian tour we now focus on, starts from the back of the cathedral and ends at the city council. As in the Nantes city use case, this 1350 meters long tour has been divided into 844 equidistant punctual locations or time steps (see Fig. 8).
Fig. 8. A colored classification based on the relative Kurtosis for each of the 844 locations.
Fig. 9. Zoom in on some locations. As may be seen in this Figure, the relative Kurtosis makes it possible to identify digitally the right patterns.
The zoom in presented in the Fig. 9, focuses on four punctual locations and exhibits the four corresponding relative Kurtosis values. It is obvious that those values correspond respectively to the ones of the patterns number 4 and 9. These similarities help us identify patterns for each location in an automatic and quantitative way.
4 Conclusion and future plans
We proposed in this paper a new shape indicator based on the combination of the isovists method and the Kurtosis moment that allows characterizing an urban environment. This shape indicator has been developed in the context of the GGL geoprocessing language in order to perform efficient space queries on the whole pedestrian pathway. Two case studies are presented on pedestrian tours in two different city centers. They both show that our indicator is able to detect some types of crossroads, building in this way a space typology that takes into account visual perception.
Nevertheless in this new way to use the isovist concept, the reference patterns list has been shortened in order to keep only the patterns which seem obvious to characterize. Therefore, the patterns list has to be extended and the characterization of each pattern has to be validated by in situ surveys. These surveys will be performed in new study sites in order to achieve other case studies in various urban environments.
Concerning the whole process presented in Fig. 2, we must admit that the work is still on progress. Indeed, with this new indicator, we are now able to determine the type of surrounding space. What still remains to do is to bind a visual aperture angle to each pattern, and restart the whole partial isovists’ fields computations.
Moreover, further developments of the presented model will achieve sound field modeling in urban acoustics, with using angle-dependent isovists for urban areas predictions of soundscapes of far-field diffusion behavior.
For that aim, this new method to compute diffusive properties of the urban built network will determinate the surrounding acoustic properties of a receiver with isovists fields computational tools, operated in real-time geographic environmental systems.
Acknowledgments. The AMBIOFLUX project is funded by CNRS and the French MEDDTL Ministry under PIRVE’s (Programme Interdisciplinaire de Recherche
Ville et Environnement) contract #1004. Special thank to Fernando GONZÁLEZ
CORTÉS (Spain) for all the developments performed on the GearScape platform.
References
1. Leduc T., Miguet F., Tourre V., Woloszyn P. (2010). Towards a spatial semantics to analyze the visual dynamics of the pedestrian mobility in the urban fabric. In Painho, M., Santos, M. Y., and Pundt, H. (eds), Geospatial Thinking (associated to the 13th AGILE International Conference on Geographic Information Science, Guimaraes, Portugal - AGILE’2010), Lecture notes in Geoinformation and Cartography (LNG&C), pages 237-257. Springer-Verlag, Berlin Heidelberg. 2. Benedikt M. L. (2008). Cityspace, Cyberspace and the Spatiology of information.
Journal of Virtual Worlds Research, 1(1):22p.
3. Benedikt M. L. (1979). To take hold of space: isovists and isovist fields. In Planning and design: Environment and Planning B, 6(1):47-65.
4. Teller J. (2003). A spherical metric for the field-oriented analysis of complex urban open spaces. Planning and design: Environment and planning B, 30(3):339-356.
5. Batty M. (2001). Exploring isovist fields: space and shape in architectural and urban morphology. In Planning and design: Environment and planning B, 28(1):123-150.
6. Conroy R. (2001). Spatial Navigation in Immersive Virtual Environments. PhD thesis. The faculty of the built environment, University College London, London, U.K.
7. Conroy Dalton R. and Dalton N. (2001). OmniVista: an application for Isovist field and path analysis. In 3rd International Space Syntax Symposium, Atlanta, Georgia, USA.
8. Weitkamp G. (2010). Capturing the view: a GIS based procedure to assess perceived landscape openness. PhD thesis, Wageningen University, The Nederlands.
9. González Cortés F. and Leduc T. (2010). GGL: a geo-processing definition language that enhance spatial SQL with parameterization. In 13th AGILE International Conference on Geographic Information Science, Guimaraes, Portugal.
10. Hausdorff F. (1921). Summationsmethoden und Momentfolgen. I. In Mathematische Zeitschrift, 9: 74-109.
11. Hausdorff F. (1921). Summationsmethoden und Momentfolgen. II. In Mathematische Zeitschrift, 9: 280-299.
![Fig. 1. Isovist symbolic representation (extracted from [6]). The observer is comparable to a visual sensor](https://thumb-eu.123doks.com/thumbv2/123doknet/7795564.260473/4.892.331.581.234.473/isovist-symbolic-representation-extracted-observer-comparable-visual-sensor.webp)