HAL Id: hal-00497888
https://hal.archives-ouvertes.fr/hal-00497888
Submitted on 29 Apr 2014
HAL is a multi-disciplinary open access
archive for the deposit and dissemination of
sci-entific research documents, whether they are
pub-L’archive ouverte pluridisciplinaire HAL, est
destinée au dépôt et à la diffusion de documents
scientifiques de niveau recherche, publiés ou non,
Nonlinear optical imaging of lyotropic cholesteric liquid
crystals.
Ariane Deniset-Besseau, P. de Sa Peixoto, G. Mosser, Marie-Claire
Schanne-Klein
To cite this version:
Ariane Deniset-Besseau, P. de Sa Peixoto, G. Mosser, Marie-Claire Schanne-Klein. Nonlinear optical
imaging of lyotropic cholesteric liquid crystals.. Optics Express, Optical Society of America - OSA
Publishing, 2010, 18 (2), pp.1113-1121. �10.1364/OE.18.001113�. �hal-00497888�
Nonlinear optical imaging of lyotropic
cholesteric liquid crystals
Ariane Deniset-Besseau,1 Paulo De Sa Peixoto,2 Gervaise Mosser,2 and Marie-Claire Schanne-Klein1,*
1Laboratoire d’Optique et Biosciences, Ecole Polytechnique, CNRS, INSERM U696, 91128 Palaiseau, France 2Laboratoire de Chimie de la Matière Condensée, CNRS, Université Paris 6, 75252 Paris, France
Abstract: We use nonlinear optical microscopy combining Second
Harmonic Generation (SHG) microscopy and Two-Photon Excited Fluorescence (2PEF) signals to characterize collagen lyotropic liquid crystals. We show that SHG signals provide highly contrasted images of the three-dimensional texture of cholesteric patterns with submicrometer lateral resolution. Moreover, simultaneous recording of the 2PEF signal enables in situ quantitative mapping of the molecular concentration and its correlation with the observed textures. We apply this technique to the characterization of biomimetic textures obtained in concentrated collagen liquid solutions. We successfully image biologically relevant organizations that are similar to the collagen organization found as a stabilized state in compact bones.
©2010 Optical Society of America
OCIS codes: (180.4315) Nonlinear microscopy; (160.3710) Liquid crystals; (170.6935) Tissue
characterization; (190.4180) Multiphoton processes; (190.4710) Optical nonlinearities in organic materials.
References and links
1. M. Schadt, “Liquid crystal materials and liquid crystal displays,” Annu. Rev. Mater. Sci. 27(1), 305–379 (1997). 2. K. Amundson, A. van Blaaderen, and P. Wiltzius, “Morphology and electro-optic properties of
polymer-dispersed liquid-crystal films,” Phys. Rev. E Stat. Phys. Plasmas Fluids Relat. Interdiscip. Topics 55(2), 1646– 1654 (1997).
3. G. A. Held, L. L. Kosbar, I. Dierking, A. C. Lowe, G. Grinstein, V. Lee, and R. D. Miller, “Confocal Microscopy Study of Texture Transitions in a Polymer Stabilized Cholesteric Liquid Crystal,” Phys. Rev. Lett.
79(18), 3443–3446 (1997).
4. M. Ofuji, Y. Takano, Y. Houkawa, Y. Takanishi, K. Ishikawa, H. Takezoe, T. Mori, M. Goh, S. Guo, and K. Akagi, “Microscopic orientational order of polymer chains in helical polyacetylene thin films studied by confocal laser raman microscopy,” Jpn. J. Appl. Phys. 45(No. 3A), 1710–1713 (2006).
5. I. C. Khoo, “Nonlinear optics of liquid crystalline materials,” Phys. Rep. 471(5-6), 221–267 (2009). 6. W. Denk, J. H. Strickler, and W. W. Webb, “Two-photon laser scanning fluorescence microscopy,” Science
248(4951), 73–76 (1990).
7. R. S. Pillai, M. Oh-E, H. Yokoyama, G. J. Brakenhoff, and M. Müller, “Imaging colloidal particle induced topological defects in a nematic liquid crystal using third harmonic generation microscopy,” Opt. Express
14(26), 12976–12983 (2006).
8. D. Yelin, Y. Silberberg, Y. Barad, and J. S. Patel, “Depth-resolved imaging of nematic liquid crystals by third-harmonic microscopy,” Appl. Phys. Lett. 74(21), 3107–3109 (1999).
9. D. Yelin, Y. Silberberg, Y. Barad, and J. S. Patel, “Phase-matched third-harmonic generation in a nematic liquid crystal cell,” Phys. Rev. Lett. 82(15), 3046–3049 (1999).
10. L. Moreaux, O. Sandre, and J. Mertz, “Membrane imaging by second-harmonic generation microscopy,” J. Opt. Soc. Am. B 17(10), 1685–1694 (2000).
11. P. Stoller, K. M. Reiser, P. M. Celliers, and A. M. Rubenchik, “Polarization-modulated second harmonic generation in collagen,” Biophys. J. 82(6), 3330–3342 (2002).
12. P. J. Campagnola, A. C. Millard, M. Terasaki, P. E. Hoppe, C. J. Malone, and W. A. Mohler, “Three-Dimensional High-Resolution Second-Harmonic Generation Imaging of Endogenous Structural Proteins in Biological Tissues,” Biophys. J. 82(1 Pt 1), 493–508 (2002).
13. R. M. Williams, W. R. Zipfel, and W. W. Webb, “Interpreting second-harmonic generation images of collagen fibrils,” Biophys. J. 88(2), 1377–1386 (2005).
14. M. Strupler, A.-M. Pena, M. Hernest, P.-L. Tharaux, J.-L. Martin, E. Beaurepaire, and M.-C. Schanne-Klein, “Second harmonic imaging and scoring of collagen in fibrotic tissues,” Opt. Express 15(7), 4054–4065 (2007).
15. O. G. Morales-Saavedra, M. Bulat, S. Rauch, and G. Heppke, “Domain structure studies in phases of bent-shaped molecules by spatially resolved second harmonic microscopy,” Mol. Cryst. Liq. Cryst. (Phila. Pa.) 413, 2743–2752 (2004).
16. H. Kim, T. K. Lim, S. T. Shin, C. K. Lee, F. Araoka, M. Ofuji, Y. Takanishi, and H. Takezoe, “Coexistence of polar and nonpolar domains and their photocontrol in the B-7 phase of a bent-core liquid crystal containing azo dyes,” Phys. Rev. E 69, - (2004).
17. A. Deniset-Besseau, J. Duboisset, E. Benichou, F. Hache, P.-F. Brevet, and M.-C. Schanne-Klein, “Measurement of the second-order hyperpolarizability of the collagen triple helix and determination of its physical origin,” J. Phys. Chem. B 113(40), 13437–13445 (2009).
18. F. Gobeaux, G. Mosser, A. Anglo, P. Panine, P. Davidson, M.-M. Giraud-Guille, and E. Belamie,
“Fibrillogenesis in dense collagen solutions: a physicochemical study,” J. Mol. Biol. 376(5), 1509–1522 (2008). 19. M.-M. Giraud-Guille, G. Mosser, and E. Belamie, “Liquid crystallinity in collagen systems in vitro and in vivo,”
Curr. Opin. Colloid In. 13(4), 303–313 (2008).
20. D. J. S. Hulmes, “Building Collagen Molecules, Fibrils, and Suprafibrillar Structures,” J. Struct. Biol. 137(1-2), 2–10 (2002).
21. F. Gobeaux, E. Belamie, G. Mosser, P. Davidson, P. Panine, and M.-M. Giraud-Guille, “Cooperative ordering of collagen triple helices in the dense state,” Langmuir 23(11), 6411–6417 (2007).
22. G. Mosser, A. Anglo, C. Helary, Y. Bouligand, and M.-M. Giraud-Guille, “Dense tissue-like collagen matrices formed in cell-free conditions,” Matrix Biol. 25(1), 3–13 (2006).
23. P. De Sa Peixoto, A. Deniset-Besseau, A. Anglo, C. Illoul, M.-C. Schanne-Klein, and G. Mosser, (in preparation).
24. I. Bergman and R. Loxley, “2 Improved and Simplified Methods for Spectrophotometric Determination of Hydroxyproline,” Anal. Chem. 35, 1961-& (1963).
25. F. Gobeaux, E. Belamie, G. Mosser, P. Davidson, and S. Asnacios, “Power law rheology and strain-induced yielding in acidic solutions of type I-collagen,” submitted.
26. S. Roth, and I. Freund, “Second harmonic generation in collagen,” J. Chem. Phys. 70(4), 1637–1643 (1979). 27. N. Olivier, and E. Beaurepaire, “Third-harmonic generation microscopy with focus-engineered beams: a
numerical study,” Opt. Express 16(19), 14703–14715 (2008).
28. M.-M. Giraud-Guille, “Twisted Plywood Architecture of Collagen Fibrils in Human Compact-Bone Osteons,” Calcif. Tissue Int. 42(3), 167–180 (1988).
1. Introduction
Liquid crystals are widely used in many applications and there is a need for in situ characterization of these materials at the micrometer scale [1]. Optical techniques are particularly relevant for that purpose [2–4] and may take advantage of the large optical nonlinearities that have been demonstrated in these materials [5]. A promising method is to use nonlinear optical microscopy [6] to obtain three-dimensional (3D) images of liquid crystals at the micrometer scale. Nonlinear optical microscopy indeed provides intrinsic 3D resolution due to the spatial confinement of the nonlinear processes at the focus of the laser excitation. Moreover, it can take advantage of the many nonlinear optical processes including two-photon exited fluorescence (2PEF), second harmonic generation (SHG) and third harmonic generation (THG). Third harmonic microscopy was recently demonstrated in unstained liquid crystals and provided in situ 3D images of liquid crystalline domains through complex phase-matching processes [7–9]. Second harmonic microscopy is an alternative nonlinear optical technique that has proven to be a valuable tool for probing the 3D organization of non centrosymmetrical molecular assemblies [10–14]. Although second harmonic images of nematic domains have been reported recently [15, 16], no characterization of liquid crystalline patterns at the submicrometer scale has been reported yet.
In this paper, we combine Second Harmonic Generation (SHG) microscopy and Two-Photon Excited Fluorescence (2PEF) microscopy to study unstained lyotropic liquid crystals. We characterize the 3D texture of cholesteric patterns with submicrometer lateral resolution, including measurements of the cholesteric pitch as a function of the molecular concentration. For these measurements, we use rat-tail type I collagen as a liquid crystalline material for the following reasons: (1) the collagen molecule has been shown to exhibit large second order hyperpolarizability due to the presence of numerous tightly aligned harmonophores whose nonlinear response, although quite weak, coherently sums up and amplifies along the triple helical structure [17], (2) acidic solutions of molecular collagen (pH=2.5, no fibrils) have been shown to form liquid crystals at high concentration [18, 19], (3) characterization of self organization of dense solutions of collagen is of strong interest for designing biomimetic
materials since collagen is found in many organs where it shows highly structured macromolecular organization specific to each tissue (skin, cornea, arteries, bones…) [20].
This paper is organized as follows. We first present the preparation of liquid crystalline collagen sample and the nonlinear imaging setup. Then, we show that SHG images of cholesteric collagen liquid crystals exhibit fringes with a cosines squared dependence, and that 2PEF images enables in situ measurements of collagen concentration. Combining both imaging modalities, we verify that SHG images exhibit a nonlinear dependence on the molecular concentration. We finally apply this highly contrasted imaging technique to the characterization of biomimetic collagen textures.
2. Materials and methods
2.1 Sample preparation
Type I collagen was extracted from rat-tail tendon and purified as previously described [18]. It was solubilised in acetic or chloride acid (pH=2.5 or pH=3.5) to impede the formation of cross-striated fibrils. The 0.2 mg/ml solution was then concentrated in a two-sided open glass microchamber made out of two coverslips and spacers (see Fig. 1). The microchamber thickness varied typically from 300 µm to about 10 µm over 5 mm long. Slow and continuous injection of the collagen solution near the centre of the microchamber aimed at countering solvent evaporation on both open sides, and increasing collagen concentration. This setup has been shown to induce the formation of liquid crystal phases near the air-liquid interface where the collagen concentration is the largest [21–23]. All experiments were performed at room temperature (21°) and the liquid crystalline patterns were only dependent on the collagen local concentration and other chemical parameters (acid strength and concentration, ionic force…) [21–23].
Alternatively, collagen liquid solutions of various concentrations in the 0.2 to 1000 mg/ml range were prepared by centrifugation [23]. The concentrations were determined accurately by hydroxyproline titration [24]. These solutions were then imaged between two coverslips in the same conditions as the liquid crystalline samples in order to enable quantitative comparison of the 2PEF signals. We verified that the collagen exhibited the same behavior whatever the solvent (acetic or chloride acid) and the pH (2.5 or 3.5).
2.2 Multiphoton microscopy
In previous studies, the liquid crystalline organization of collagen was controlled in situ by polarized light microscopy. However, this technique lacked 3D resolution and only permitted to reveal organized domains. To analyze the 3D structure of these domains, it was necessary (i) to stabilize the liquid phase by pH increase to induce the formation of fibrils and (ii) to fix, dehydrate, embed, section and stain the collagen gels for electronic microscopy [22]. In the present work, we characterize the liquid crystalline sample by mean of nonlinear optical microscopy as a non invasive 3D imaging technique.
For that purpose, we used a custom-built laser scanning microscope as previously described [14] (see Fig. 1). Excitation was provided by a femtosecond Titanium-Sapphire laser (Tsunami, Spectra-Physics) set at 860 nm. We used circular polarization in order to image all structures independently of their orientation in the focal plane. We detected
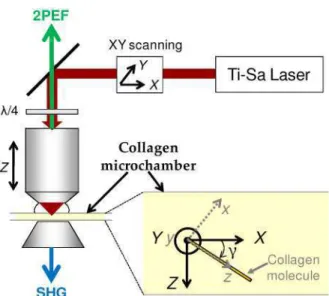
Fig. 1. Schematic of the experimental setup and collagen microchamber. (X, Y, Z) is the laboratory frame, with (X, Y) the image plane. (x, y, z) is the molecular frame. γ is the angle of the collagen molecules to the focal plane.
simultaneously SHG and 2PEF signals in 2 detection channels equipped with photon-counting photomultiplier tubes (Electron tubes) and suitable spectral filters. SHG signals were detected in the trans-direction through a condenser (effective NA≈1) since SHG is mainly forward-directed, using two 680SP rejection filters (Semrock) and a HQ430/20 interferential filter (Chroma). 2PEF signals were epidetected using a 680SP rejection filter (Semrock) and a GG455 interferential filter (Schott).
Liquid crystalline samples were imaged in situ using a 60× , 1.2-NA objective lens with coverslip correction (UplanSApo, Olympus), resulting in typically 0.3 m (lateral) × 0.9 m (axial) resolution. Imaging was performed within 30 minutes after stopping the injection or alternatively with continuous injection in order to prevent sample dehydration. Power at the sample was 20 to 40 mW with 10 µs/pixel acquisition time. No perturbation of the sample’s textures was observed in these imaging conditions under continuous excitation, as expected from the highly viscous character of the concentrated collagen solutions [19, 21, 25].
3. Results and discussion
3.1 SHG imaging of collagen cholesteric liquid crystals
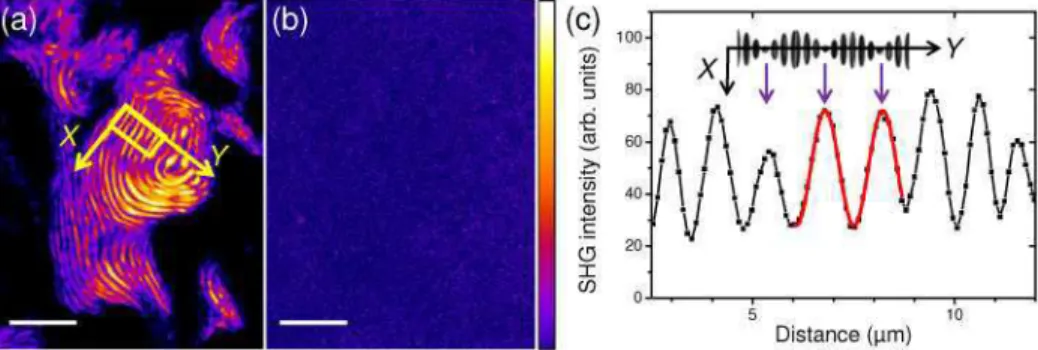
Figure 2 displays typical SHG and 2PEF images obtained in a collagen microchamber. The SHG image reveals the texture of the liquid crystal: the fringes are characteristic of a cholesteric arrangement as verified by polarized light microscopy and electronic microscopy [23]. The signal maxima correspond to molecules aligned within the focal plane whereas the minima correspond to molecules aligned along the axial direction in the microscope. Indeed, it has been experimentally shown that the collagen nonlinear response is satisfactorily described using a C∞v symmetry and assuming Kleinmann symmetry [11, 17, 26]. Within
these approximations, the only nonvanishing second order hyperpolarizability components are: βzzz and βzxx = βzyy = βxxz = βyyz = βxzx = βyzy where z is the axis of the collagen triple helix
(see Fig. 1). As a result, the fundamental electric field can interact with molecules aligned in the focal plane to generate harmonic electric field with a transverse polarization compared to the microscope axial direction, resulting in a detectable SHG signal in the forward-direction. In contrast, molecules oriented perpendicularly to the focal plane generate axially polarized harmonic electric field that is not efficiently detected. Note that isotropic phases are also present in the microchamber as revealed by regions with vanishing SHG.
Fig. 2. Multiphoton Imaging of a liquid crystalline collagen solution in acetic acid (500mM, pH=2.5). (a) SHG signal and (b) enhanced 2PEF signal using the displayed Look-Up Table. Scale bar: 10 µm. (c) SHG profile of the region of interest indicated in (a) with a yellow box. The red dotted line corresponds to fitting with a cosines squared (see Fig. 3). Inset: scheme of cholesteric organization along the Y axis depicted in Fig. 1 and Fig. 2(a). The purple arrows indicate the SHG maxima that correspond to collagen molecules aligned within the focal plane.
Using this tensorial approach, we derived the SHG intensity as a function of the angle γ of the collagen molecules to the focal plane (see Fig. 1). For that purpose, we considered the laboratory frame (X, Y, Z) with X, Y in the focal plane and Z along the propagation direction (see Fig. 1) and we choose Y along the cholesteric pattern as displayed in Fig. 2(a), so that γ is the angle of the laboratory X direction to the molecular axis z. We did not take into account any molecular angular dispersion within the liquid crystal pattern. We considered a circularly polarized excitation electric field and neglected any polarization change due to strong focusing or birefringence of the medium:
(
ˆ ˆ)
( ) .
E ω =Eω X+i Y (1) Using the second order hyperpolarizability tensor displayed above, we obtained:
3 2 3 2
(2 ) cos (2 cos sin cos ) ,
X xx E ω ∝N γ βzzz+ γ γ− γ βz Eω (2a) 2 (2 ) 2 cos , Y xx E ω ∝N i γ βz Eω (2b) where N is the number of collagen molecules aligned within the cholesteric pattern. Setting
/
xx
ρ β= z βzzz the ratio of the 2 independent tensorial components of the collagen hyperpolarizability, we obtained:
(
)
(
)
22
2 2 2 3 2 2
(2 ) 4 cos cos cos 3sin 1 ( ). I ω ∝N β ρ γ+ γ ρ+ γ γ− I ω
zzz (3)
Figure 3 displays Eq. (3) as a function of ρ and γ. The γ angle is then related to the distance Y along the cholesteric pattern and to the cholesteric pitch P: γ = 2π Y /P. Fig. 3 shows that Eq. (3) simplifies to a cos6γ dependence for ρ=0 and is very close to a cos2γ for 0.5 ≤ ρ ≤ 1. Considering ρ=0.5 as previously reported [17], we fitted the SHG profile displayed in Fig. 2(c) using a cos2γ function. We obtained a good agreement when considering a few fringes with about the same intensity maxima. It showed that our tensorial approach, although neglecting propagation effects, is an effective approach to describe the SHG profile along the cholesteric pattern.
Fig. 3. Model calculation of the SHG intensity profile along a cholesteric pattern. (a) SHG intensity as a function of ρ=βzxx/ βzzz and γ, the angle of the collagen molecule to the focal plane. (b-d) SHG intensity profiles for (b) ρ=0, (c) ρ=0.5 and (d) ρ=1 (black lines) compared to a cosines squared profile (red lines) that is used to fit the experimental data (see Fig. 2(c)).
3.2 In situ measurement of molecular density using 2PEF signals
In contrast to the SHG image, the 2PEF image in Fig. 2(b) displays no striking sensitivity to the molecular organization: we observe a homogeneous weak signal. Fluorescence is indeed an incoherent process that scales linearly with the molecular density in the microchamber. Note that fluorescence usually varies with the chromophore orientation relative to the incident electric field. The absence of sensitivity of the 2PEF image to the cholesteric organization indicates that the collagen molecule cannot be simply modeled as a nonlinear chromophore aligned along the main molecular axis and that a complex tensorial response is observed upon 860 nm excitation.
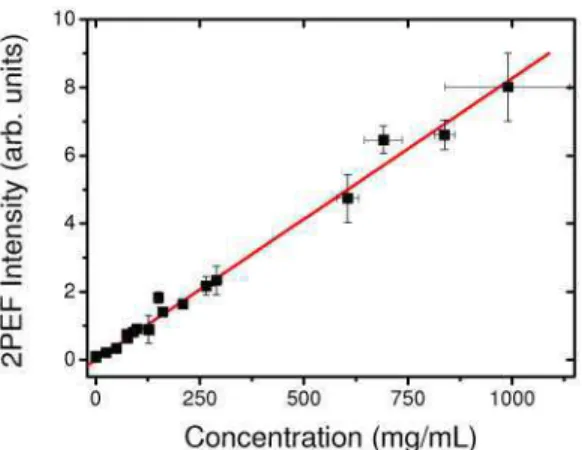
To enable absolute measurements of the collagen concentration by use of the 2PEF images, we calibrated the 2PEF signal using homogenous collagen solutions whose concentrations were accurately determined by hydroxyproline titration [24]. These collagen solutions were prepared by centrifugation and imaged between two coverslips in the same conditions as the liquid crystalline samples. The calibration curve is depicted in Fig. 4. As expected, the 2PEF intensity scales linearly with the concentration, so that linear fitting provides a direct relationship between fluorescence intensity and molecular concentration. This calibration enabled the optical determination of the concentration in the microchambers with micrometer spatial resolution, and its correlation to the liquid crystalline textures observed by SHG microscopy.
Fig. 4. Calibration of 2PEF intensity as a function of collagen concentration. Black squares are experimental data, red line is linear fitting.
3.3 Contrast of the SHG images as a function of the molecular density
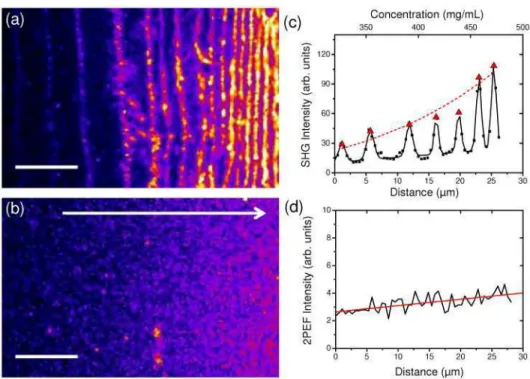
Figure 5 displays another example of collagen liquid crystalline organization in a region of the microchamber with a strong concentration gradient, near the air-liquid interface. The SHG image reveals a non typical cholesteric organization: the SHG profile shows irregular fringes whose maxima were determined using multiple Gaussian fitting (see Fig. 5(a) and (c)). The 2PEF image in Fig. 5(c) and the 2PEF profile in Fig. 5(d) show that the concentration gradient is linear. We then used the calibration curve in Fig. 4 to plot the SHG profile as a function of the collagen concentration (see Fig. 5(c)). It enabled the correlation of the cholesteric pitch with the collagen concentration. The cholesteric pitch being obtained as twice the interfringe distance, we measured for instance a pitch of ≈ 5 µm at a concentration of 460 mg/mL in this microchamber.
This accurate characterization of the liquid crystalline phase took advantage of the high contrast of the SHG image. We observed that the maxima of the SHG peaks exhibited a nonlinear behavior as a function of the molecular concentration (see dotted line in Fig. 5(c)). Because of their coherent character, SHG signals are indeed expected to scale quadratically as a function of the density of aligned molecules, as shown in Eq. (3). In comparison, conventional technique such as polarized light microscopy provides only a linear contrast as a function of the molecular density. However, the coherent character of SHG process also induces a high sensitivity to the experimental conditions: coherent microscopy has been shown to exhibit complex radiation pattern depending on the 3D organization of the molecules in the focal volume, on the numerical aperture and the optical wavelength and on the wavefront of the excitation electric field [10, 27]. The sensitivity of SHG radiation to the molecular organization presumably explains why the SHG experimental data do not perfectly fit to a quadratic behavior in Fig. 5(c). Calibration of the molecular density with an incoherent nonlinear optical process such as 2PEF is therefore crucial.
Fig. 5. Multiphoton Imaging of a liquid crystalline collagen solution in acetic acid (5mM pH=3.5). (a) SHG signal and (b) enhanced 2PEF signal (same Look-Up Table as in Fig. 2). The white arrow indicates the direction of the collagen concentration gradient. Scale bar: 20 µm. (c) SHG and (d) 2PEF profiles along the concentration gradient in (a) and (b). The concentration scale in (c) is determined using the calibration curve in Fig. 4 and the 2PEF profile in (d). The red triangles in (c) correspond to maxima of the fringes determined by multiple Gaussian fitting. The dotted line in (c) corresponds to fitting with a quadratic dependence. The red line in (d) corresponds to linear fitting.
3.4 Application to the characterization of biologically relevant collagen textures
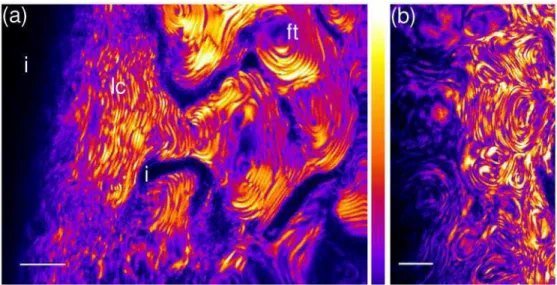
These results shows that the dramatically different character of SHG and 2PEF microscopies provide valuable complementary information to study the formation of liquid crystalline phases as a function of various experimental conditions. We have exploited this unique capability to investigate the variability in the collagen textures by changing the collagen concentration and various chemical parameters (strength of the acidic solvent, pH of the solution…). A particularly striking example is given in Fig. 6 where we observe biologically relevant organizations such as fingerprint textures, in agreement with our previous work using polarized microscopy [22]. These structures are similar to the collagen organization found as a stabilized state in compact bones in living tissue: osteones indeed show cholesteric arrangement of collagen fibrils in tubular structures [28]. The supplemental movie in Fig. 6(b) illustrates the unique capability of SHG microscopy for 3D imaging of these textures. Most importantly, we took advantage of the 2PEF image to correlate the collagen concentration to the observed textures. For instance, the annotated fingerprint texture in Fig. 6(a) corresponds to a collagen concentration of about 80 mg/mL in chloride acid at pH=3.5. Full characterization of the observed isotropic/cholesteric and isotropic/nematic phase transitions will be reported in [23].
Fig. 6. SHG Images of a liquid crystalline collagen solution in chloride acid: (a) pH=3.5, (b) pH=2.5 (Media 1) showing loose cholesteric pattern with few defects (lc), fingerprint texture (ft) and isotropic areas (i). Scale bar: 10 µm.
4. Conclusion
To conclude, nonlinear optical microscopy combining SHG and 2PEF signals presents major advantages to characterize liquid crystalline phases at the micrometer scale. First, SHG signals provide highly contrasted images of the molecular organization due to their coherent nonlinear optical character. Second, SHG images benefit from the intrinsic micrometric 3D resolution of nonlinear optical microscopy. Third, simultaneous recording of the 2PEF signal enables in situ quantitative mapping of the molecular concentration and its correlation with the observed textures. Besides these unique features, we point out that SHG / 2PEF optical imaging of liquid crystals exhibits low invasivity like other optical techniques, which makes possible in situ monitoring of the formation of the liquid crystalline phases. It may also be combined with polarization-resolved techniques in order to map the molecular orientation with improved accuracy. Application of this technique to collagen proved relevant to study the formation of biomimetic structures. More generally, SHG imaging of liquid crystals can be applied to any chemical exhibiting a non vanishing second order nonlinear optical response and should prove suitable for in situ quantitative characterization of liquid crystalline phases with 3D micrometer resolution.
Acknowledgments
The authors gratefully acknowledge François Hache, Emmanuel Beaurepaire and Nicolas Olivier for stimulating discussions. ADB acknowledges the Fondation de la Recherche Médicale and the Fondation IXcore for financial support.