321
Spatiotemporal variation of the soil potential sensitivity to water
erosion. Case of the Tifiles micro basin of the North West
Algerian.
A. Kessaissia
1, M. Mazour
2, M. M’hamedi Bouzina
3, A. Nabed
3 Laboratory of conservatory water and soil management and sustainable development of mountain areas,Institute of agricultural sciences, University of Hassiba Ben Bouali , chlef ,Algeria
*Corresponding author: E-mail: kabderrahman2014gmail.com
Received 31 Aug 2017, Revised 7 Nov 2017, Accepted 25 Dec 2017
Abstract
This study is conducted in the micro basin of the wadi Tifiles, located to the North West of the Algeria. The region is characterized by repetition of the forest fires that have caused a reduction of forest cover which has exposed soils at the upstream watersheds to erosion and the downstream areas to flooding. to follow the spatiotemporal variation of the potential sensitivity of the soils to erosion by water, we adopted an approach based on the geographical information systems (GIS). The results show that the surface of the potential sensitivity to erosion has increased in time and in space. The surface of the very potentially sensitive class is estimated from the 71 percent in 1987 and 2001 and 70% in 2011.
Keys words: erosion, soil, fragility, sensibility, watershed I. Introduction
The land degradation caused by water erosion is a major risk for the Mediterranean region. In Algeria, more than 50 million hectares of land are affected by this phenomenon, or more than 20% of the total area of the country that is more than the 238 million hectares, as a result, 14 million hectares of mountain areas of the North are affected by water erosion. This degradation is accentuated particularly with the reduction of forest cover where 4.1 million hectares of forests under threat from the effects of climate change, fires and clearing [1]. The consequences of the soil degradation become more important with the presence of conditions such as the presence of the accident reliefs, fragile soils and a very aggressive climate characterized by torrential rainfall in the autumn with intensities often exceeding 45 mm h1 [2]. In addition, the different human activities such as overgrazing, fire, the clearing of forests and the land use without soil conservation system contributed to increase the problem in a remarkable way that the soil, become very vulnerable areas to erosion and runoff. The damage is so important; 6 million hectares are exposed to active erosion ranging between
322
2000 t km2 and the specific degradation is equal to 4000 t km1 year1, or 120 million tons of sediment is carried annually by the runoff [3].
So, the land degradation assessment is an important step to identify the sensitivity of the areas to erosion which could help in the water management and soil conservation. Among the different approaches and methods used in the evaluation of the soil degradation: the overall assessment of the effect of man on the land degradation GLASOD [4], the assessment of the status of anthropogenic degradation of soil ASS0D) [5] and [6], the RALA approach [7] and the study of Ceres for Asia and North Africa [8] and [9], the USLÉ and RUSLE models [10] and the PPS [11]. This study show an example of evaluation of the soil degradation on the scale of a micro basin through the use of geographic information systems (GIS) to follow the variation in space and in time of the soil potential sensitivity to water erosion.
II. Study environment 2.1) Location
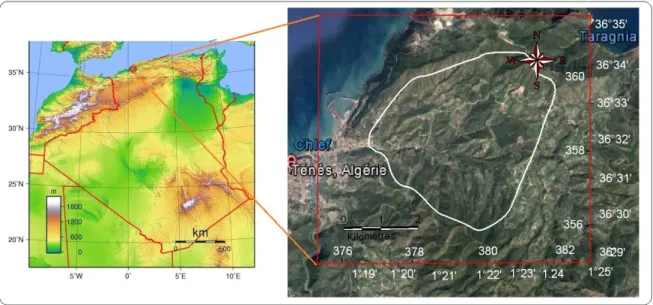
The study area is located in the sub watershed of Tifiles located at 50 Km north of Chlef , at 200 km to the West of Algiers and of geographical X and Y coordinates equal
respectively to (1 ° 19' 36 ° 29') and (1 ° 25' 36 ° 35') (fig. 1).
Figure 1: Geographic situation. 2.2) Study area characteristic
The basin is coastal part of the mountain of Dahra, its surface area is equal to 16 km² and it is characterized by a Mediterranean climate, an annual average amount rain fall and temperature equal respectively to 448 mm and 19°C. The relief is characterized by strong slopes that 44% of the surface ranging from 15 to 30%, the average altitude is equal to 251 m, the maximum altitude equal to 580 m and 23.44% of the surface is occupied by the class of 170-230 m altitude.
323
The geological substratum is characterized by limestone, lignite clay, and it is usually characterized by sedimentary rocks. The soil occupation is dominated by conifers forest including Aleppo Pine and cedar that occupy the largest surface. However, the rest of the area consists of brushwood, xerophilic herbaceous vegetation and bare land.
III. Material and methods
The methodological approach is inspired from the work of [13] and [14]. It is based on the use of geographic information systems (GIS) and remote sensing to determine the potential sensitivity to water erosion for three dates (1987, 2001 and 2011). The area is characterized by the recurrence of forest fires that has lead to the degradation of the upstream soil area and the apparition of the flood in downstream area of the Sub catchment of Wadi Tifiles. The method is based on the weighting of the factors of erosion then and the superposition of thematic maps. Thus, the soil fragility is obtained by the superposition of the sandstone maps with the map of land cover and the soil sensitivity to erosion is obtained by the superposition of fragile maps with map of slope land.
It was noted that sandstone map is determined from the geological map of the region. However, the map of the slope was obtained by the digitalization of topographic map type 1922 and the maps of the soil occupation for the years 1987, 2001 and 2011 are obtained from satellite images.
IV. Results a)Sandstone maps
The sandstone map is shown figure 2.
324
The figure and diagram show that the study site is dominated by the marl followed by the sandstone. This characteristic can indicate that the soil is sensible to erosion.
a- Slope map
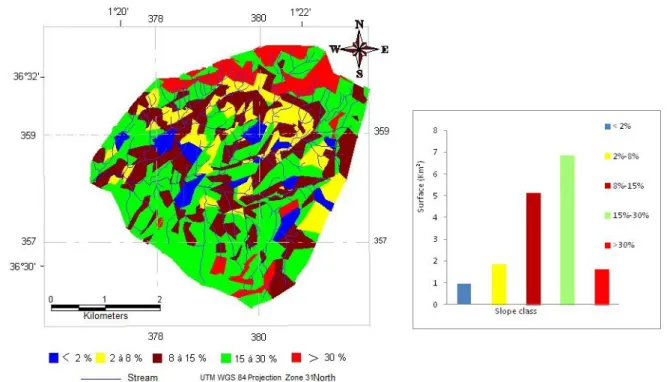
The slopes map is shown in figure.
Figure 3: slope map
The slope map indicates that the area is dominated by the slope class from 15% to 30%. This can indicate that the area represent an important slope that can increase the runoff and lead to the concentration runoff and increase erosion and soil degradation.
b) Land use maps.
325
Figure 4: soil occupation corresponding to the date of 1987.
326
Figure 6: soil occupation map corresponding to the date of 2011
Figure 7: Diagram of the soil occupation
The different map of the land use show that the occupation of the soil varies in the space and the time.
Su rf ace clas s (K m ²) Forest Scrubland Cultivatedland Bareland
327 Fragility maps to water erosion.
The fragility map is indicated in the following map.
Figure 8: fragility map corresponding to the date of 1987.
Figure 9: fragility map corresponding to the date of 2001.
328
Figure 10: Fragility map corresponding to 2011. Soil sensitivity maps to erosion maps
The different classes of potential sensitivity (figure 10, 11 and 12) obtained by crossing and overlapping between fragility and the map of the slope maps.
329
Figure 12: Potential sensitivity map corresponding to 2001.
Figure 13: potential sensitivity map corresponding to 2011.
Discussion
The different thematic maps have allowed to characterize the erosion based on sandstone, the occupation of the soil and slope and their influence on the variation of the potential sensitivity of the soils to erosion. These maps show that the study area has the
330
favorable conditions to erosion. Indeed, the map of sandstone (fig.2) and table 1 show that the southern part of the basin is characterized by the marls that are very sensitive to erosion and occupy the largest area of the micro watershed equal to 9.12Km² (57%) followed by the class sandstone with an area equal to 4.48 Km² (28%). These numbers tell us that the study area is characterized by the dominance of a less resistant to erosion. Similarly, the map of slope and diagram 4 (fig. 3) shows that the area represent a large surface about slope from 15% and upper. In addition, the soil occupations of the different dates show different classes changes in time and space due to the human activities including fire. The surface of the forests is decreased between 1987 and 2011 from 3.68 Km² (23%) to 1.76 Km² (11%). In contrast, the surface of shrub and forest after fires has increased from 4.32 km2 (27%) recorded in 1987 to 6.08 Km² (38%) recorded in 2011.
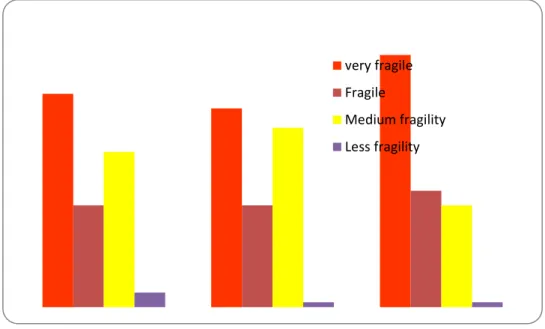
The different class of fragility show that the surface has been exposed has a significant
change in time and in space. Indeed, the surfaces of the very fragile class and fragile class have increased between 1987 and 2011 figure 14. The first has increased from 44% to 52% and the second has increased from 21% to 24%. However, the class of moderately fragile surface recorded an increase of 5% between 1987 and 2001 from 32% to 37% and a reduction of 16% from 37% to 21% between 2001 and 2011. On the other hand, the surface of the less fragile class shows a reduction from 3% to 1% between the periods of between 1987-2011.
Figure 14: Diagram of the different classes of the fragility
The maps of the soil fragility show the variation of the fragility in space and in time. In fact , in 1987 the very fragile class occupied the southern part of the basin until the medium part, the fragile class is distributed in a small area and the moderately fragile class is located in the north of the basin near Ach Zarfat mount until the Tizi mount and the less fragile class is located near Befessoussa Wadi and Tifilis Wadi. In 2001, the very fragile class occupied some area of the fragile class and focused especially at the upstream part of brahim Wadi and Tifiles Wadi . During this period, there is the transformation of some place from very fragile class to
very fragile Fragile
Medium fragility Less fragility
331
the moderately fragile class especially on the side of Ach Zafat mount and Tizi mount (northern part of the basin). In 2011, this could be due to the disappearance of certain place of the moderately fragile class.
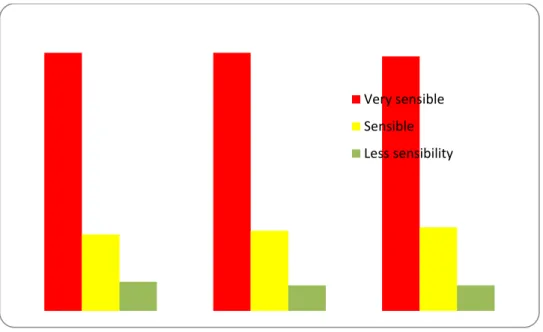
Similarly, the potential sensitivity maps indicated in figure 9 shows that the surface of the very sensitive class is dominate the most grade part of the micro basin, it is estimated to71% in 1987 and 2001 and 70% in 2011 figure 15. However the surface of sensitive class and less sensitive class recorded surfaces widely lower than the surface of the very sensitive class during the same periods. The surface of the sensitive class varies between 22% and 23% however the surface of the less sensitive class varies between 8% and 7%.
Figure 15: Diagram of the different classes of the soil potential sensitivity.
These results show that the study area becomes more and more very potentially sensitive to erosion. This could be explained by the meeting of some conditions such as the sandstone characteristic dominated by the marls and the presence of soils on the largest part , the slopes greater than 15%. Adding to these two factors, degradation of vegetation ( fire and grazing that lead the environment to be more in more potentially susceptible to water erosion.
VI. Conclusion
This study show that the potential sensitivity to erosion in the studied environment becomes more sensitive to erosion with the reduction of vegetation cover, and in the presence of a less resistant soil including clays which have more than 57% of the total surface and an accident relief with more than 53% of the surface of slope classes above 15%. Indeed, the results show that the area in the years 1987, 2001 and 2011pesente 70% to 71% of surface by the very sensitive class. It also shows that some areas are transformed from less sensitivity to the high sensitivity. This study could be an important step in the proposal of soil conservation
Very sensible Sensible Less sensibility
332
measures and water management and that could be used for the determination of areas sensitive to erosion at the level of the little surfaces to a large surface.
References
1. T. MOSTEPHAOUI, S. MERDAS, B. SAKAA, M. HANAFI, M. BENAZZOUZ, Journal Algérien des
Régions Arides N° Spécial CRSTRA (2013) 131 -147
2. B. TOUABIA, S. DAUTREBANDE, D. GOMER, A. AIDAOUI, Journal des Sciences Hydrologiques,
(1999)973 – 986
3. D. DEMMAK Contribution a` l’étude de l’érosion et des transports solides en Algérie
septentrionale. Thèse de docteur-ingénieur, université Pierre et Marie Curie, Paris (1982).
4. L. OLDEMAN, R.HAKKELING W,SOMBROEK, World map on the status of human induced soil
degradation, with explanatory note (second revised edition). ISRIC Wageningen, UNEP, Nairobi. (1991).
5. G.VAN LYNDEN, L. OLDEMAN Assessment of the Status of Human-induced soil degradation in South and South East Asia. International Soil Reference and Information Centre, Wageningen, (1997) 35.
6. O. ARNALDS, Types and Assessment of Land Degradation, Land Restoration Program (LRT), May 2008.
7. N. KHARIN, R. TATEISHI, P. GUNIN, H. AL-BILBISI, Degradation of the dry lands of Northern Africa. Center for environmental remote sensing (CEReS), Chiba University, Japan (2004)81. 8. M. GRIMM, R. JONES, L. MONTANARELLA, Soil erosion risk in Europe. European Soil Bureau
Institute for Environment and Sustainability JRC Ispra (2000) 26- 31
9. EUSOILS (2008). Soil erosion: PESERA and Soil erosion in Alps. EUSOILS, accessed in September 03, 2008.
10. D. FLANAGAN, J. GILLEY, T. FRANTI. Water erosion prediction project (WEPP): development
history, model capabilities, and future enhancements. ASABE ISSN 0001-2351 Vol. 50(5)
(2007)1603-1612
11. G. ELLIOT 2004. WEPP internet interfaces for forest erosion prediction, paper No 02021 of the journal water resources association.
12. Y. LE BISSONNAIS N. DUBREUIL, J. DAROUSSIN, M. GORCE Modélisation et cartographie de l’aléa d’érosion des sols à l’échelle régionale. Exemple du département de l’Aisne Étude et Gestion des Sols, 11(3)(2004) 307 -321
13. T. BOUCHETTATA et A BOUCHETTATA, Proposition d’aménagement du sous bassin versant de l’oued Fergoug (Algérie) fragilité par des épisodes de sècheresse et soumis à l’érosion hydrique.
Revue sècheresse, 17 (03) (2006) 415- 424