Virtual Trials of the NICE-SUGAR Protocol: The Impact on
Performance of Protocol and Protocol Compliance
Vincent Uyttendaele*, Jennifer L. Dickson*, Geoffrey Shaw**, Thomas Desaive***, J. Geoffrey Chase*
* Department of Mechanical Engineering, University of Canterbury, Christchurch, New Zealand ** GIGA Science Group, University of Liège, Liège, Belgium
*** Department of Intensive Care, Christchurch Hospital, New Zealand
Abstract: Hypoglycaemia, hyperglycaemia and blood glucose (BG) variability are associated with worsened outcomes in critical care. However, NICE-SUGAR trial showed no clinical benefit from intensive insulin therapy. This study compares the table-based NICE-SUGAR and model-based STAR protocols to assess their relative capability to achieve safe, effective control for all patients. Validated virtual patients (n=443) were used to simulate glycaemic outcomes of the NICE-SUGAR and STAR protocols. Key outcomes evaluate tightness and safety of control for all patients: %BG in 80–144 mg/dL range (PTR); Per-Patient Mean BG (PPM_BG); and Incidence of Hypoglycaemia (BG<40 mg/dL). These metrics determine performance overall, for each patient, and safety. Results are assessed for NICE-SUGAR measuring per-protocol (~24/day) and at reported average rate (~3-hourly; ~8/day). STAR measures 1-3-hourly, averaging 12/day.
Per-protocol, STAR provided tight control, with higher PTR (90.7% vs. 78.3%) and tighter median [IQR] PPM_BG (112[106-119] vs. 117[106–137] mg/dL), and greater safety from hypoglycaemia (5 (1%) vs. 10 patients (2.5%)) compared to NICE-SUGAR simulations as per protocol. The 5-95th percentile range PPM_BG for NICE-SUGAR (97–185 mg/dL) showed ~5% of NICE-SUGAR patients had mean BG above 180mg/dL matching clinically reported performance. STAR’s 5th-90th PPM_BG percentile range was (97– 146 mg/dL). Measuring as recorded clinically, NICE-SUGAR had PTR of 77%, PPM_BG of 122 [110-140] mg/dL and 24(6%) of patients experienced hypoglycaemia. These results match clinically reported values well (mean BG 115 vs. 118 mg/dL clinically vs. simulation, clinically 7% of patients had a hypoglycaemic event).
Glycaemic control protocols need to be both safe and effective for all patients before potential clinical benefits can be assessed. NICE-SUGAR clinical results do not match results expected from their protocol, and show reduced safety and performance in comparison to STAR.
Keywords: Glucose, Hyperglycaemia, Glycaemic Control, Insulin sensitivity
1. INTRODUCTION
Hypoglycaemia, hyperglycaemia, and blood glucose (BG) variability are associated with higher mortality and worsened outcomes in critical care units (ICU), including severe infection, sepsis and septic shock, myocardial infarction, and multiple organ failure (McCowen et al., 2001, Capes et al., 2000, Krinsley, 2003, Krinsley, 2009, Bagshaw et al., 2009, Van den Berghe et al., 2006a). Early studies showed benefits from intensive insulin therapy in the ICU (Van den Berghe et al., 2001, Van den Berghe et al., 2003, Krinsley, 2004, Chase et al., 2008b), with improved outcomes (Chase et al., 2010a, Van den Berghe et al., 2003), reduced mortality, and reduction of patient length of stay and nurse workload (Krinsley, 2005,
Van den Berghe et al., 2006b). However, more recent trials have failed to reproduce these results, and have shown higher risks of hypoglycaemia (Griesdale et al., 2009, Wiener et al., 2008, Preiser et al., 2009, Finfer et al., 2009).
NICE-SUGAR is the largest multicentre and multinational randomised clinical trial to date, assessing intensive versus conventional glycaemic control in critically ill patients. This study showed no clinical benefit from intensive insulin therapy, with higher risks of hypoglycaemia and increased mortality in this group (Finfer et al., 2009, Finfer et al., 2012). As a result, there is much debate surrounding the benefits of insulin therapy, and its application in ICU (Marik, 2016, Preiser and Straaten, 2016).
One explanation for these conflicting results is the role of increased hypoglycaemia and BG variability in confounding results (Bagshaw et al., 2009, Egi et al., 2010, Penning et al., 2014, Krinsley and Preiser, 2015). In order to adequately test the improved outcome hypothesis, insulin therapy must be carried out in a safe and effective manner, and be consistently achieved for all or nearly all patients (Chase et al., 2010a). In addition, glycaemic control protocols must effectively manage metabolic variability, which drives glycaemic outcome (Chase et al., 2011). Thus, fixed table-based or ad hoc protocols, often used in hospital ICUs, lack patient specificity and rely on clinical judgement, often failing to account for such variability.
STAR (Stochastic TARgeted) is a clinically validated model-based glycaemic control framework (Evans et al., 2012, Fisk et al., 2012, Stewart et al., 2016). It uses model-based insulin sensitivity to characterise and forward predict changes in metabolic state. Insulin and nutrition treatments are selected such that forward predictions of likely BG outcomes are within the target range, and the treatment does not exceed a 5% likelihood of BG ≤ 4.0 mmol/L. STAR as shown promising results in the adult ICU, and is in current use in ICUs in the Christchurch, New Zealand, and Gyula, Hungary.
This paper compares the paper-based NICE-SUGAR protocol and the model-based STAR framework to assess their relative capability to achieve safe, effective control for all patients using a clinically validated virtual patient and virtual trials simulation system (Chase et al., 2010b). In doing so, it also evaluates how NICE-SUGAR performed clinically compared to a perfectly compliant virtual trial and its impact on performance and safety.
2. METHODS 2.1 Virtual Patients
This analysis uses 443 virtual patients (Chase et al., 2010b) generated from a cohort using the SPRINT (Specialised Relative Insulin Nutrition Table) glycaemic protocol in Christchurch Hospital ICU, New Zealand, between 2005 and 2007. In these 443 patients, gaps were removed and only patients that had an initial BG > 7 mmol/L (125 mg/dL) were included (Stewart et al., 2016).
2.2 NICE-SUGAR and STAR protocols
The NICE-SUGAR study was a randomised control trial with two arms: intensive insulin therapy and conventional control. The paper-based protocol for both groups is available online (Australia and New Zealand Intensive Care Society Clinical Trials Group et al., 2008) and are simulated here using clinically validated virtual trials (Chase et al., 2010b). This approach allows a large number of patients to be tested under multiple protocols for direct comparison.
The NICE-SUGAR intensive insulin therapy protocol (NS-IIT) targeted a glycaemic range of 4.5-6.0 mmol/l (81-108
mg/dL), where the conventional control was < 10.0 mmol/L (< 180mg/dL). For both aims, insulin was delivered as a continuous intravenous infusion of insulin alongside glucose boluses, and the nutritional management was carried out at the discretion of the treating clinicians (Finfer et al., 2009). Further explanation of this risk-based approach protocol can be found in (Finfer et al., 2009). NS-IIT was implemented directly from the reported protocol, and nutrition increased in simulation daily to reflect reported non-protein calorie achievements (Finfer et al., 2009). As nutrition type/composition was never reported, and ICU nutrition types can vary in their glucose composition, it was assumed that enteral nutrition was low carb (~40% of non-protein calories were CHO, similar to Glucerna 1.0TM), and that parenteral nutrition had 70% of non-protein calories attributable to CHO. Simulating with a low-carb enteral nutrition is conservative, and reflects a best case outcome for the NICE-SUGAR protocol, as increased dextrose intake tends to make glycaemic control more difficult and magnifies patient variability. STAR differs from NICE-SUGAR as it is a computerised model-based glycaemic control protocol, and uses a stochastic model to assess likely future change of patient-specific time-varying insulin sensitivity (SI) (Evans et al., 2012, Lin et al., 2008, Fisk et al., 2012). Current SI is determined from the clinically validated ICING physiological model (Lin et al., 2011), using integral-based fitting methods (Hann et al., 2005). A stochastic model was built based on population data, allowing forecasting of future changes in SI, and thus BG for a given insulin/nutrition combinations, and thus corresponding BG outcomes. STAR selects an optimal insulin and nutrition dose to best overlap predicted BG outcomes with the BG target range (4.4-8.0 mmol/L or 80-144 mg/dL), maximizing both safety and performance. Hypoglycaemic risk is directly managed, with the predicted likelihood of BG < 4.4 mmol/L (< 80 mg/dL) limited to a maximum value of 5%, by directly placing the BG outcome for the 95th percentile future SI value on 4.4 mmol/L.
Insulin is administered as boluses and enteral nutrition is modulated between 30-100% goal feed (Fisk et al., 2012), although actual delivery averaged ~90% of goal feed of ~2000kcal/day for the average individual (Stewart et al., 2016).
2.3 Analyses of performance and safety
Simulated glycaemic control outcomes for STAR and NS-IIT are compared. Performance is assessed by the percentage time of hourly resampled BG measurements in 4.4-8.0 mmol/L (80-144mg/dL) band, and per-patient mean BG, similar to the reporting in the NICE-SUGAR study (Finfer et al., 2009). Safety is evaluated as the number of severe hypoglycaemic events, defined as BG level < 2.2 mmol/L (40mg/dL) and the overall %BG < 4.0 mmol/L (< 72 mg/dL), where the first safety outcome was also reported in the NICE-SUGAR study. While the original NICE-SUGAR papers (Finfer et al., 2009,
Finfer et al., 2012) report very little BG stats and glycaemic control outcomes, overall mean BG and per-patient mean BG is reported for each arm, and compared here to simulation results.
Simulation results compare per-protocol NICE-SUGAR outcomes, where the protocol is followed perfectly, with STAR outcomes using 1-3 hourly interventions averaging ~12 measurements per day. Notably, per protocol, the intensive arm of NICE-SUGAR demands at least 24 measurements per day, which is well above what was reported (Finfer et al., 2012). Hence, it is clear that there was clinical non-compliance to the protocol as presented. As a result, a further analysis was run with the same NICE-SUGAR protocol but averaging measurements every 3 hours once in band (4.5-10 mmol/L), as an approximation of a safe approach to simulating the reduction in measurements seen between clinical data and protocol specified measurement rates for the intensive arm. A modified NICE-SUGAR (NS-3H) protocol to match average reported clinical measurements (~9.4 measures/day) (Finfer et al., 2012) is thus simulated. NS-3H uses 3 hourly measurements if the measured BG is within the band, but is maintained to 1 hour if an important decrease (≥ 1.9 mmol/L or ≥ 3.9 mmol/L if current BG is between 4.5-6.0 mmol/L or 6.1-8.0 mmol/L respectively)is observed. NS-3H and STAR difference significance is evaluated using the Fisher exact test on exact numbers when percentage is reported, the Wilcoxon rank sum test when comparing distributions, or the Welch test when mean (SD) is given.
3. RESULTS
Simulation results for both protocols and reported values for NICE-SUGAR are summarised in Table 1.
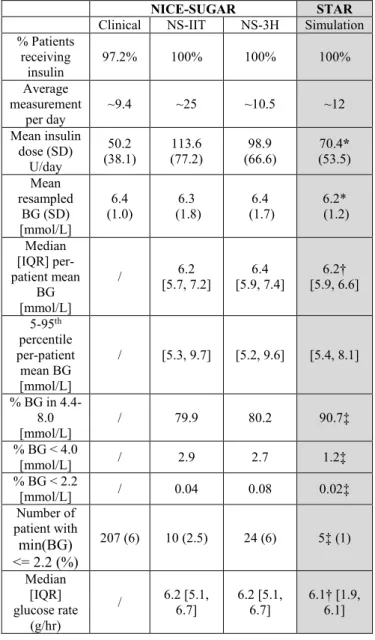
In simulation, STAR provides better performance than NS-IIT simulated directly as per protocol, with higher percentage BG in the 4.4-8.0 mmol/L range (90.7% vs. 79.9%), and tighter median [IQR] per-patient mean BG (6.2 [5.9, 6.6] vs. 6.2 [5.7, 7.2] mmol/L). STAR also provides better safety from hypoglycaemia (5 (1%) vs. 10 (2.5%) patients). The 5th-90th percentile range of per-patient mean BG for NICE-SUGAR (5.3-9.7mmol/L) indicates ~5% of patients have a mean BG above 9.7 mmol/L, matching clinically reported performance, whereas STAR’s 5th-90th percentile range is 5.4-8.1 mmol/L. Nutrition is similar across the protocols, with a median glucose rate of 6.2 and 6.1 g/hr for NS-IIT and STAR respectively. Additionally, STAR averages ~12 measurements per day where NS-IIT averages ~25. In summary, STAR resulted in tighter control to an intermediate level with less variability, and did so for a greater number and close to all patients. NS-3H protocol results in a mean 10.5 measurement per day, matching better the reported value of 9.4. In contrast, per protocol, the NICE-SUGAR study would require ~25 measurements per day, which is 1/hour and not clinically feasible (Aragon, 2006, Holzinger et al., 2008, Chase et al.,
2008a). Hence, the simulations captured the workload better with the NS-3H case.
Results show a percentage BG in 4.4-8.0 mmol/L of 80%, a median [IQR] per-patient mean BG of 6.4 [5.9 7.4] mmol/L, and a mean (SD) BG of 6.4 (1.7) mmol/L. A total of 24 patients (6%) experienced severe hypoglycaemia under NS-3H. These results match clinically reported values, of mean (SD) BG of 6.4 (1) mmol/L, and 7% of patients experiencing hypoglycaemic event. Hence, the safety and overall per patient performance were similar to that reported clinically.
In terms of insulin administrated, results present disparities between the protocols. Reported clinically, NICE-SUGAR mean insulin dose (SD) is 50.2 (38.1) U/day. Simulations show 70.4 (53.5) U/day for STAR and 113.6 (77.2) for NICE-SUGAR. Finally, NS-3H resulted in 98.9 (66.6) U/day. .
Table 1 - Simulation results summary and recorded NICE-SUGAR clinical outcomes. The symbol “/” is used when data is not reported in the original study. Significance level (P<0.05) is indicated with * for Welch test, † for the Wilcoxon rank sum test, and ‡ for the Fisher exact test.
NICE-SUGAR STAR
Clinical NS-IIT NS-3H Simulation
% Patients receiving insulin 97.2% 100% 100% 100% Average measurement per day ~9.4 ~25 ~10.5 ~12 Mean insulin dose (SD) U/day 50.2 (38.1) 113.6 (77.2) 98.9 (66.6) 70.4* (53.5) Mean resampled BG (SD) [mmol/L] 6.4 (1.0) 6.3 (1.8) 6.4 (1.7) 6.2* (1.2) Median [IQR] per-patient mean BG [mmol/L] / [5.7, 7.2] 6.2 [5.9, 7.4] 6.4 [5.9, 6.6] 6.2† 5-95th percentile per-patient mean BG [mmol/L] / [5.3, 9.7] [5.2, 9.6] [5.4, 8.1] % BG in 4.4-8.0 [mmol/L] / 79.9 80.2 90.7‡ % BG < 4.0 [mmol/L] / 2.9 2.7 1.2‡ % BG < 2.2 [mmol/L] / 0.04 0.08 0.02‡ Number of patient with min(BG) <= 2.2 (%) 207 (6) 10 (2.5) 24 (6) 5‡ (1) Median [IQR] glucose rate (g/hr) / 6.2 [5.1, 6.7] 6.2 [5.1, 6.7] 6.1† [1.9, 6.1]
In all cases, insulin dose is higher than that reported clinically, suggesting that larger insulin doses were not given in the original clinical study, despite a protocol not limiting the rate of insulin administration, or that the underlying NICE-SUGAR cohorts were either more insulin sensitive and/or received less nutrition than given to these virtual patients. Any or all of these factors may play a role, but with such a large peak insulin dose, it would not be surprising to find compliance to such recommendations to be low (Penning, 2014).
4. DISCUSSION
The NICE-SUGAR international multicentre study showed increased risk of hypoglycaemia and mortality for intensive insulin therapy over conventional control (Finfer et al., 2009, Finfer et al., 2012). However, these results have been much debated and the study design and validity of the results questioned (Mesotten and Van den Berghe, 2009, Griesdale et al., 2009). The results of this study, based on simulation using validated virtual patients, show important differences between the original protocol and clinically reported values.
Simulations based on the original NICE-SUGAR protocol show poor performance and similar risks of hypoglycaemia than reported. Much more insulin was administered in simulation than clinically, and the number of average measurement per day was consequently higher, reaching the expected value of ~24 measurement per day, as per protocol design. All these disparities suggest very poor compliance by clinical staff to the protocol, and thus potentially low confidence in the NICE-SUGAR protocol, which in turn could lead to further lack of compliance in dosing insulin (Chase et al., 2008a).
The NS-3H protocol was implemented in order to match clinically reported measurements per day, for comparison of results. The goal was to estimate the non-compliance in a way that delivered similar workload but could be clinically realistic. As a result, similar results were achieved compared to those clinically reported. However, much more insulin was administered, again per protocol design, where, as noted, compliance might be lower given the risks.
This study has several limitations. Firstly, important details pertaining to glycaemic control, such as nutrition type and total carbohydrate/dextrose intake, are missing from the original NICE-SUGAR paper. In addition, the paper focuses on clinical outcomes as per study design, reports few details around the distribution of BG outcomes for each study arm. While per-patient mean BG gives some indication of the differences in BG between the study arms, it may not reflect underlying protocol performance in that it likely tightens BG distributions and does not well reflect incidence of extreme BG values. Further, it is influenced by the length of patient stay.
This study makes several assumptions around measurement interval and nutrition when simulating the NICE-SUGAR
protocol. While necessary, these assumptions may not reflect actual clinical practice delivered. However, a measurement interval of ~3 hours once BG is within the target band is more clinically likely given the impact on nursing workload, and more closely matches reported BG measures/day. Nutrition wise, simulating with a low-carb enteral nutrition is reflects a more conservative approach, as increased dextrose intake tends to make glycaemic control more difficult and magnifies patient variability. These simulations thus reflect a best case outcome for the NICE-SUGAR protocol.
Finally, a limitation of these simulations is that it relies on virtual patients drawn from a different ICU cohort than those in the NICE-SUGAR study. These patients may thus have a different underlying SI than the NICE-SUGAR patients, a result which may affect the amount of insulin dosed in simulation. However, previous work has shown similar variability in SI between different ICU cohorts, which enables virtual patients to give consistent BG outcomes in simulation (in review). Thus, virtual patients are generalizable in the sense of predicting BG outcomes, and these simulation results are likely to reflect NICE-SUGAR protocol dynamics.
Glycaemic control protocols need to be both safe and effective for all patients, and be able to account for patient variability, before potential clinical benefits can be assessed (Penning et al., 2015, Chase et al., 2008a, Krinsley and Preiser, 2015, Signal et al., 2012). Indeed, meta-analysis studies have recently shown that studies where glycaemic protocols achieved the targeted range reported reduced mortality, while others showed no beneficial outcome or increased mortality (Mesotten and Van den Berghe, 2009, Griesdale et al., 2009). These simulations suggest that there was poor compliance to the NS-IIT protocol, and subsequent low time (45%) in the targeted BG range (4.5 – 6.0 mmol/L), and increased hypoglycaemia contributed to poor outcomes in the intensive group.
5. CONCLUSION
This study compared NICE-SUGAR and STAR protocols on validated virtual patients. NICE-SUGAR simulation outcomes were also compared to clinically reported data. Per-protocol, STAR showed safer and tighter control than NICE-SUGAR. Comparing with published values, results were completely different, suggesting a real lack in compliance. NICE-SUGAR protocol was slightly modified to match the number of measurements per day published. The results were comparable.
NICE-SUGAR was unable to achieve safe and effective control for all patients, and thus potential clinical benefits could be biased.
Acknowledgments:
The authors acknowledge the support of the EUFP7 and RSNZ Marie Curie IRSES program, the Health Research Council (HRC) of New Zealand, the MedTech CoRE and TEC, and NZ National Science Challenge 7, Science for Technology and Innovation.
6. REFERENCES
Aragon, D. 2006. Evaluation of nursing work effort and perceptions about blood glucose testing in tight glycemic control. Am J Crit Care, 15, 370-7. Australia and New Zealand Intensive Care Society Clinical
Trials Group, Canadian Critical Care Trials Group & The George Institute for Internation Health. 2008. The NICE-SUGAR Study [Online]. Available: https://studies.thegeorgeinstitute.org/nice/docs/PRO TOCOL.pdf [Accessed 11/11/2016.
Bagshaw, S. M., Bellomo, R., Jacka, M. J., Egi, M., Hart, G. K., George, C. & Committee, A. C. M. 2009. The impact of early hypoglycemia and blood glucose variability on outcome in critical illness. Crit Care, 13, R91.
Capes, S. E., Hunt, D., Malmberg, K. & Gerstein, H. C. 2000. Stress hyperglycaemia and increased risk of death after myocardial infarction in patients with and without diabetes: a systematic overview. Lancet, 355, 773-8.
Chase, J. G., Andreassen, S., Jensen, K. & Shaw, G. M. 2008a. Impact of human factors on clinical protocol performance: a proposed assessment framework and case examples. J Diabetes Sci Technol, 2, 409-16. Chase, J. G., Le Compte, A. J., Suhaimi, F., Shaw, G. M.,
Lynn, A., Lin, J., Pretty, C. G., Razak, N., Parente, J. D., Hann, C. E., Preiser, J. C. & Desaive, T. 2011. Tight glycemic control in critical care--the leading role of insulin sensitivity and patient variability: a review and model-based analysis. Comput Methods Programs Biomed, 102, 156-71.
Chase, J. G., Pretty, C. G., Pfeifer, L., Shaw, G. M., Preiser, J. C., Le Compte, A. J., Lin, J., Hewett, D.,
Moorhead, K. T. & Desaive, T. 2010a. Organ failure and tight glycemic control in the SPRINT study. Crit Care, 14, R154.
Chase, J. G., Shaw, G., Le Compte, A., Lonergan, T., Willacy, M., Wong, X. W., Lin, J., Lotz, T., Lee, D. & Hann, C. 2008b. Implementation and evaluation of the SPRINT protocol for tight glycaemic control in critically ill patients: a clinical practice change. Crit Care, 12, R49.
Chase, J. G., Suhaimi, F., Penning, S., Preiser, J. C., Le Compte, A. J., Lin, J., Pretty, C. G., Shaw, G. M., Moorhead, K. T. & Desaive, T. 2010b. Validation of a model-based virtual trials method for tight
glycemic control in intensive care. Biomed Eng Online, 9, 84.
Egi, M., Bellomo, R., Stachowski, E., French, C. J., Hart, G. K., Taori, G., Hegarty, C. & Bailey, M. 2010. Hypoglycemia and outcome in critically ill patients. Mayo Clin Proc, 85, 217-24.
Evans, A., Le Compte, A., Tan, C. S., Ward, L., Steel, J., Pretty, C. G., Penning, S., Suhaimi, F., Shaw, G. M., Desaive, T. & Chase, J. G. 2012. Stochastic targeted (STAR) glycemic control: design, safety, and performance. J Diabetes Sci Technol, 6, 102-15. Finfer, S., Chittock, D. R., Su, S. Y., Blair, D., Foster, D., Dhingra, V., Bellomo, R., Cook, D., Dodek, P., Henderson, W. R., Hebert, P. C., Heritier, S., Heyland, D. K., Mcarthur, C., Mcdonald, E., Mitchell, I., Myburgh, J. A., Norton, R., Potter, J., Robinson, B. G. & Ronco, J. J. 2009. Intensive versus conventional glucose control in critically ill patients. N Engl J Med, 360, 1283-97.
Finfer, S., Liu, B., Chittock, D. R., Norton, R., Myburgh, J. A., Mcarthur, C., Mitchell, I., Foster, D., Dhingra, V., Henderson, W. R., Ronco, J. J., Bellomo, R., Cook, D., Mcdonald, E., Dodek, P., Hebert, P. C., Heyland, D. K. & Robinson, B. G. 2012.
Hypoglycemia and risk of death in critically ill patients. N Engl J Med, 367, 1108-18.
Fisk, L. M., Le Compte, A. J., Shaw, G. M., Penning, S., Desaive, T. & Chase, J. G. 2012. STAR
development and protocol comparison. IEEE Trans Biomed Eng, 59, 3357-64.
Griesdale, D. E., De Souza, R. J., Van Dam, R. M., Heyland, D. K., Cook, D. J., Malhotra, A., Dhaliwal, R., Henderson, W. R., Chittock, D. R., Finfer, S. & Talmor, D. 2009. Intensive insulin therapy and mortality among critically ill patients: a meta-analysis including NICE-SUGAR study data. CMAJ, 180, 821-7.
Hann, C. E., Chase, J. G., Lin, J., Lotz, T., Doran, C. V. & Shaw, G. M. 2005. Integral-based parameter identification for long-term dynamic verification of a glucose-insulin system model. Comput Methods Programs Biomed, 77, 259-70.
Holzinger, U., Feldbacher, M., Bachlechner, A., Kitzberger, R., Fuhrmann, V. & Madl, C. 2008. Improvement of glucose control in the intensive care unit: an interdisciplinary collaboration study. Am J Crit Care, 17, 150-6.
Krinsley, J. 2005. Glucose control reduces ICU stay and mortality. Perform Improv Advis, 9, 4-6, 1.
Krinsley, J. S. 2003. Association between hyperglycemia and increased hospital mortality in a heterogeneous population of critically ill patients. Mayo Clin Proc, 78, 1471-8.
Krinsley, J. S. 2004. Effect of an intensive glucose
management protocol on the mortality of critically ill adult patients. Mayo Clin Proc, 79, 992-1000.
Krinsley, J. S. 2009. Glycemic variability and mortality in critically ill patients: the impact of diabetes. J Diabetes Sci Technol, 3, 1292-301.
Krinsley, J. S. & Preiser, J. C. 2015. Time in blood glucose range 70 to 140 mg/dl >80% is strongly associated with increased survival in non-diabetic critically ill adults. Crit Care, 19, 179.
Lin, J., Lee, D., Chase, J. G., Shaw, G. M., Le Compte, A., Lotz, T., Wong, J., Lonergan, T. & Hann, C. E. 2008. Stochastic modelling of insulin sensitivity and adaptive glycemic control for critical care. Comput Methods Programs Biomed, 89, 141-52.
Lin, J., Razak, N. N., Pretty, C. G., Le Compte, A., Docherty, P., Parente, J. D., Shaw, G. M., Hann, C. E. & Geoffrey Chase, J. 2011. A physiological Intensive Control Insulin-Nutrition-Glucose (ICING) model validated in critically ill patients. Comput Methods Programs Biomed, 102, 192-205.
Marik, P. E. 2016. Tight glycemic control in acutely ill patients: low evidence of benefit, high evidence of harm! Intensive Care Med, 42, 1475-7.
Mccowen, K. C., Malhotra, A. & Bistrian, B. R. 2001. Stress-induced hyperglycemia. Crit Care Clin, 17, 107-24. Mesotten, D. & Van Den Berghe, G. 2009. Clinical benefits
of tight glycaemic control: focus on the intensive care unit. Best Pract Res Clin Anaesthesiol, 23, 421-9.
Penning, S. 2014. Tight Glycaemic Control : Model-based methods to answer critical questions about this controversial therapy. PhD, University of Liège. Penning, S., Chase, J. G., Preiser, J. C., Pretty, C. G., Signal,
M., Melot, C. & Desaive, T. 2014. Does the achievement of an intermediate glycemic target reduce organ failure and mortality? A post hoc analysis of the Glucontrol trial. J Crit Care, 29, 374-9.
Penning, S., Pretty, C., Preiser, J. C., Shaw, G. M., Desaive, T. & Chase, J. G. 2015. Glucose control positively influences patient outcome: A retrospective study. J Crit Care, 30, 455-9.
Preiser, J. C., Devos, P., Ruiz-Santana, S., Melot, C., Annane, D., Groeneveld, J., Iapichino, G., Leverve, X., Nitenberg, G., Singer, P., Wernerman, J., Joannidis, M., Stecher, A. & Chiolero, R. 2009. A prospective randomised multi-centre controlled trial on tight glucose control by intensive insulin therapy in adult intensive care units: the Glucontrol study. Intensive Care Med, 35, 1738-48.
Preiser, J. C. & Straaten, H. M. 2016. Glycemic control: please agree to disagree. Intensive Care Med, 42, 1482-4.
Signal, M., Le Compte, A., Shaw, G. M. & Chase, J. G. 2012. Glycemic levels in critically ill patients: are normoglycemia and low variability associated with
improved outcomes? J Diabetes Sci Technol, 6, 1030-7.
Stewart, K. W., Pretty, C. G., Tomlinson, H., Thomas, F. L., Homlok, J., Noemi, S. N., Illyes, A., Shaw, G. M., Benyo, B. & Chase, J. G. 2016. Safety, efficacy and clinical generalization of the STAR protocol: a retrospective analysis. Ann Intensive Care, 6, 24. Van Den Berghe, G., Wilmer, A., Hermans, G., Meersseman,
W., Wouters, P. J., Milants, I., Van Wijngaerden, E., Bobbaers, H. & Bouillon, R. 2006a. Intensive insulin therapy in the medical ICU. N Engl J Med, 354, 449-61.
Van Den Berghe, G., Wouters, P., Weekers, F., Verwaest, C., Bruyninckx, F., Schetz, M., Vlasselaers, D.,
Ferdinande, P., Lauwers, P. & Bouillon, R. 2001. Intensive insulin therapy in critically ill patients. N Engl J Med, 345, 1359-67.
Van Den Berghe, G., Wouters, P. J., Bouillon, R., Weekers, F., Verwaest, C., Schetz, M., Vlasselaers, D., Ferdinande, P. & Lauwers, P. 2003. Outcome benefit of intensive insulin therapy in the critically ill: Insulin dose versus glycemic control. Crit Care Med, 31, 359-66.
Van Den Berghe, G., Wouters, P. J., Kesteloot, K. & Hilleman, D. E. 2006b. Analysis of healthcare resource utilization with intensive insulin therapy in critically ill patients. Crit Care Med, 34, 612-6. Wiener, R. S., Wiener, D. C. & Larson, R. J. 2008. Benefits
and risks of tight glucose control in critically ill adults: a meta-analysis. JAMA, 300, 933-44.