OATAO is an open access repository that collects the work of Toulouse
researchers and makes it freely available over the web where possible
Any correspondence concerning this service should be sent
to the repository administrator:
[email protected]
This is an author’s version published in: http://oatao.univ-toulouse.fr/21872
To cite this version:
André, Rémi and Le parlouer, Pierre and Marlin, Laurent and Plantier, Frédéric and Torré,
Jean-Philippe
Recent improvements in the high pressure differential scanning calorimetry
method applied to the study of gas hydrates. (2014) In: The 8th International Conference on
Gas Hydrates (ICGH8), 28 July 2014 - 1 August 2014 (Beijing, China). (Unpublished)
RECENT IMPROVEMENTS IN THE HIGH PRESSURE DIFFERENTIAL
SCANNING CALORIMETRY METHOD APPLIED TO THE STUDY OF
GAS HYDRATES
Rémi ANDRE∗∗∗∗, Pierre LE PARLOUËR
SETARAM Instrumentation, 7 Rue de l’Oratoire, CALUIRE, F-69300, FRANCE Laurent MARLIN, Frédéric PLANTIER, Jean-Philippe TORRE
Univ. Pau & Pays Adour, CNRS, TOTAL – UMR 5150 – LFC-R –Laboratoire des Fluides Complexes et leurs Réservoirs, Avenue de l’Université, BP 1155 – PAU, F-64013, FRANCE
ABSTRACT
A novel prototype of calorimetric cell has been developed and the technical details of the system and typical results are presented. It was demonstrated that this invention allows performing experiments under pressure, potentially up to 200bar with an in situ stirring system. The demonstration focuses particularly on the determination of the enthalpy variation and temperature of dissociation of CO2 hydrate and a positive comparison with published data. The use of such a system thus opens a wide range of potential practical applications for determining properties of complex fluids in both pressurized and agitated conditions.
Keywords: high pressure calorimetry, CO2 hydrates, dissociation enthalpies
∗ Corresponding author: Phone: +33 472 102 525 E-mail: [email protected]
INTRODUCTION
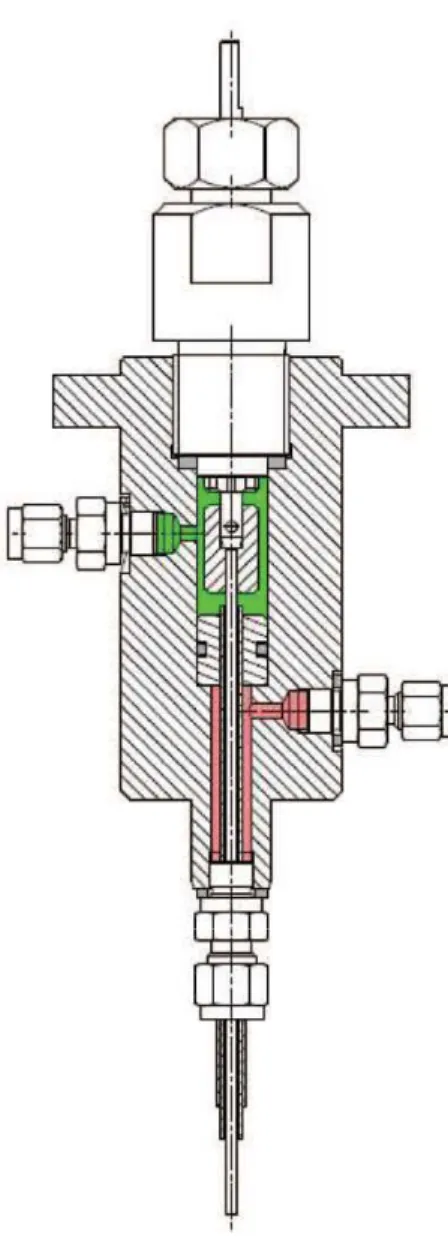
Differential Scanning Calorimetry is a widely spread technique due for instance to its ability to accurately detect phase transitions, follow up the kinetics of a thermal event, or determine the heat capacity of materials [1]. Although some early developments were conducted by Handa and al. [2], its growth in the gas hydrates applications was started by a collaborative work lead by the French Institute of Petroleum – New Energies [3]. Thanks to the design of an innovative combination of high pressure resisting cells (Figure 1) and pressure controlled gas panel, it was found to be a relevant tool for investigating the thermodynamics of formation and dissociation of gas hydrates as it is able to replicate the appropriate temperature and pressure conditions.
The method was originally applied to fields related to oil and gas production and flow assurance [4], then extended to the study of oil-water-gas systems and the emulsion stability of oils with hydrates [5]. It has now been involved in several
new studies. Indeed, carbon dioxide sequestration by CO2/CH4 exchange in natural gas hydrates present in marine sediments, carbon dioxide hydrates reversible formation/dissociation for refrigeration loops, hydrogen storage system through the formation of hydrogen hydrates [6], and many other studies involve the use of HP-DSC.
However, the technique still has some limitations, being linked to the fact that the gas hydrate formation in the calorimetric cell occurs generally at the gas-liquids interface [7]. It may lead to difficulties such as inefficient gas dissolution, long induction times, formation of a hydrate crust covering the gas/liquid interface, low hydrate to water conversion, etc. Water-in-oil emulsions can be cited as a specific case because the pressurizing gas may dissolve and be transported in the oil matrix before reacting with the relatively small water droplets. But in most cases, this phenomenon makes for example difficult or impossible the accurate determination of heat Proceedings of the 8th International Conference on Gas Hydrates (ICGH8-2014),
capacities or kinetics of formation and dissociation of gas hydrates.
A new high pressure, mechanically stirred calorimetric cell has been designed in order to overcome the existing limitations. This cell has been developed by the Laboratory of Complex Fluids and their Reservoirs of the University of Pau and Pays de l’Adour (patent #FR/2012/57319 UPPA-CNRS) and has been industrialized and is now commercialized by SETARAM Instrumentation.
Figure 1 High pressure stirred calorimetric cell.
EXPERIMENTAL Calorimeter
The development was based on a Calvet-type low temperature (-196°C to +200°C) BT2.15 calorimeter manufactured by SETARAM Instrumentation, France. The main feature of Calvet-type calorimeters is their network of thermocouples surrounding the calorimetric cell in which the samples are placed, allowing a measurement of the heat flow in all directions. BT2.15 sensor is differential, meaning that the sample heat flow data are constantly compared to the heat flow data of a reference cell. It aims at subtracting heat effects linked with the heat capacity of the cell, potential pressure variations, or any other interfering phenomena.
For subambiant operations, the calorimeter can either be cooled down thanks to a flow of liquid nitrogen generated from a 100 liters tank, or by a cooling circuit including a cryothermostat in which flows a heat exchanging liquid. The latter was selected in the present study, with ethanol as a heat exchanging fluid allowing operations down to -30°C.
The calorimeter heatflow signal was calibrated and its temperature measurement was corrected using the method of standard materials melting (ISO standard ISO11357-1) [8].
High Pressure Stirred Cell
The cell body, in which the samples can be inserted, is a 17mm outer diameter stainless steel cylinder. Because of the required high pressure resistance, it has been designed with large walls, which still allow using a sample volume of approx. 7mL. The connection of the cell body is made tight thanks to the use of a 316L stainless steel part which is compressed by a stainless steel 303 nut closed by the operator. The whole setup is thus able to work under pressures as high as 200 bar. The mechanical agitation in the measuring cell is provided by a screwable stirrer. A number of designs have been used or can be developed easily, but the one employed for the presented data have star washers welded on a stainless steel rod. The link between the wellhead and the measuring cell is provided by two concentric tubes allowing the stirring rod to rotate freely in the tubes. The maximum stirring rate is 200 rotations per minute. The space between the stirring rod and the smaller diameter tube is dedicated to fluid injection into the cell, while the annular space between the two concentric tubes is meant to flow the fluids out of the cell. The direction of the fluid flow is completely reversible. Pressure inside the cell can be dynamically controlled during the experiment. On the upper part of the system (Figure 2), a 4-lobes ring provides a tight connection while allowing a path for the stirring rod. A clamping system allows connecting the rod coming from the -cell and the stirring motor axis. The fluids are injected in or out of the cell by means of two nozzles located on the sides of the upper part. An O-ring inserted into an anti-shunt system creates two cavities, one for the fluid inlet and the one for the fluid outlet.
Samples
All the organic products used for the enthalpy calibration and temperature correction were supplied by Sigma Aldrich with a purity superior to 99.7% for cyclohexane and superior to 99% for n-dodecane, n-tetradecane, and n-hexadecane. For all experiments, the quantities of material introduced in the cell were weighted using an electronic balance with a precision of ±0.001 mg. Ultra pure water (resistivity of 18.2MΩ· cm) produced by a water purification system from ELGA Labwater (France).
The gases used in the experiments were nitrogen and carbon dioxide supplied by Linde with a purity of 99.999% and 99.995%, respectively.
Figure 2 Fluid flow in the upper part of the cell. The setup was used to obtain thermodynamic properties of gas hydrates, more particularly the carbon dioxide hydrate. The measurement of thermodynamic or thermophysical data of gas hydrates is important in various domains such as petroleum engineering, flow assurance, environment, CO2 capture and storage, energy, etc. [2-9].
A quantity of ultra-pure water was directly introduced and weighted in a clean, duly dried high pressure cell body. The setup was then tightly closed and inserted in the measurement calorimetric cavity, the other well receiving the reference cell filled with nitrogen at 2 bar. The measurement cell was connected to a CO2 buffer volume through the above described upper part.
This buffer volume was itself connected to the CO2 cylinder. A pressure-reducing valve allowed the gas to be charged into the cell at the desired pressure with a precision of ±0.1 bar. Two precision valves and digital manometers, allowed adjusting the pressure at the desired value in order to compensate any pressure variations due to gas consumption (or release) during hydrate formation (or dissociation). During all the experiments, the pressure was kept stable in a ±0.5 bar range. In order to remove any traces of air in the system, the cell was initially flowed with CO2 at low pressure. For all the experiments ran under stirring conditions, the rate was kept constant at 150 RPM. The system was then pressurized at the desired level (30.5 bar) with CO2 and maintained constant during roughly 18 hours. The temperature was
then decreased from 20°C to 0.9°C at a cooling rate of 0.1°C/min in order to bring the system in the CO2 hydrate metastability zone (i.e., the pressure temperature region where the CO2 hydrate should form). Note that the temperature was always maintained above zero to avoid any risk of ice formation. The temperature was then maintained constant at 0.9°C during ∼ 20 h.
Finally, the temperature was increased from 0.9°C to 25°C at 0.1°C/min to dissociate the hydrate formed, and the temperature was finally stabilized at 25°C.
RESULTS AND DISCUSSION
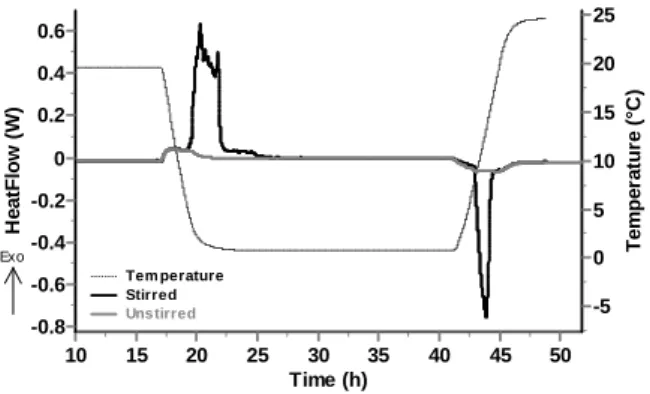
With the absence of stirring, as seen on Fig. 3, only poorly energetic effects are observed during the cooling and heating sequences of the experiment. They are respectively linked to formation and dissociation of CO2 hydrates at the interface between the liquid and the gaseous phases. During cooling, once a hydrate layer is formed at the interface, it drastically limits the possibilities of gas transfer to the liquid phase and thus stops the reaction. During heating, only the formed hydrate can dissociate and lead to a heat effect. This phenomenon has already been observed and discussed by other authors [5, 10-11].
At the contrary, under stirred conditions (agitation rate maintained at 150 RPM during the whole experiment), the CO2 hydrate forms easily during the cooling ramp. A strong exothermic crystallization peak beginning approx. at 12°C is observed thanks to stirring and subsequent triggering of the hydrate formation by breakage of the crystallization metastability.
In order to maintain a constant stirring rate, the intensity of the motor is increasing. During the crystallization, the torque imparted in the agitator by the motor is increasing progressively to agitate the hydrate slurry which is thickening into the cell. Note that the system is maintained agitated since the intensity of the motor remains inferior to its safety limit, equivalent to a torque of the motor about 2 Nm. Therefore, the agitator generally stops close to the maximum of the exothermic peak meaning that at this point there is likely to have very few free-water in the system hydrate.
Time (h) 50 45 40 35 30 25 20 15 10 T e m p e ra tu re ( °C ) 25 20 15 10 5 0 -5 H e a tF lo w ( W ) 0.6 0.4 0.2 0 -0.2 -0.4 -0.6 -0.8 Tem perature Stirred Uns tirred Exo
Figure 3 Superimposition of temperature and heat flow data for experiments with (dark gray) and without (light grey) stirring.
Temperature (°C) 20 15 10 5 H e a tF lo w ( W ) 0 -0.2 -0.4 -0.6 -0.8 Exo Heat : 60 (kJ.mol-1) Onset : 7.6 (°C)
Figure 4 Treatment of the hydrate dissociation endotherm
During the heating sequence, a strong endothermic peak is observed and corresponds to the dissociation of all the CO2 hydrate formed during the cooling sequence.
The enthalpy and temperature of dissociation of carbon dioxide hydrate were directly deduced from the calorimetric trace. The dissociation temperature at the given pressure (here 30.5 bar)
corresponds to the equilibrium point where the hydrate begins to release the gas entrapped in the water cavities.
The dissociation temperature corresponds to the onset temperature of the peak, i.e. the intersection between the integration baseline and the inflectional tangent at the ascending peak slope (Figure 4). The heat exchanged during the transition corresponds to the area between the integration baseline and the curve (highlighted in Figure 4). The enthalpy variation linked with the hydrate dissociation (∆Hdiss) is then calculated by dividing this area (expressed in J) by the amount of carbon dioxide trapped in the hydrate assuming that the hydration number (denoted n) of the carbon dioxide hydrate (CO2-n.H2O) is equal to 7.3 [12] and a total conversion of water into hydrate.
The reproducibility of the method was tested by running three identical experiments. The results obtained are listed in Table 1, showing a two standard error of 0.1°C for the dissociation temperature and of 1kJ.mol-1 for the enthalpy variation.
Run Tdiss / °C ∆Hdiss / kJ.mol
-1 1 7.5 62 2 7.6 60 3 7.7 61 Average 7.6 61 Std Dev 0.1 1 2 Std Er 0.1 1
Table 1 Enthalpy variation and temperature of dissociation of carbon dioxide hydrate at
P=30.5 bar.
The Figure 5 plots our result in terms of dissociation temperature at 30.5 bar (average of the three experiments carried out) on the three-phasic equilibrium line where gas, liquid, and CO2 hydrate coexist. The equilibrium data of reference are both experimental [13–15] and numerical (data obtained using the CSMGem program of the Colorado School of mines, from Sloan and Koh) [16]. The comparison between our data and those from other authors shows a very good agreement and proves the validity of the approach and of the system used. Regarding the enthalpy measurements, our results (62 ± 3 kJ.mol−1) agree with the available literature such as those of Anderson [17] who found this enthalpy to vary between 63.6 ± 1.8 kJ mol−1 and 57.7 ± 1.8 kJ
mol−1 between the two quadruple points, and those obtained more recently by Sabil et al. [18] with a value of 62.48 kJ mol−1 in very similar conditions of pressure (P = 30 bar instead of 30.5 bar).
5 10 15 20 25 30 35 40 45 50 -2 0 2 4 6 8 10 12 Temperature (°C) Pressure (bar)
GSMGem Model from Sloan and Koh (2008) Fan and Guo (1999) Adisasmito et al. (1991) Larson et al. (1955) our data
Figure 5 Experimental temperature of carbon dioxide hydrate dissociation (P = 30.5 bars) and
comparison to literature data of Sloan and Koh [16] Fan and Guo [13]
Adisasmito [19] and Larson [15]
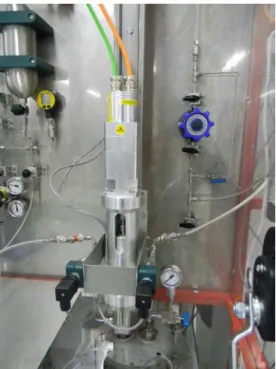
Figure 6 Magnetic stirrer version coupled to the calorimeter
CONCLUSIONS AND PROSPECTS
An innovative high pressure calorimetric cell was developed in order to solve two common issues met in all gas / liquid reactions but more particularly in the gas hydrates formation and dissociation studies: (i) the efficient and rapid
solubilization of gases into liquids; (ii) the incomplete conversion of the available liquid into hydrate; The system based on a pressure resistant cell, a dynamically controlled high pressure system and in situ mechanical stirrer was showed to be able to characterize the formation and dissociation of CO2 hydrates. The reproducibility of the experiments was fairly good, and the dissociation temperature and enthalpy were found in good agreement with other references.
Because it allows reaching the complete conversion of the water, this system will allow more into depth studies of gas hydrates like isothermal kinetics of formation and dissociation, heat capacity measurements, and potentially viscosity measurements by treating the torque data of the motor. Some improvement on the system design are anyway being conducted (See Figure 6) in order to limit the risks of leakage at the level of the upper part by using magnetic coupling instead of mechanical coupling. The system also has the advantage of allowing faster stirring rates (potentially up to 1500 rpm).
ACKNOWLEDGMENTS
The Institut Carnot ISIfoR and “Aquitaine Science Transfert” are gratefully acknowledged for the partial financial support in the development of the cell prototype. V. Cabrol, J. Diaz, F. Guerton and the staff of the “Atelier de Physique” are also thanked for their valuable technical work.
REFERENCES
[1] Hatakeyama T., Liu Z., Handbook of thermal
analysis, John Wiley and Sons Ltd, 1998.
[2] Handa Y.P., Calorimetric determinations of the
compositions, enthalpies of dissociation, and heat capacities in the range 85 to 270 K for clathrate hydrates of xenon and krypton, J. Chem.
Thermodynamics 18 (1986) 891-902.
[3] Dalmazzone C., Herzhaft B., Rousseau L., Le Parlouër P. and Dalmazzone D., Prediction of Gas
Hydrates Formation With DSC Technique,
Proceedings of the SPE Annual Technical Conference and Exhibition, Denver, Colorado, USA, 2003.
[4] Le Parlouër P., Dalmazzone C., Herzhaft B., Rousseau L., Mathonat C., Characterisation of gas
hydrates formation using a new high pressure micro-DSC, Journal of Thermal Analysis and
Calorimetry 78 (2004) 165-172.
[5] Lachance J. W., Sloan E. D., Koh C. A.,
effectiveness using emulsions, Chemical Engineering Science 64 (2009) 180-184.
[6] Dolotko O., Karimi A. A., Dalmazzone D., The
phase behaviours in mixed G + Tetra–N-Butylphosphonium borohydride and G + Tetra-N-Butylammonium hydroxie hydrates (where G = H2, N2), Proceedings of 7th International Conference
on Gas Hydrates, Edinburgh, Scotland, 2011. [7] Davies S. R., Hester K. C., Lachance J. W., Koh C. A., Sloan E. D., Studies of hydrate
nucleation with high pressure differential scanning calorimetry, Chemical Engineering Science 64
(2009) 370 – 375.
[8] Plantier F., Marlin L., Missima D., Torré J.-P.,
Development of a new type of high pressure calorimetric cell, mechanically agitated and equipped with a dynamic pressure control system - Application to the characterization of gas hydrates.
Review of Scientific Instruments 84 (2013) 125107
[9] Egenolf-Jonkmanns B., Bruzzano S., Deerberg G., Fischer M., Marzi T., Tyukavina M., Gomez J. S., Wack H., Zeidler-Fandrich B., Low temperature chemical reaction systems for thermal storage, Energy Procedia 30 ( 2012 ) 235 – 243.
[10] Daraboina N., Ripmeester J., Walker V. K., Englezos P., Natural Gas Hydrate Formation and
Decomposition in the Presence of Kinetic Inhibitors. 1. High Pressure Calorimetry, Energy
Fuels 2011, 25, 4392–4397.
[11] André R., Hall S., Le Parlouër P.,
Characterization of CO2 Clathrate formation and dissociation using High Pressure Calvet DSC,
Proceedings of 7th International Conference on Gas Hydrates, Edinburgh, Scotland, 2011.
[12] Uchida T., Hondoh T., Mae S., Kawabata J.,
Direct Ocean Disposal of Carbon Dioxide, Terra
Scientific Publishing Company, Tokyo, 1995, 45– 61.
[13] Fan S., Guo T.-M., Hydrate Formation of
CO2-Rich Binary and Quaternary Gas Mixtures in Aqueous Sodium Chloride Solutions, J. Am. Chem.
Soc. 44, 829 (1999).
[14] S. Adisasmito, R. J. Frank, and E. D. Sloan, J. Chem. Eng. Data 36, 68 (1991).
[15] S. D. Larson, Ph.D. thesis, University of Illinois, 1955.
[16] Sloan E. D. and Koh C. A., Clathrate
Hydrates of Natural Gases, 3rd ed., New York,
CRC Press, 2008.
[17] Anderson G. K., J. Chem. Thermodyn. 35, 1171 (2003).
[18] Sabil K. M., Witkamp G. J., Peters C. J., Fluid Phase Equilib. 290, 109 (2010).
[19] Adisasmito S., Frank R. J., Sloan E. D., J. Chem. Eng. Data 36, 68 (1991).