Significantly enhancement
of sunlight photocatalytic
performance of ZnO by doping
with transition metal oxides
Alfonso E. Ramírez
1*, Marly Montero‑Muñoz
2, Lizbeth L. López
3, J. E. Ramos‑Ibarra
2,
Jose A. H. Coaquira
2, Benoît Heinrichs
4& Carlos A. Páez
4In this study we report, the synthesis of ZnO and its doping with Transition Metal Oxides ‑TMO‑, such as Cr2O3, MnO2, FeO, CoO, NiO, Cu2O and CuO. Various characterization techniques were employed
to investigate the structural properties. The X‑ray diffraction (XRD) data and Rietveld refinement confirmed the presence of TMO phases and that the ZnO structure was not affected by the doping with TMO which was corroborated using transmission Electron microscopy (TEM). Surface areas were low due to blockage of adsorption sites by particle aggregation. TMO doping concentration in the range of 3.7–5.1% was important to calculate the catalytic activity. The UV–Visible spectra showed the variation in the band gap of TMO/ZnO ranging from 3.45 to 2.46 eV. The surface catalyzed decomposition of H2O2 was used as the model reaction to examine the photocatalytic activity
following the oxygen production and the systems were compared to bulk ZnO and commercial TiO2‑degussa (Aeroxyde‑P25). The results indicate that the introduction of TMO species increase
significantly the photocatalytic activity. The sunlight photocatalytic performance in ZnO‑doped was greater than bulk‑ZnO and in the case of MnO2, CoO, Cu2O and CuO surpasses TiO2 (P25‑Degussa). This
report opens up a new pathway to the design of high‑performance materials used in photocatalytic degradation under visible light irradiation.
The importance of raising global awareness about how light-based technologies promote sustainable development and provide solutions to global challenges has recognized by the United Nations1 In the environmental field,
light can play a vital role, because its combination with semiconductor materials it provides a great power for photodegradation2. It is well known the use of semiconductors like TiO
23 and ZnO for this purpose4. Likewise,
it is known that the wide band gap of these metal oxides limits their use in the visible range5. Additionally, rapid
recombination of hole-electrons pairs is another limitation of ZnO6.
Therefore, the development of new generation nanophotocatalysts is a challenge for improving their photo-catalytic activity in visible light. In the case of ZnO its application has been limited due to its large band gap7,
which can decrease the photocatalytic properties8. One strategy to enhance their performance and its use with
a light source, is doping with different elements and/or its compounds9. In case of ZnO, doping with the noble
metals where Ag is most reported10–13, but we can find reports for Pd14, Pt15 and Au16,17. Other elements that have
received special attention correspond to the lanthanide series18 specifically Ce19,20, Eu21, Gd22,23 and La24. Others
metals of d-type that are also studied include Fe25, Ni26,27, Mn28,29, Co30,31 and Cu32–34.
The surface catalyzed decomposition of H2O2 has been reported as useful, simple and inexpensive way to
evaluate the catalytic activity on solids under UV–visible light irradiation35–37. In this work, we have used the
surface photodecomposition of H2O2 to show that doping ZnO with transition metal oxides -TMO-, enhance
the photocatalytic powder of ZnO. In the case of doping with MnO2, Co2O3 and CuO, the resulting systems can
become possible substitutes to most efficient commercial photocatalyst: Aeroxide TiO2/P25. This new information
can be utilized to the future design of materials for the photocatalytic degradation under visible light irradiation.
OPEN
1Grupo de Catalisis, Departmento de Química, Universidad del Cauca, Popayán - Cauca, Colombia. 2Institute of
Physics, University of Brasilia, Brasília, DF 70910-900, Brazil. 3Grupo de Investigación en Electroquímica Y Medio
Ambiente, Facultad de Ciencias Básicas, Universidad Santiago de Cali, Cali, Colombia. 4Department of Chemical
Engineering, Génie chimique—Nanomatériaux et Interfaces, Université de Liège, Liege, Belgium. *†Carlos
www.nature.com/scientificreports/
Results and discussion
Characterization.
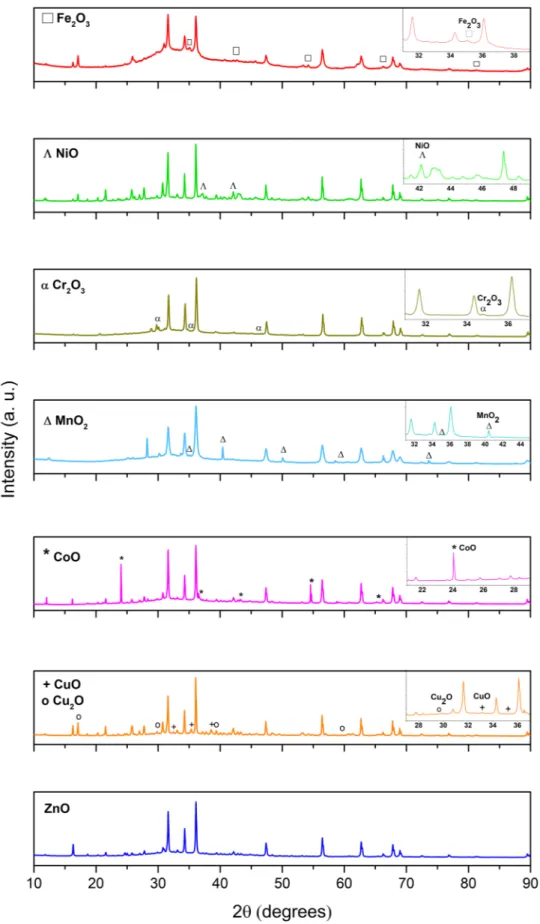
Zinc oxide phase corresponding to the wurtzite hexagonal structure (PDF 00–900-4179), with space group P63mc is the main phase as can be seen in Fig. 1. In addition to the ZnO main phase, reflections related to transition metal oxide dopant phase (see in the insets of Fig. 1) are determined. The follow-ing TMO phases were identified CuO (PDF 00–901-6057), Cu2O (PDF 00–900-7497), CoO (PDF 00–591-0031),Cr2O3 (PDF 00–900-7442), Fe2O3 (PDF 00–901-6457), NiO (PDF 00.432–0493) and MnO2 (PDF 00–151-4237).
In order to determine additional information, the XRD patterns were analyzed using the Rietveld refine-ment method. It was determined that the doping with TMO did not affect the wurtzite structure of ZnO, since all characteristic reflections of ZnO phase were also obtained in the XRD pattern of TMO/ZnO samples38.
The lattice constants, unit cell volume and percentage of phases are listed in Table 1. In all of cases, the static structure factor of the wurtzite phase (c/a ~ 1.602) remains constant. It suggests that essentially no changes were determined in the lattice constants of the wurtzite phase, implying that the transition metal did not diffuse into the ZnO structure, in agreement with that reported in the literature39. Otherwise, the diffusion could lead to the
substitution of Zn ions by the transition metal ions and it could lead to changes in the lattice constants of the wurtzite structure, which is not observed.
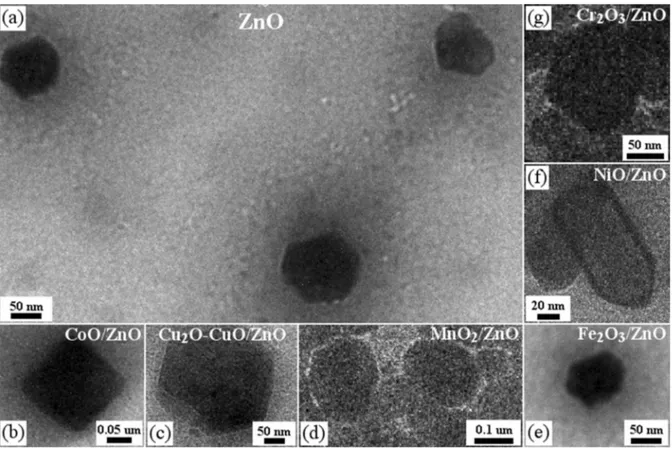
TEM measurements were performed in order to get more information about the crystalline structure of the photocatalysts, mainly the particle size. Figure 2 shows the typical TEM images of the synthesized catalysts. Figure 2a shows the ZnO nanoparticles with a hexagonal structure and Fig. 2b presents ZnO powder modified with TMO.
As shown in Fig. 2a we can inferred the mean size of the ZnO nanoparticles, which is close to 47 ± 5 nm. In Fig. 2b is shown that the particles are in the nanoscale (approximately 50–60 nm in size) and reveals: (i) an increase in size, may be as a result of the TMO surface covering of ZnO nanoparticles40 and (ii) the conservation
of hexagonal structure, indicating that the structure of ZnO is not notoriously affected by the TMO doping, in agreement with XRD data analysis.
The BET surface areas of our samples were determined and the values are listed in Table 2. ZnO exhibits a low surface area that reveal the effect of calcination as reported in the literature41. It is determined that the
TMO-doped ZnO samples show smaller surface area in comparison to the surface area of pure ZnO. That surface area change was attributed to the particles aggregation and; thus, to the partial blockage of adsorption sites42.
The optical characterization of materials allows the prediction of possible behavior of photocatalysts under illumination. Absorbance spectra, Fig. 3a, have been used to determine the optical band gap energy (Eg). The
values of Eg (Table 2) were determined using the Tauc’s plot method, Fig. 3b.
In all of cases, the band gap of TMO-doped ZnO are smaller in comparison to pure ZnO, being the smallest for the CoO/ZnO sample (2.46 eV). These results are in agreement with other works such as NiO/ZnO nanorods43
and CoO/ZnO nanofibers44. As a consequence of the coupling of MTO and ZnO in the heterojunction more
elec-trons are freely transferred from Mn+ of the TMO (with higher Fermi level) to ZnO (with lower level), promoting
the separation of holes and electrons and, then, effective heterojunctions are formed43. Therefore, the band gap
closing can facilitate stepping electrons from the valence band to the conduction band as that reported in the literature for CuO-ZnO nanocomposites45. That band gap closing leads to the photocatalytic activity
improve-ment of the TMO-doped ZnO nanocomposites.
Photocatalytic H
2O
2decomposition.
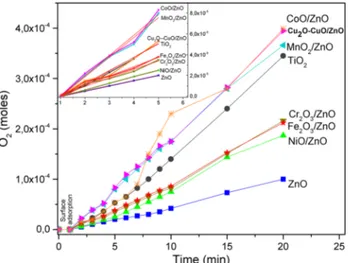
Control test. The reaction in the dark condition as a functionof time was followed. This control test confirmed that H2O2 is not decomposed in the dark condition. In the
absence of catalyst but under visible light irradiation, 0.65 × 10⁻⁴ mol of O
2 were produced and this control test
allows us affirm that decomposition rates are related only to the effect of light on the TMO/ZnO systems (Fig. 4). Photocatalytic systems. To understand the behavior of the materials in the reaction, we follow the O2 formation
as a function of time under visible light irradiation.
The Table 3 shows the production of O2 form the decomposition of H2O2 during 20 min. As observed, there
is a progressive increase in the O2 production. The conducting properties of the catalysts enhance the production
of O2 and therefore the H2O2 decomposition.
The Fig. 5 shows the kinetic study of the photocatalytic decomposition of H2O2 carried out using the
TMO-ZnO systems. As observed, the O2 production obeys the first-order law, as previously reported in the literature46.
The inset shows the initial rate (the slopes of the plots correspond to the rate constants). These rate constants are different and indicate distinct response of the systems, Table 4.
The irradiation without catalysts just promotes a weak H2O2 decomposition and leads to the O2 production
0.65 × 10⁻⁴ mol, while the use of ZnO increases the O
2 production up to 1.5 times (Table 3) demonstrating the
catalytic power of ZnO. Nevertheless, the doping of ZnO with MTO significantly enhance the photocatalytic power of ZnO, which suggests that the surface charge transfer process should increase, meanwhile, the electron— hole recombination rate should decrease42. In fact, the O
2 production (Table 3) can go up to 3.95 × 10⁻⁴ mol in the
presence of CoO/ZnO, which seems to be the system with the highest activity. Additionally, it was determined that the Aeroxide TiO2-P25 power can be exceed by the ZnO doping with transition metal oxides, specially
Cu2O, CuO, MnO2 and CoO.
Table 4 shows the reaction rate and the catalytic activity values. These parameters corroborate that the best dopant oxides are those previously mentioned. These results have been correlated with the redox potential and the amount of loaded metal ion47. Mn+4, Cu+2, Co+2, Cu+1 and Fe+3 have positive values and the low rate observed
Figure 1. XRD patterns of transition metal oxides-doped ZnO nanoparticles. In the insets are shown reflections corresponding to the TMO dopant phase.
www.nature.com/scientificreports/
Table 1. Lattice parameters and percentage of phases obtained from the Rietveld refinement of the XRD patterns.
Catalyst
Wurtzite phase TMO phase
a (Å) c (Å) c/a V (Å3) % a (Å) c (Å) % ZnO 3.2484 5.2046 1.602 47.56 100 − − 0 CoO/ZnO 3.2498 5.2052 1.602 47.61 96 5.1842 3.0172 4 Cu2O–CuO/ZnO 3.2497 5.2060 1.602 47.61 76 4.6539 5.1083 16 4.2521 4.2521 8 MnO2/ZnO 3.2514 5.2107 1.603 47.71 79 4.3886 2.8653 21 Cr2O3/ZnO 3.2485 5.2048 1.602 47.57 94 5.3524 5.3524 6 NiO/ZnO 3.2483 5.2037 1.602 47.55 89 4.1684 4.1684 11 Fe2O3/ZnO 3.2477 5.2028 1.602 47.59 82 5.4375 5.4375 18
Figure 2. (a) ZnO nanoparticles obtained. (b) TMO-doped ZnO. (c) Cu2O-CuO-doped ZnO. (d) MnO2-doped
ZnO. (e) Fe2O3-doped ZnO
Table 2. Main characteristics of catalysts used in the H2O2 photodecomposition. a % (w/w) M represents the
dopant content.
Catalyst %a (w/w) M S
BET (m2/g) Band gap energy (eV)
ZnO − 8.5 3.20 CoO/ZnO 4.3 2.5 2.46 Cu2O–CuO/ZnO 5.2 1.3 3.12 MnO2/ZnO 4.9 3.9 2.98 Cr2O3/ZnO 3.7 1.9 3.02 NiO/ZnO 5.0 2.5 3.15 Fe2O3/ZnO 5.1 4.8 2.92
Figure 3. (a) UV–Vis spectra for photocatalysts. (b) Tauc´s plot for band gap determination of TMO-doped ZnO.
www.nature.com/scientificreports/
value of band gap, which leads to higher efficiency of photocatalysts due to a better overlap with the light source spectrum50.
The H2O2 decomposition under visible light irradiation by different semiconductors SC as TiO251 or MnO235
has been studied and the mechanism is based on the oxidation–reduction properties of SC. For ZnO can be understood as follows: the irradiation of ZnO leads to excited state that can be expressed as ZnO (e−, h+) (reaction
R.1). The electron in the conduction band -CB- is available for transference (reaction R.2) while photoinduced valence band holes is open for donation (reaction R.3).
(R.1) ZnO −hv→ ZnO e−, h+ (R.2) h+ +H O →H+ +HO.
Table 3. Production of O2 by H2O2 decomposition in presence of photocatalytic systems. a During 20 min.
Catalysts O2 productiona (mol × 10–4)
None 0.65 ZnO 1.00 CoO/ZnO 3.95 Cu2O–CuO/ZnO 3.99 MnO2/ZnO 3.66 Cr2O3/ZnO 2.16 NiO/ZnO 1.87 Fe2O3/ZnO 2.12 Aeroxide TiO2/P25 3.45
Figure 5. Kinetic study of the H2O2 decomposition carried out using the MTO-ZnO systems under light visible
irradiation.
Table 4. Rate constants and catalytic activities for photocatalytic systems. Catalysts Rate constant (min−1 × 10⁻⁵) Catalytic activity (O
2 moles min−1 Mn+ moles−1)
CoO/ZnO 1.96 5.4 Cu2O–CuO/ZnO 1.27 3.1 MnO2/ZnO 1.90 4.2 Cr2O3/ZnO 0.82 2.3 NiO/ZnO 0.63 1.5 Fe2O3/ZnO 0.89 1.9
A direct interfacial charge transfer mechanism is proposed for the visible light activity in Mn+-modified
samples52. Firstly, the adsorption of H
2O2 by the TMO/ZnO system releases H+ ions (reaction R.5). The electrons
transferred to the CB of TMO from the valence band -VB- of ZnO lead to the metal reduction (reaction R.6). The catalyst regeneration step involves the HO. reduction to HO- (reaction R.8).
Therefore, in the two pathways, the free radicals HO2. (R.2 and R.6) or HO. (R.3) induce the chain reactions
sequence to produce the final products, H2O and O2 (reaction R.4 and R.7).
Methods
Preparation of ZnO and MTO‑doped ZnO.
ZnO and MTO-doped ZnO were prepared by the sol–gel method using a precursor alkaline solution composed of zinc acetate dihydrate dissolved in methanol, as described in a literature53. In all cases, the dopant source of MT was nitrate except in the case of Mn, which was
chloride. In a representative preparation, ZnO and MTO-doped ZnO were synthesized by the slow hydrolysis of zinc acetate using KOH as precursor. Zinc acetate dehydrate and a dopant were first dissolved in methanol and mixed together with a KOH solution (0.4 M) for obtain a clear and homogeneous solution. The solution was stirred at 60 °C for 2 h. Finally, the gel washed, dried and powdered before calcinations at 450 °C for eight hours in a muffle furnace. In Table 2 is shown the doped metal content determined from XRF measurements.
Characterization of ZnO and MTO‑doped ZnO.
X-ray diffraction analysis was performed using a RIGAKU Ultima IV diffractometer, with a Cu-Kα as radiation source and Ni-filtered with CBOmonochroma-tor. Operating voltage was 45 kV with beam current of 15 mA. The measurements were performed at step widths of 0.05 and the scan rate was maintained at 2° min−1. The XRD of the samples were performed in the 2θ range of
20–70o as in54. Additionally, the XRD data were analyzed using the Rietveld refinement method via the FullProf
program. QUALX2.0 software was used for phase identification in the qualitative analysis from powder diffrac-tion data.
Transmission electron microscopy (TEM) images were obtained by using a microscope (JOEL, model 1011) to determine the morphology, the mean particles size and the size distribution as in54.
The content of metal was estimated by Energy Dispersive X-ray technique using a EDX-720 Shimadzu Fluo-rescence Spectrometer (XRF). The solids were prepared as loose powder. The analysis was made using a Rh X-ray tube for 200 s under vacuum.
The UV–Vis spectra of samples were recorded in the range of 220–1000 nm using UV-2600 Shimadzu spectrophotometer.
For nitrogen adsorption–desorption, the measures were made at − 196 °C with a Fisons Sorptomatic 1990, after outgassing at 10−3 Pa for 24 h at ambient temperature.
Photocatalytic degradation of H
2O
2.
Degradation of H2O2 under visible light simulated conditions, withan halogen lamp (300 W, 220 V, λ ≥ 400 nm), was used to evaluate the photocatalytic activity of ZnO and MTO-doped ZnO following the report made by Paéz et al.35. The initial pH was kept between 4.6–5.1. 5 mg of solid was
suspended in 50 mL of deionized water in the reactor and ultra-sounded for 30 min; when the temperature was 20 °C, 10 mL of H2O2 solution were injected into the solid suspension and the lamp was turned on under visible
light radiation. The production (in mol) of oxygen was calculated by the change in H2O2 concentration during
photocatalytic run and has been determined from Eq. (1).
where C is the concentration of H2O2 at time t (mol L−1), C0 the initial concentration of H2O2 (6.5 mol L−1), P
the atmospheric pressure (≅ 101.3 kPa), R is the gas constant (8.314 L kPa mol−1 K−1), V
L the total volume of
solution (0.015 L), T is the room temperature and Vg corresponds to the integrated volume of gas liberated until
time t (L) at atmospheric pressure measured by the devices.
Conclusion
TMO/ZnO nanocomposites were successfully synthesized and tested their photocatalytic activity for H2O2. The
morphological and structural results confirmed that the TMO doping did not provoke the ions substitution in the ZnO lattices and that the ZnO structure is not affected. Optical measurements showed the ZnO band gap decrease with the doping. It is found that the doping reduces the electron–hole recombination rate, which improves the absorption in the visible region and leads to a significantly enhancement of sunlight photocatalytic (R.4) H2O2→1/2O2+ H2O
(R.5) Mn+/ZnO + H2O2→ Mn+/ ZnO (HO2)−+ H+
(R.6) Mn+/ ZnO (HO2)−+H+ hv −→ M(n−1)+/ZnO + HO.2 (R.7) HO.2+ H2O2→HO.+ O2+H2O (R.8) M(n−1)+/ZnO + HO.→Mn+/ZnO + HO− (1) C = Co − 2 × PVg RTVL
www.nature.com/scientificreports/
performance of ZnO. The surface-mediated decomposition of H2O2 and the consequent production of O2 were
used to measure the photocatalytic power of the TMO/ZnO nanocomposites. The resultant reaction rate values are explained based on the combination of redox potential of metal of the TMO and a better absorption of vis-ible light due to the presence of TMO in the TMO/ZnO system. Our findings indicate that Cu2O/ZnO, CuO/
ZnO, MnO2/ZnO and CoO/ZnO systems overcomes the photocatalytic activity of most popular commercial
photocatalyst: Aeroxide P25. Therefore, our results indicate that TMO/ZnO systems can substitute the current commercial photocatalysts.
Received: 29 April 2020; Accepted: 17 November 2020
References
1. United Nations Educational, Scientific and Cultural Organization. 37C/Resolution 15. https ://unesd oc.unesc o.org/ark:/48223 / pf000 02261 62 (2013).
2. Hoffman, M. R., Martin, S. T., Choi, W. & Bahnemann, D. W. Environmental applications of semiconductor photocatalysis. Chem.
Rev. 95(1), 69–96 (1995).
3. Chen, X. & Mao, S. S. Titanium dioxide nanomaterials: synthesis, properties, modifications, and applications. Chem. Rev. 107(7), 2891–2959 (2007).
4. Ali, A. M. et al. Doped metal oxide (ZnO) and photocatalysis: a review. J. Pak. Inst. Chem. Eng. 40(1), 11–19 (2012).
5. Ebrahimi, R. et al. Effects of doping zinc oxide nanoparticles with transition metals (Ag, Cu, Mn) on photocatalytic degradation of Direct Blue 15 dye under UV and visible light irradiation. J. Environ. Health Sci. Eng. 17(1), 479–492 (2019).
6. Xu, C. et al. Preparation, characterization and photocatalytic activity of Co-doped ZnO powders. J. Alloys Compd. 497(1–2), 373–376 (2010).
7. Vijayakumar, G. N. S., Devashankar, S., Rathnakumari, M. & Sureshkumar, P. Synthesis of electrospun ZnO/CuO nanocomposite fibers and their dielectric and nonlinear optic studies. J. Alloys Compd. 507, 225–229 (2010).
8. Dijken, A. V., Janssen, A. H., Smitsmans, M. H. P., Vanmaekelbergh, D. & Meijerink, A. Size-selective photoetching of nanocrystal-line semiconductor particles. Chem. Mater. 10, 3513–3522 (1998).
9. Tong, H. et al. Nano-photocatalytic materials: possibilities and challenges. Adv. Mater. 24, 229–251 (2012).
10. Liu, Y., Wei, S. & Gao, W. Ag/ZnO heterostructures and their photocatalytic activity under visible light: effect of reducing medium.
J. Hazard. Mater. 287, 59–68 (2015).
11. Zheng, Y. et al. Photocatalytic activity of Ag/ZnO heterostructure nanocatalyst: correlation between structure and property. J.
Phys. Chem. C 112, 10773–10777 (2008).
12. Ren, C., Yang, B., Wu, M., Xu, J., Fu, Z., lv, Y., Guo, T., Zhao, Y. & Zhu, C. Synthesis of Ag/ZnO nanorods array with enhanced photocatalytic performance. J. Hazard. Mater. 182, 123–129 (2010).
13. Yin, X. T., Que, W. X., Liao, Y. L., Zhang, J. & Shen, F. Y. Ag–ZnO composite nanocrystals: synthesis, characterization and photo-catalytic properties. Mater. Res. Innov. 16(3), 213–218 (2012).
14. Zhanga, Y., Wanga, Q., Xub, J. & Ma, S. Synthesis of Pd/ZnO nanocomposites with high photocatalytic performance by a solvo-thermal method. Appl. Surf. Sci. 258, 10104–10109 (2012).
15. Morales-Flores, N., Pal, U. & Sánchez Mora, E. Photocatalytic behavior of ZnO and Pt-incorporated ZnO nanoparticles in phenol degradation. Appl. Catal. A Gen. 394 269–275 (2011).
16. Georgiev, P. et al. Effect of gold nanoparticles on the photocatalytic efficiency of ZnO films. Colloids Surf. A Physicochem. Eng. Asp. 460, 240–247 (2014).
17. Silva, C. G. et al. Developing highly active photocatalysts: gold-loaded ZnO for solar phenol oxidation. J. Catal. 316, 182–190 (2014).
18. Kaneva, N., Bojinova, A., Papazova, K. & Dimitrov, D. Photocatalytic purification of dye contaminated sea water by lanthanide (La3+, Ce3+, Eu3+) modified ZnO. Catal. Today 252, 113–119 (2015).
19. Lamba, R., Umar, A., Mehta, S. K. & Kansal, S. K. CeO2/ZnO hexagonal nanodisks: Efficient material for the degradation of direct blue 15 dye and its simulated dye bath effluent under solar light. J. Alloys Compd 620, 67–73 (2015).
20. Chang, C. J., Lin, C. Y. & Hsu, M. H. Enhanced photocatalytic activity of Ce-doped ZnO nanorods under UV and visible light. J.
Taiwan Inst. Chem. Eng. 45(4), 1954–1963 (2014).
21. Zong, Y., Li, Z., Wang, X., Ma, J. & Men, Y. Synthesis and high photocatalytic activity of Eu-doped ZnO nanoparticles. Ceram. Int. 40, 10375–10382 (2014).
22. Luo, Y. et al. Fabrication and photocatalytic properties of Gd-doped ZnO nanoparticle-assembled nanorods. Mater. Lett. 149, 70–73 (2015).
23. Kumar, S. & Sahare, P. D. Gd3+ incorporated ZnO nanoparticles: a versatile material. Mater. Res. Bull. 51, 217–223 (2014). 24. Raza, W., Haque, M. M. & Muneer, M. Synthesis of visible light driven ZnO: Characterization and photocatalytic performance.
Appl. Surf. Sci. 322, 215–224 (2014).
25. Xie, J. et al. Synthesis of α-Fe2O3/ZnO composites for photocatalytic degradation of pentachlorophenol under UV–Vis light irra-diation. Ceram. Int. 41, 2622–2625 (2015).
26. Kaneva, N. V., Dimitrov, D. T. & Dushkin, C. D. Effect of nickel doping on the photocatalytic activity of ZnO thin films under UV and visible light. Appl. Surf. Sci. 257, 8113–8120 (2011).
27. Ekambaram, S., Iikubo, Y. & Kudo, A. Combustion synthesis and photocatalytic properties of transition metal-incorporated ZnO.
J. Alloys Compd. 433(1–2), 237–240 (2007).
28. Mahmood, M. A., Baruah, S. & Dutta, J. Enhanced visible light photocatalysis by manganese doping or rapid crystallization with ZnO nanoparticles. Mater. Chem. Phys. 130, 531–535 (2011).
29. Ullah, R. & Dutta, J. Photocatalytic degradation of organic dyes with manganese-doped ZnO nanoparticles. J. Hazard. Mater. 156(1–3), 194–200 (2008).
30. Rajbongshia, B. M. & Samdarshi, S. K. ZnO and Co-ZnO nanorods—Complementary role of oxygen vacancy in photocatalytic activity of under UV and visible radiation flux. Mater. Sci. Eng. B 182, 21–28 (2014).
31. Xiao, Q., Zhang, J., Xiao, C. & Tan, X. Photocatalytic decolorization of methylene blue over Zn1-xCoxO under visible light irradia-tion. Mater. Sci. Eng. B 142(2–3), 121–125 (2007).
32. Fu, M. et al. Sol–gel preparation and enhanced photocatalytic performance of Cu-doped ZnO nanoparticles. Appl. Surf. Sci. 258(4), 1587–1591 (2011).
33. Kanade, K. G. et al. Self-assembled aligned Cu doped ZnO nanoparticles for photocatalytic hydrogen production under visible light irradiation. Mater. Chem. Phys. 102(1), 98–104 (2007).
36. Casas-Cabanas, M. et al. Defect Chemistry and Catalytic Activity of Nanosized Co3O4. Chem. Mater. 21(9), 1939–1947 (2009). 37. Li, X., Chen, Ch. & Zhao, J. Mechanism of photodecomposition of H2O2 on TiO2 surfaces under visible light irradiation. Langmuir
17(13), 4118–4122 (2001).
38. Wolski, L., Walkowiak, A. & Ziolek, M. Formation of reactive oxygen species upon interaction of Au/ZnO with H2O2 and their activity in methylene blue degradation. Catal. Today 333, 54–62 (2019).
39. Bahsi, Z. & Oral, A. Effect of Mn and Cu doping on the microstructures and optical properties of Sol-Gel derived ZnO thin films.
Opt. Mater. 29(6), 672–678 (2007).
40. Widiarti, N., Sae, J.K & Wahyuni, S.: Synthesis CuO-ZnO nanocomposite and its application as an antibacterial agent. IOP Conf.
Ser. Mater. Sci. Eng. 172, 012036 (2017).
41. Shohel, M., Miran, M. S., Susan, M. A. B. H. & Mollah, M. Y. A. Calcination temperature-dependent morphology of photocatalytic ZnO nanoparticles prepared by an electrochemical–thermal method. Res. Chem. Intermed. 42, 5281–5297 (2016).
42. Bloh, J. Z., Dillert, R. & Bahnemann, D. W. Transition metal-modified zinc oxides for UV and visible light photocatalysis. Environ.
Sci. Pollut. Res. 19(9), 3688–3695 (2012).
43. Ao, D. et al. Heterostructured NiO/ZnO nanorod arrays with significantly enhanced H2S sensing performance. Nanomaterials 9, 2–13 (2019).
44. Panchatcharam, P. Multilayer thin films—versatile applications for materials engineering. chapter: synthesis and characterization of CoO-ZnO-based nanocomposites for gas-sensing applications. https ://doi.org/10.5772/intec hopen .88760 (2020).
45. Widiarti, N., Sae, J. K. & Wahyuni, S. Synthesis CuO-ZnO nanocomposite and its application as an antibacterial agent. IOP Conf.
Ser. Mater. Sci. Eng. 172, 1–12 (2017).
46. Lousada, C. M., Johansson, A. J., Brinck, T. & Jonsson, M. Mechanism of H2O2 decomposition on transition metal oxide surfaces.
J. Phys. Chem. C 116, 9533–9543 (2012).
47. Salem, I. A. Catalytic decomposition of H2O2 over supported ZnO. Monatshefte für Chemie 131, 1139–1150 (2000). 48. Kotrly, S. & Sucha, L. Handbook of Chemical Equilibria in Analytical Chemistry 221 (Ellis Horwood, Chichester, 1985). 49. Devi, L. G., Kottam, N., Murthy, B. N. & Kumar, S. G. Enhanced photocatalytic activity of transition metal ions Mn2+, Ni2+ and
Zn2+ doped polycrystalline titania for the degradation of Aniline Blue under UV/solar light. J. Mol. Catal. A Chem. 328, 44–52 (2010).
50. Bundgaard, E. & Krebs, F. C. Low band gap polymers for organic photovoltaics. Solar Energy Mater. Solar Cells 91(11), 954–985 (2007).
51. Hirakawa, T. & Nosaka, Y. Properties of O2•- and OH• formed in TiO2 aqueous suspensions by photocatalytic reaction and the influence of H2O2 and some ions. Langmuir 18, 3247–3254 (2002).
52. Irie, H., Miura, S., Kamiya, K. & Hashimoto, K. Efficient visible light- sensitive photocatalysts: grafting Cu (II) ions onto TiO2 and WO3 photocatalysts. Chem. Phys. Lett. 457, 202–205 (2008).
53. Cho, J. M. et al. Effects of ultraviolet–ozone treatment on organic-stabilized ZnO nanoparticle-based electron transporting layers in inverted polymer solar cells. Organ. Electron. 15, 1942–1950 (2014).
54. Pati, S. S. et al. Facile approach to suppress γ-Fe2O3 to α-Fe2O3 phase transition beyond 600 °C in Fe3O4 nanoparticles. Mater. Res.
Exp. 2(4), 045003 (2015).
Acknowledgements
The director of this research, Beto Páez, passed away this July 12th. Beto was a researcher, full of ideas, super enthusiastic, super nice ... and in love. This paper is dedicated to the memory of Dr. Carlos Alberto (Beto) Páez (July 1974-July 2020).
Author contributions
A.E.R. and C.A.P. conceived and designed the experiments and analyzed the data. M.M., J.E.R. and J.A.C. char-acterized the optical properties of the samples. A.E.R. in collaboration with L.L.L. charchar-acterized the structure os samples by TEM, XRD, XRF. The manuscript was written by A.E.R. and C.A.P. with input from J.A.C. and B.H.
Funding
A. Ramírez acknowledges the financial support obtained from CNPq/CLAF (Fellowship for Postdoctoral Young Research Program), Belgian F.R.S.-FNRS and Universidad del Cauca (VRI ID-4737). C.A. Páez and B. Heinrichs thank the Belgian Fonds de la Recherche Fondamentale Collective (F.R.F.C), the Ministère de la Région Wallonne. JAHC thanks the Brazilian agencies CNPq (301455/2017-1, 443652/2018-0) and FAPDF (00193.0000151/2019-20) for the financial support.
Competing interests
The authors declare no competing interests.
Additional information
Correspondence and requests for materials should be addressed to A.E.R. Reprints and permissions information is available at www.nature.com/reprints.
Publisher’s note Springer Nature remains neutral with regard to jurisdictional claims in published maps and institutional affiliations.
Open Access This article is licensed under a Creative Commons Attribution 4.0 International License, which permits use, sharing, adaptation, distribution and reproduction in any medium or format, as long as you give appropriate credit to the original author(s) and the source, provide a link to the Creative Commons licence, and indicate if changes were made. The images or other third party material in this article are included in the article’s Creative Commons licence, unless indicated otherwise in a credit line to the material. If material is not included in the article’s Creative Commons licence and your intended use is not permitted by statutory regulation or exceeds the permitted use, you will need to obtain permission directly from the copyright holder. To view a copy of this licence, visit http://creat iveco mmons .org/licen ses/by/4.0/.