DOI:10.1051/0004-6361/201322119 c
ESO 2014
Astrophysics
&
Characterization of the gaseous companion
κ
Andromedae b
?
New Keck and LBTI high-contrast observations
??M. Bonnefoy
1, T. Currie
2, G.-D. Marleau
1, J. E. Schlieder
1, J. Wisniewski
3, J.Carson
4,1, K. R. Covey
5, T. Henning
1,
B. Biller
1, P. Hinz
6, H. Klahr
1, A. N. Marsh Boyer
7, N. Zimmerman
1, M. Janson
8, M. McElwain
9, C. Mordasini
1,
A. Skemer
6, V. Bailey
6, D. Defrère
6, C. Thalmann
10,1, M. Skrutskie
11, F. Allard
12, D. Homeier
12, M. Tamura
13,14,
M. Feldt
1, A. Cumming
15, C. Grady
9, W. Brandner
1, C. Helling
16, S. Witte
17, P. Hauschildt
17, R. Kandori
13,
M. Kuzuhara
13,18, M. Fukagawa
19, J. Kwon
13, T. Kudo
20, J. Hashimoto
13, N. Kusakabe
13, L. Abe
21, T. Brandt
8,
S. Egner
20, O. Guyon
20, Y. Hayano
20, M. Hayashi
13, S. Hayashi
20, K. Hodapp
18, M. Ishii
20, M. Iye
13, G. Knapp
8,
T. Matsuo
22, K. Mede
14, M. Miyama
23, J.-I. Morino
13, A. Moro-Martin
24, T. Nishimura
20, T. Pyo
20, E. Serabyn
25,
T. Suenaga
26, H. Suto
13, R. Suzuki
13, Takahashi
14, M. Takami
27, N. Takato
20, H. Terada
20, D. Tomono
20, E. Turner
8,28,
M. Watanabe
29, T. Yamada
30, H. Takami
13, and T. Usuda
20 (Affiliations can be found after the references)Received 21 June 2013/ Accepted 5 August 2013
ABSTRACT
Context.We previously reported the direct detection of a low-mass companion at a projected separation of 55 ± 2 AU around the B9-type star
κ Andromedae. The properties of the system (mass ratio, separation) make it a benchmark for understanding the formation and evolution of gas giant planets and brown dwarfs on wide orbits.
Aims.We present new angular differential imaging (ADI) images of the system at 2.146 (Ks), 3.776 (L0), 4.052 (N B_4.05), and 4.78 µm (M0)
obtained with Keck/NIRC2 and LBTI/LMIRCam, as well as more accurate near-infrared photometry of the star with the MIMIR instrument. We aim to determine the near-infrared spectral energy distribution of the companion and use it to characterize the object.
Methods. We used analysis methods adapted to ADI to extract the companion flux. We compared the photometry of the object to reference
young, and old objects and to a set of seven PHOENIX-based atmospheric models of cool objects accounting for the formation of dust. We used evolutionary models to derive mass estimates considering a wide range of plausible initial conditions. Finally, we used dedicated formation models to discuss the possible origin of the companion.
Results.We derive a more accurate J= 15.86 ± 0.21, H = 14.95 ± 0.13, Ks= 14.32 ± 0.09 mag for κ And b. We detect the companion in all our
high-contrast observations. We confirm previous contrasts obtained at Ksand L0band. We derive N B_4.05= 13.0 ± 0.2, and M0= 13.3 ± 0.3 mag and estimate log10(L/L )= −3.76 ± 0.06. Atmospheric models yield Teff= 1900+100−200K. They do not set any constraint on the surface gravity. “Hot-start” evolutionary models predict masses of 14+25−2 MJupbased on the luminosity and temperature estimates, and when considering a conservative age range for the system (30+120−10 Myr), “warm-start” evolutionary tracks constrain the mass to M ≥ 10 MJup.
Conclusions.The mass of κ Andromedae b mostly falls in the brown-dwarf regime, owing to remaining uncertainties in age and in mass-luminosity
models. According to the formation models, disk instability in a primordial disk may account for the position and a wide range of plausible masses of κ And b.
Key words.instrumentation: adaptive optics – techniques: photometric – planetary systems – stars: individual: kappa Andromedae
1. Introduction
During the past 15 years, radial velocity and transit surveys have provided a detailed inventory of the population of giant plan-ets within ∼3 AU around stars of different masses, ages, and metallicities (e.g.,Lagrange et al. 2009b; Johnson et al. 2011;
Sousa et al. 2011; Mortier et al. 2012; Bonfils et al. 2013; ? The LBT is an international collaboration among institutions in the United States, Italy, and Germany. LBT Corporation partners are: The University of Arizona on behalf of the Arizona university system; Instituto Nazionale di Astrofisica, Italy; LBT Beteiligungsgesellschaft, Germany, representing the Max-Planck Society, the Astrophysical Institute Potsdam, and Heidelberg University; The Ohio State University, and The Research Corporation, on behalf of the University of Notre Dame, University of Minnesota, and University of Virginia.
??
Appendices are available in electronic form at
http://www.aanda.org
Sato et al. 2013; Nowak et al. 2013, and references therein). Correlations between planet frequencies and the host-star metal-licity (Gonzalez 1997; Santos et al. 2001; Fischer & Valenti 2005;Sousa et al. 2011;Mortier et al. 2012), the host-star mass (Lovis & Mayor 2007; Bowler et al. 2010), and between the heavy-element content of gas giants with host-star metallicity (Guillot et al. 2006;Miller & Fortney 2011) favor the hypoth-esis of a formation by core accretion (CA;Pollack et al. 1996;
Mordasini et al. 2009a,b;Alibert et al. 2011; Mordasini et al. 2012a). Core accretion considers that a core of solids (ice, rock) forms through collisions of planetesimals in the protoplanetary disk at a distance of a few AU from the central star. Once the core has reached a critical mass (Mizuno 1980;Bodenheimer & Pollack 1986), its gravitational potential causes a rapid capture of the surrounding gas, which ultimately forms a massive gas envelope. Additional migration mechanisms have been proposed
(e.gLin & Papaloizou 1986;Alibert et al. 2004, and references therein) to explain the population of giant planets orbiting very close to their parent stars.
Conversely, high-contrast and high-angular resolution imag-ing is probimag-ing the population of wide-orbit (>5 AU) gaseous companions around a variety of young (age ≤ 300 Myr) and nearby (d ≤ 150 pc) stars, ranging from M dwarfs to early-type (F to B) stars (Neuhäuser et al. 2002;Chauvin et al. 2003;
Lowrance et al. 2005;Masciadri et al. 2005;Biller et al. 2007;
Kasper et al. 2007; Lafrenière et al. 2007a; Chauvin et al. 2010; Janson et al. 2011; Delorme et al. 2012; Bowler et al. 2012; Vigan et al. 2012; Rameau et al. 2013b; Nielsen et al. 2013). The majority of planetary mass companions have been discovered along an extended range of wide orbits (15 AU to several hundred AU) around low-mass (MGK) stars (e.g.,
Chauvin et al. 2004;Todorov et al. 2010;Lafrenière et al. 2010). The high-mass ratio with their host and the high separations makes the fragmentation of prestellar cores during collapse (e.g.,
Bate 2012) a candidate formation mechanism for these wide systems.
Low-mass (≤15 MJup) gaseous companions that have been
discovered more recently at moderate separations (≤100 AU) around the massive stars HR 8799 (Marois et al. 2008,2010) and β Pictoris (Lagrange et al. 2009a,2010) might represent a pre-viously unexplored population of gaseous companions (Vigan et al. 2012; Rameau et al. 2013b; Nielsen et al. 2013). The extended debris disks identified around these stars, shaped by the companions (Su et al. 2009; Lagrange et al. 2012a), sug-gest these systems emerged from a primordial gaseous disk. This picture is reinforced by recent resolved images of transi-tion disks around Herbig stars (Andrews et al. 2011; Rameau et al. 2012) with cavities that extend beyond the separations of the gaseous companions, and might have been carved by plan-ets (Casassus et al. 2013). Nevertheless, the subsequent forma-tion pathway remains unclear. Core accreforma-tion (CA) could even-tually explain the properties of directly imaged planets with the narrowest orbits (HR 8799 e and d, β Pictoris b; Kennedy & Kenyon 2008;Mordasini et al. 2009a; Rafikov 2011). But as-sociated CA formation timescales become too long compared to the mean lifetime of primordial disks and require higher disk surface density for an in-situ formation at more than ∼15 AU (Boley 2009;Dodson-Robinson et al. 2009). A revision of the way solids are accreted (Ormel & Klahr 2010) or additional out-ward migration mechanisms must be considered (Crida et al. 2009a; Kley & Nelson 2012, and references therein) to ex-plain planets found at larger radii if formed initially by CA. Gravitational instability within disks (G.I.; Cameron 1978) has been considered as an alternative mechanism for these objects (Boss 2011) and can also be associated with migration (e.g.,
Zhu et al. 2012) and ejection (e.g.,Vorobyov 2013). Here, pro-tostellar disks develop global instabilities (if cool enough) and fragment into bound clumps that contract to form giant planets. This mechanism operates on much shorter timescales than CA (a few orbital periods). However, recent surveys suggest it might not dominate at wide (>30 AU) separations (Janson et al. 2011,
2012; Rameau et al. 2013b). To conclude, it is not clear how these 8–78 AU companions relate to the more distant low-mass brown-dwarfs companions found around other massive (1.35– 2.5) young (age ≤ 150 Myr) stars (HR 7329B, HIP 78530B, HD 1160B, HR 6037BaBb, HD 23514B;Lowrance et al. 2000;
Lafrenière et al. 2011;Nielsen et al. 2012;Huélamo et al. 2010;
Nielsen et al. 2013;Rodriguez et al. 2012).
Direct imaging offers the possibility to collect multiple-band photometry and spectra emitted by the photospheric layers of
the companions in the near infrared (1–5 µm;McElwain et al. 2007; Currie et al. 2011; Bonnefoy et al. 2010, 2014). These data can provide a stringent characterization of the chemical (composition) and physical properties (mass, radius, effective temperature) of the sources, which are at the basis of our un-derstanding of their formation processes (Bonnefoy et al. 2013;
Konopacky et al. 2013). They can also give glimpses of the physics and chemistry at play in the cool and complex atmo-spheres of the sources (e.g.,Currie et al. 2011; Skemer et al. 2012;Bonnefoy et al. 2014). The peculiar near-infrared spectro-photometric properties of the companions are now better under-stood as a consequence of the low temperature and surface grav-ity atmosphere, which in some cases can lead to the formation of thick layers of dust and/or trigger non-equilibrium chemistry (Janson et al. 2010;Skemer et al. 2011;Barman et al. 2011a,b;
Madhusudhan et al. 2011;Currie et al. 2011;Skemer et al. 2012;
Marley et al. 2012;Faherty et al. 2013).
In the course of the Strategic Explorations of Exoplanets and Disks with Subaru (SEEDS,Tamura 2009), we identified a low-mass companion in early-2012 at a projected separation of 100 around the massive (2.5 ± 0.1 M
) B9 IVn (Garrison &
Gray 1994) and nearby (51.6 ± 0.5 pc, van Leeuwen 2007) star κ Andromedae (hereafter κ And,Carson et al. 2013). The host-star kinematics make it a member (Zuckerman et al. 2011;
Malo et al. 2013; Carson et al. 2013) of the ∼30 Myr old Columba moving group with a high probability (Torres et al. 2008). At these ages, we estimated that κ And b has a mass of 12.8+2.0−1.0MJup, making it the first planetary/brown-dwarf
com-panion directly imaged around such a massive star.
However, the mass estimate of κ And b relied on the near-infrared photometry of the star, derived from 2MASS images (Cutri et al. 2003) where κ And A is saturated. More importantly, it was derived from predictions of the so-called “hot-start” evo-lutionary models, which assume that the object starts its evolu-tion following a spherical collapse from an arbitrary large ini-tial radius (Burrows et al. 1997; Chabrier et al. 2000; Baraffe et al. 2003). The alternative “cold-start” models (Marley et al. 2007;Spiegel & Burrows 2012;Mordasini et al. 2012b) hypo-thetize that the gaseous material accreted onto planet embryo passes through a super-critical accretion shock and loses all its gravitational energy, therefore leading to objects with low initial entropies (Sinit). As a consequence, these models predict lower
temperatures and lower luminosities at young ages (.100 Myr) than “hot-start” evolutionary models for a given objet. The more recent “warm-start” models (Spiegel & Burrows 2012;Marleau & Cumming 2014) generalize the previous cases by exploring the impact of initial conditions on the cooling curves through the choice of the initial entropy (Sinit) of the object. With these
models, joint constraints on the mass and initial entropy of companions can be derived from a brightness and temperature measurement.
We present new high-contrast near infrared images of κ And b obtained using NIRC2 at the W.M. Keck Observatory and LMIRCam on the Large Binocular Telescope Interferometer (LBTI) at 2.146 (Ks), 3.776 (L0), 4.052 (N B_4.05) and 4.78 µm
(M0). They confirm and complement the current set of
photomet-ric data of the companion. We also present additional unresolved observations of the system in the near-infrared. Unresolved ob-servations provide accurate photometry of the primary star and, as a consequence, of the companion from 1 to 2.5 µm, at wave-lengths where the effect of atmospheric dust can be studied. Altogether, they enable us to refine the companion properties and discuss its formation mechanism.
Table 1. Log for the new high-contrast observations of κ Andromedae.
Date Instrument Band DIT NDIT Nexp Parallactic angle/start Parralactic angle/end Remarks
(s) (◦
) (◦
)
2012/10/06 LMIRCam M 0.757 30 87 177.49 123.54 Saturated exposures
2012/10/06 LMIRCam M 0.029 4 36 165.97 124.98 Unsaturated exposures
2012/10/30 NIRC2 L0 0.3 70 30 160.92 153.58 2012/10/30 NIRC2 L0 0.3 70 30 140.35 134.46 2012/11/03 NIRC2 N B_4.05 0.3 100 10 163.14 159.94 2012/11/03 NIRC2 Ks 5 3 15 155.27 151.92 2012/11/03 NIRC2 N B_4.05 0.3 100 30 144.95 137.40 2012/11/03 NIRC2 Ks 5 3 15 133.43 131.58
This paper is organized as follows. We describe the observa-tions and the related analysis of the data in Sect.2, and present our main results in Sect.3. Section3is split into four subsec-tions. We first rederive a more conservative age estimate for the system in Sect.3.1. We compare the photometry of κ And b to empirical reference objects in Sect.3.2, and to atmospheric mod-els in Sect. 3.3. We give new mass estimates based on “hot”, “cold”, and “warm-start” evolutionary models in Sect.3.4. We discuss the properties of κ And b and review the possible forma-tion scenarios in Sect.4.
2. Observation and data reduction
2.1. Seeing-limited observations
The accuracy of κ And b near infrared photometry (J = 16.3 ± 0.3, H = 15.2 ± 0.2, Ks= 14.6 ± 0.4) reported in Carson
et al.(2013) was predominantly limited by the accuracy of the 2MASS photometry of the star (the only near-infrared photom-etry publicly available at that time; Table 2). The low accu-racy arises from the strong saturation of the star in the 2MASS images1.
We obtained infrared photometry of κ And A in the J, H, and Ks filters using the MIMIR instrument (Clemens et al. 2007),
mounted on the 1.8m Perkins telescope at Lowell Observatory, on 2012 October 30. At the f/5 focus, the 1024 × 1024 Aladdin array covered a field of view (FOV) of 10 × 10 arcmin with a pixel scale of 0.00579 pixel−1. Standard bias, dark, flat field, and
sky corrections were applied to all data using calibration data obtained during the night. Five 0.1s exposures were obtained at each of six dither positions separated by ∼60 arcsec in every filter. Owing to the brightness of our science target, we defo-cused the telescope until stars took the appearance of ∼60 arcsec wide donuts. Our observations of κ And A were bracketed by ob-servations of HR 8962, using the same exposure time and focus settings, to enable us to determine the photometric zeropoint.
Photometry was determined using apertures with a radius of 70 pixels and a 10-pixel wide background sky annulus starting at a radius of 80 pixels from each centroid position. Our final photometry was computed from ten data frames (2 dither posi-tions) in which our large apertures did not intersect with known regions of bad pixel clusters in the array. We determined the ze-ropoint for our observations by comparing our measured pho-tometry for HR 8962 against published 2MASS values (Cutri et al. 2003). HR 8962 is known to be a visual binary (see e.g.,
Morlet et al. 2002; Hartkopf & Mason 2009) whose separa-tion of 0.005 fits within both our aperture definition and the aperture definition of 2MASS, and thus should not affect our 1 The saturation can be seen directly on the 2MASS images:http:
//irsa.ipac.caltech.edu/cgi-bin/2MASS/IM/nph-im_pos
Table 2. Near-infrared photometry of κ And A.
Epoch J H Ks Ref.
29/10/1998 4.62 ± 0.27 4.60 ± 0.22 4.57 ± 0.36 1 30/10/2012 4.26 ± 0.04 4.31 ± 0.05 4.32 ± 0.05 2 References. [1] 2MASS/Cutri et al.(2003); [2] this work.
zero-point determination. The photometry we determined for 2MASS J23373296+4423122, another bright object in the FOV of our HR 8962 data, was within 2σ of published 2MASS photometry for the source, thereby confirming our zeropoint determination.
Aperture photometry on the source and of the photo-metric reference yields J= 4.26 ± 0.04, H = 4.31 ± 0.05, and Ks= 4.32 ± 0.05 mag for κ And A (see also Table2). We find
negligible photometric shifts (≤0.004 mag) between MIMIR and HiCIAO photometric systems using the corresponding filter passbands, a flux-calibrated spectrum of Vega (Bohlin 2007) and of a B9 star from the Pickles (1998) library. This enables us to revise the original photometry of κ And b (Carson et al. 2013) to J= 15.86 ± 0.21, H = 14.95 ± 0.13, and Ks= 14.32 ± 0.09 mag.
2.2. High-resolution spectroscopy
We obtained an R ∼ 31 500 optical (∼3600–10 000Å) spec-trum of κ And A on UT 2012 October 24 with the ARC Echelle Spectrograph (ARCES,Wang et al. 2003) mounted on the Apache Point Observatory (APO) 3.5 m telescope. The spec-trum was obtained using the default 1.006 × 3.002 slit and an expo-sure time of 45 s. A ThAr lamp expoexpo-sure was obtained after the integration to facilitate accurate wavelength calibration. The data were reduced using standard IRAF techniques. We used this spectrum to derive new estimates of the surface gravity and ef-fective temperature of the star. Our results and method are de-tailed in Sect.3and AppendixB.
2.3. High-contrast observations 2.3.1. Keck/NIRC2
We observed κ Andromedae on 2012 October 30 and 2012 November 3 with the NIRC2 camera fed by the adaptive optics system of Keck II (van Dam et al. 2004). We used the Ks (λc= 2.16 µm) and L0 (λc= 3.78 µm) broadband
fil-ters and the Brα (λc= 4.05 µm) narrow-band filter (hereafter
N B_4.05, Table 1). All data were taken in the narrow cam-era mode (9.952 mas pixel−1, Yelda et al. 2010) in either
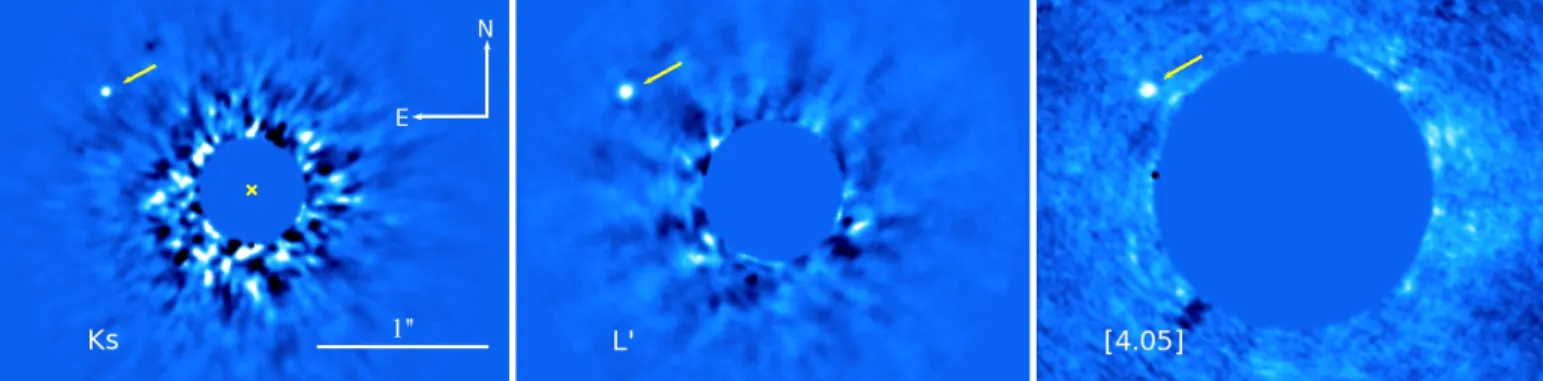
Fig. 1. Reduced Keck/NIRC2 images at Ks/2.16 µm (left), L0/3.78 µm (middle), and NB_4.05 (right) of κ And showing the detection of the companion κ And b. We adjust the image color scale such that the white region identifying κ And b (pointed to by an arrow) roughly covers an area equal to the image FWHM. The cross identifies the stellar centroid position in the Ksdata and is at the same point in all three images.
multicorrelated double sampling (Ks) or correlated double
sam-pling (L0, N B_4.05). Observing conditions both nights were
photometric with above-average seeing (FWHMnatural ∼ 0.004–
0.005) and average AO performance. In all cases, we used the
“large hex” pupil plane mask.
The Ks data were taken through the partially transmissive
0.006-diameter coronagraphic mask in coadded 15 s exposures.
The L0 data were taken in coadded 20-s exposures with the primary star’s point-spread function (PSF) core saturated. We dithered the star off of the detector to obtain sky frames in the middle of our observing sequence. For the N B_4.05 data, the PSF core was unsaturated, and we took three sequences of ten science frames followed by 5 sky frames (texp= 30 s).
All data were taken in “vertical angle” or angular di ffer-ential imaging mode (Marois et al. 2006). On both nights, we observed κ And immediately after unsaturated observations of HR 8799, which is at a similar right ascension, beginning at an hour angle of ∼0.5. These unsaturated observations were later used to derive the photometry of κ And b (see below). Still, over the course of our sequence, we achieved ∼24–26◦ of field
rota-tion, or ≈5–10 λ/D at the angular separation of κ And b. Basic image processing followed standard steps previously used to process NIRC2 data (Currie et al. 2012b,c). Briefly, for the Ks data, we employed standard dark subtraction and
flat-fielding corrections, identified and interpolated over hot/cold pixels. For the thermal IR data, we subtracted off a median-combined sky image comprised of sky frames taken closest in time to the science frames of interest. For all data sets, we ap-plied the distortion correction from Yelda et al. (2010). After copying each image into a larger blank image, we performed im-age registration by finding the stellar centroid position (Ksand
N B_4.05) directly or estimating it by cross-correlating the first image in our sequence by a 180◦rotation of itself (L0). We then determined the relative offsets for other images in the sequence by solving for the peak in the cross-correlation function between the first (reference) image and all subsequent images.
To extract a detection of κ And b, we used the A-LOCI pipeline described in Currie et al.(2012a). Because κ And b is at a wide separation (ρ = 1.0005) and previous data obtained at
similar wavelengths yielded very high signal-to-noise ratio (S/N) detections, we adopted conservative algorithm settings that min-imally bias the planet flux. This included a large rotation gap (δ = 0.8–1.5), a high cross-correlation cutoff for the contrast-limited Ksand L0data (corrlim= 0.9–0.95), and a lower cutoff for
the background-limited N B_4.05 data (corrlim= 0.2) and a
mov-ing pixel mask (Currie et al. 2012a), yielding planet throughputs
(estimated by implanting synthetic point sources into registered images) ranging between 0.92 and 1.
Figure1shows the final Keck/NIRC2 images, where we de-tect κ And b at a S/N of 30, 20, and 7 at Ks, L0, and N B_4.05.
Exterior to our inner working angle of 0.003, we do not detect any other point sources, as was the case with previous H, Ks,
and L0data (Carson et al. 2013). To measure the brightness of κ And b, we performed aperture photometry with a diameter roughly equal to the image FWHM (∼5–10 pixels), correcting for the very minor throughput loss induced by our processing. To flux calibrate κ And b in mKs, we used the derived
coro-nagraph spot extinction from Currie et al. (2012b) of 6.91 ± 0.15 mag. This yielded a parent/companion contrast of ∆m = 10.04 ± 0.15 mag. Using our MIMIR photometry, this translates into a companion brightness of mKs = 14.36 ± 0.15. For the
L0, we used the unsaturated images of HR 8799 A (mN B_4.05 '
mL0 = 5.220 ± 0.018; Marois et al. 2008) to flux-calibrate
κ And b, deriving mL0 = 13.13 ± 0.07. Finally, for the NB_4.05
data, both HR 8799 A and κ And A were unsaturated. Assuming
mL0' mN B_4.05, we then derive mN B_4.05= mL0= 4.32 ± 0.05 for
κ And A and mN B_4.05= 13.0 ± 0.2 for κ And b.
We measure a separation of ρ= 1.029 ± 0.00500and a posi-tion angle of θ= 55.3 ± 0.3◦in the K
sband images. This value
agrees with the astrometry derived from IRCS (ρ = 1.04400,
θ = 55.2) and HiCIAO data presented byCarson et al.(2013). We nevertheless refrained from making an updated proper mo-tion analysis, owing to possible systematic offsets on ρ and θ introduced by the instrument change.
2.3.2. LBTI/LMIRCam
We observed κ And with the LMIRCam near-infrared camera (Hinz et al. 2008; Skrutskie et al. 2010) at the LBTI on 2012 October 10. The LBTI was operated in single-aperture mode in order to avoid the extraoverheads associated with the align-ment of the telescope beams. The whole telescope+instrument set does not have a derotator. Therefore, it automatically oper-ates in a mode that enables passive angular differential imag-ing (Marois et al. 2006). We obtained 151 frames consisting of 30 × 0.758 s coadded exposures each with an M0-band filter
(λc = 4.78 µm, FWHM = 0.37 µm). The integration time was
chosen in order to saturate the core of the stellar PSF to a ra-dius of 110 mas. The 1 h 45 min spent on the target produced a field rotation of 53.9◦. The source was nodded in the
instru-ment FOV (1.800nod) every 3 mins to properly remove the back-ground contribution. We recorded four frames corresponding to eight 0.029 s coadded exposures following each telescope nod.
These unsaturated exposures monitored the evolution of the PSF during the observing sequence and were used to derive the con-trast ratio of the system components.
Data were reduced with the MPIA-LBTI angular di fferen-tial imaging pipeline. The pipeline carried out all the basic cos-metics steps (removal of detector stripes, sky subtraction, bad pixel interpolation) following the selection of pairs of nodded exposures. The position of the source in the resulting images was found using a bidimensional Moffat fitting function. Images were recentered and placed in a master cube of frames using sub-pixel shifts. We selected 87 frames with high Strehl ratio or high-throughput to build a final master cube. We applied six algo-rithms to estimate and remove the flux distribution of the star in each input frame of the master cube. We removed a radial profile in each image, derotated them in order to re-align them with the north using the parallactic angle at the time of the exposure (non-ADI, or NADI), and median-combined these frames to produce a final residual image. Alternatively, we built and removed the PSF of the star taking the median of all input frames contained in the cube (classical ADI, or CADI). We also applied the RADI (Marois et al. 2006;Chauvin et al. 2012), LOCI (Lafrenière et al. 2007b), and a custom algorithm based on principal-component analysis (Zimmerman et al., in prep; see also Soummer et al. 2012;Amara & Quanz 2012).
We also developed and applied an extension of the RADI algorithm, called “correlated radial ADI” (or CODI), in order to optimize the reduction of these data. Each cube image i was first divided into concentric annuli. For each annuli ANi, we
se-lected N reference annuli ANrefk=1−N taken from other images
contained in the cube for which the companion has moved by n × FWHM. We computed and sorted the correlation factors between the N reference annuli and the processed annuli. We selected the α (∈N) most correlated reference annuli ANrefk=1−α
and retrieved the coefficients of the linear relation between pix-els of the reference annuli and of the processed annuli ANi =
ak,i× ANrefk + bk,i(with ak,iand bk,i ∈ R derived from a linear
regression and a matrix inversion). This way, we were able to ac-count simultaneously for any variation in the atmospheric trans-mission and in a piston flux offset (e.g., residuals from the back-ground subtraction, etc.) between the reference and processed annuli. The α model annuli were median-combined to create a final model ANmodelof ANi. The operation was repeated for each
concentric annuli and each cube image. We considered a separa-tion criterium of 1.5 FWHM at the separasepara-tion of the companion for the CADI, RADI, CODI, LOCI, and PCA-based analyses.
The source κ And b is detected in each individual input frame. It is then naturally retrieved in all post-processed frames with a S/N from 20 to 38 reached with the RADI and CADI algorithm, respectively (see Fig. 2). We integrated the flux of κ And b over an aperture of 16 pixels in radius (1.5 FWHM) and used the non-saturated exposures to derive the contrast ra-tio between the star and its companion. Values were corrected from the inevitable flux losses associated to angular differential imaging using 3 fake planets injected at position angles of –67◦,
115◦, and 233◦.
All algorithms converge to a contrast of∆M0= 8.9±0.3 mag for κ And b. The variation of the PSF in unsaturated exposures dominates the final error budget. We estimate that κ And A has a M-band magnitude of 4.4 mag considering the mean Ks− M
col-ors of B9 (IV-V) stars of the van der Bliek et al.(1996) and IRTF (Leggett et al. 2003) catalogs (Ks− M= −0.023 ± 0.030).
We also find a similar color (Ks− M= −0.023 ± 0.006) using
ATLAS9 models (Castelli et al. 1997) taken at the temperature of the star (see Sect.3.1and AppendixB), the Ks, and M0band
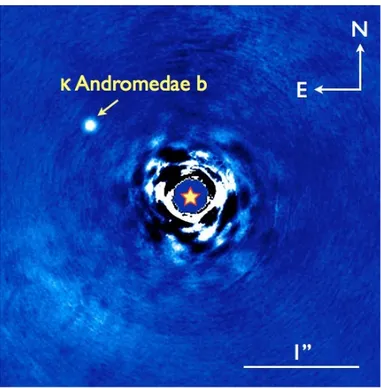
Fig. 2.LBTI/LMIRCam high-contrast image of the κ And system at
Mband. The companion is recovered.
filter transmission curves. These colors can be used as a reason-able guess for κ And A because of the lack of excess emission for this star at these wavelengths (see Sect.3.1). Therefore, we derive M0= 13.3 ± 0.3 mag κ And b.
We did not get observations of any astrometric field needed to derive a reliable astrometry from these data.
3. Analysis and results
3.1. Re-evaluation of the system age
The masses of κ And A and its companion, and insight into the companion’s origin, are tied to the correct determination of the system age. For this reason, we investigated the various age in-dicators available for κ And A again based on our new measure-ments of the star and material found in the literature.
Carson et al. (2013) suggest a possible age range of 20– 120 Myr and a nominal age of ∼30 Myr, for the system based on the kinematics and color–magnitude diagram (CMD) position of κ And A. Their kinematic study was based on theMalo et al.
(2013) online tool2, which computes probabilities of
member-ship in the TW Hydrae, Tucana-Horologium, Columba, Carina, and Argus associations, the β Pictoris and AB Doradus moving groups, and the field population using Bayesian methods. We found 95.6%, 0.7%, and 3.8% chances that κ And belongs to Columba, β Pictoris, and the field, respectively. The star has a 0% probability of belonging to the remaining groups. The same tool applied to HR 8799 yields 98.1%, 0.7%, and 1.1% probabil-ities for Columba, β Pictoris, and the field. Recently,Baines et al.
(2012) have put independent constraints on the age of HR 8799 that are consistent with the high probability of Columba mem-bership derived using this tool.
One might argue that theMalo et al.(2013) Bayesian anal-ysis tool assumes κ And is a member of Columba in the priors of the calculation. This will artificially inflate the probability of 2 http://www.astro.umontreal.ca/~malo/banyan.php
Table 3. Best-fit atmospheric parameters for κ And b.
Atmospheric model Teff log g R χ2
(K) (cm s−2) (R Jup) AMES-Dusty 1900 4.5 1.25 7.53 AMES-Cond 1700 3.5 1.47 32.02 BT-Settl 2010 2000 5.5 1.18 10.25 BT-Cond 2012 1800 4.0 1.34 33.55 BT-Dusty 2012a 1800 4.5 1.65 14.10 BT-Settl 2012 [M/H] = 0.0 1900 4.0 1.26 12.05 BT-Settl 2012 [M/H] = +0.5 1900 4.0 1.24 12.59 DRIFT-P. [M/H] = 0.0 2000 3.5 1.13 13.29 DRIFT-P. [M/H] = +0.5 1900 3.5 1.16 12.35 DRIFT-P. [M/H] = –0.5 1900 3.5 1.16 16.42 Notes.(a)Analysis limited to log g ≥ 4.5.
group membership since the star’s kinematics are being partly used to define those of the group. An independent analysis of the κ And’s UVW space velocities shows that they are consistent with other proposed group members with measured parallaxes at the <2σ level. κ And’s X and Z Galactic distances are also completely consistent with those of the previously mentioned members with well constrained distances. The star’s Galactic Y distance (46.5 pc) however, falls above the mean value for Columba’s bona fide members (–26.3 pc; using Table 3 ofMalo et al. 2013, and removing κ And from the sample). While dis-crepant from the group members originally proposed inTorres et al. (2008), this is consistent with other proposed Columba members fromZuckerman et al.(2011) that lie at northern de-clinations. Additionally, the dispersion in Y values for proposed members is large (26.5 pc) and might be underestimated since few surveys have searched for new members in the north. Thus, there are several lines of evidence that support κ And’s kine-matic membership in the proposed Columba association. A full kinematic traceback study of proposed Columba group members may shed more light on κ And’s reliability as a member and the past history of the association as a whole (e.g.,Ortega et al. 2007;Makarov 2007;Weinberger et al. 2013). Since consistent kinematics are a necessary but not sufficient criterion for moving group membership, we investigate the age of κ And using several different methods that are independent of its kinematics.
The existence of excess IR flux in the spectral energy distri-bution (SED) of κ And A indicates remnant, circumstellar ma-terial (a debris disk) and may place constraints on its age (see discussions in Wyatt 2008). To construct κ And A’s SED, we used the Virtual Observatory (VO) SED Analyzer (VOSA,Bayo et al. 2008)3. This tool allows the user to use both publicly avail-able and user-provided data to construct the SED of a source and fit it with their choice of model. We queried photometric catalogs available through the VO to compile a complete SED of κ And A. We recovered data from ∼0.13 to 100 µm from the following sources: the International Ultraviolet Explorer (IUE,
Boggess et al. 1978), A catalog of compiled UBV photome-try (Mermilliod & Mermilliod 1994), the Tycho-2 catalog (Høg et al. 2000), the 2MASS All-Sky Point Source Catalog (Cutri et al. 2003), the WISE All-Sky Data Release (Cutri & et al. 2012;
Wright et al. 2010), the AKARI/IRC mid-IR all-sky Survey (Ishihara et al. 2010), and the IRAS Catalog of Point Sources, Version 2.0 (Helou & Walker 1988). Not all of the recovered data were useful for constructing the SED. As mentioned in Sect. 2.1, the 2MASS photometry of κ And A is saturated, so we replaced 3 http://svo2.cab.inta-csic.es/theory/vosa/
it with our new determinations of the JHKs photometry. The
WISE W1 and W2 data were also beyond the saturation limit listed in the Explanatory Supplement4, so we did not include these points in the construction of the SED. The IRAS 25, 60, and 100 µm data are listed as upper limits, so that they were also not used. To supplement the SED, we also checked for ad-ditional mid-IR data in the Spitzer and Herschel archives (not queried by the VO). The star was not observed by either tele-scope. We therefore used the VOSA to perform a χ2 fit of an
ATLAS9 model (Castelli et al. 1997) to the remaining reliable photometric data.
The SED fit reveals no significant excess above the ex-pected photospheric flux in an 11 000 K model out to 22 µm. Unfortunately, this imposes no constraint on the age of κ And A.
Wyatt (2008) shows the evolution of 24 and 70 µm excess in A-type stars (a reasonable proxy for κ And’s B9 type) with ages up to 800 Myr (his Fig. 6). The fraction of stars with measured excess is a function of age. However, more than half of the stars observed at 24 µm have no detectable excess. Even at 70 µm, not all of the young targets presented inWyatt (2008) exhibit excesses. Thus, longer wavelength observations (>22 µm) may still reveal IR excess in the SED of κ And A, but the absence of excess in the current data does not provide useful information regarding its age.
The star κ And A is the earliest-type (B9) proposed member of the Columba association. The ages of later-type stars in the association are well constrained by a combination of CMD po-sitions and lithium depletion. These diagnostics indicate an association age of ∼30 MyrTorres et al.(2008). Age determi-nations like lithium depletion are not applicable to young, early-type stars. Therefore, to constrain κ And’s age independently of its kinematics, we rely on HR diagrams and model compar-isons. We first place κ And A in an Mvvs. B − V CMD to criti-cally compare its position to those of early-type members of sev-eral young, open clusters with well defined ages (see Fig.3and AppendixA). κ And’s CMD position is consistent with similarly typed members of the Scorpius-Centaurus subgroups (ScoCen, 11–17 Myr,Chen et al. 2012) and the Pleiades (130 ± 20 Myr,
Barrado y Navascués et al. 2004). There are no members of the IC 2391 cluster (30–50 Myr,Barrado y Navascués et al. 2004;
De Silva et al. 2013) with CMD placement in the immediate vicinity of κ And, however the approximate shape of the cluster sequence would place them close. κ And A is clearly younger than the ∼500 Myr Ursa Majoris moving group (King et al. 2003), where the earliest type stars are much more evolved. The other proposed members of young moving groups (Malo et al. 2013) occupy small regions of color space and exhibit signif-icant scatter in the CMD, therefore comparison to them cannot effectively constrain the star’s age. The sample of ScoCen stars is also scattered. This may be partly attributed to large distance un-certainties. This aspect of the comparison sample may skew the interpretation of κ And’s age to younger values. Thus, while the CMD position of κ And is consistent with populations of stars at several different ages, we infer that the star’s placement is most consistent with the Pleiades. We also compare the CMD posi-tions of the stars to the rotating models (V/Vcrit = 0.4 at the
zero-age main-sequence) ofEkström et al.(2012). The models reproduce the distribution of A-type stars on the main-sequence, but they deviate from the known ages of stars that are begin-ning to evolve to redder colors. For example, B-type IC 2391 and Pleiades members are approximately coincident with the 4 http://wise2.ipac.caltech.edu/docs/release/allsky/
Fig. 3.Position of κ And A in a color–magnitude diagram (CMD) com-pared to other A and B-type members of the Pleiades, the IC 2391 clus-ter, Scorpius-Centaurus (ScoCen), Ursa Majoris group, and other young moving groups in the solar neighborhood (see legend). The star’s posi-tion in the diagram is consistent with some members of all the plotted samples except the Ursa Majoris moving group (UMa), which is clearly older and more evolved. The placement in the CMD suggests that κ And is not much older than the upper limit of the Pleiades, 150 Myr. The dash-dotted lines areEkström et al.(2012) tracks that include rotation. These models predict an age of.250 Myr for κ And, but they overesti-mate the ages of B-type cluster members. The dotted lines are 5th-order polynomial fits to the Pleiades and IC 2391 sequences and are shown to highlight them for clarity.
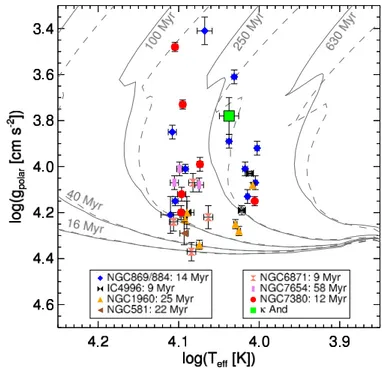
100–160 Myr and 160–250 Myr isochrones, respectively. The age of κ And is predicted to be.250 Myr. However, since mem-ber ages of well-defined clusters are overestimated by the mod-els, we do not use them to place limits on the age of κ And. Rather, we use the comparison to the empirical Pleiades se-quence to suggest an upper age limit of ∼150 Myr for the system. We have also made new estimates of the atmospheric param-eters of κ And A (see the details in AppendixB) and compared these values to the tracks of Ekström et al.(2012) in both the rotating and non-rotating cases. Figure 4 shows our measured polar surface gravity and effective temperature for the star (see Table 6). The polar surface gravity is a correction to the mea-sured surface gravity that accounts for the rapid rotation of κ And (vsini = 130–190 km s−1,Huang & Gies 2006;Glebocki et al.
2000;Abt et al. 2002;Fitzpatrick & Massa 2005). We also plot the same parameters for samples of mid to late-B type stars in other young clusters with ages ∼ 10–60 Myr (Huang et al. 2010;
Marsh Boyer et al. 2012). The models predict an age&250 Myr for κ And. However, they systematically overestimate the ages of all but a few of the cluster members. There is also large scatter in the estimated polar gravity of stars within the same cluster. We interpret these features as indicating that placement in this kind of diagram does not provide a meaningful constraint on the age of κ And. The figure also illustrates the inherent difficulty in ac-curately measuring atmospheric parameters of young, early-type stars.
Fig. 4. Position of κ And A in a temperature-gravity diagram com-pared to the models ofEkström et al.(2012) for rotating (solid lines; V/Vcrit = 0.4 when stars reach the zero-age main-sequence) and non-rotating (dashed limes). We also show the same parameters for similarly typed members of young clusters (see legend).
The age suggested by the empirical CMD is moderately older than that suggested by Columba moving group member-ship (30+20−10 Myr,Marois et al. 2010) and used byCarson et al.
(2013). Unresolved binarity of the star might reconcile the age estimated following these two approaches. Future monitoring of the radial velocity or observations at higher angular resolution (i.e., sparse aperture masking) may be able to constrain this hy-pothesis. Our high-resolution spectrum does not resolve κ And as a tight binary. However, if it were a binary, and the period were long enough, the radial velocity amplitude between resolved component lines could be overshadowed by rotational broaden-ing in the spectrum. Another possible explanation is large intrin-sic scatter in the observed parameters of early-type stars from the effects of inclination and rapid rotation. When a star rotates rapidly, centrifugal force leads to a deformation of the photo-sphere, and thus a surface gravity gradient, between the equator and poles. This gives rise to a temperature gradient across the ob-served stellar surface where the equator is cooler than the pole. This is known as “gravity darkening” (von Zeipel 1924;Huang & Gies 2006, and references therein). Consequently, the mea-sured temperature, surface gravity, and other observables are de-pendent on the viewing angle of the rotation axis with respect to the observer. The end result of these intrinsic effects in early-type stars is that positions in diagrams comparing observed param-eters (e.g., temperature-gravity, temperature-luminosity, color– magnitude) are degenerate in mass, age, and rotation.
Evidence of these effects has been directly observed in inter-ferometric and spectroscopic measurements of the B7V/B8IV star Regulus (α Leo, McAlister et al. 2005; Che et al. 2011). The authors find the star is observed edge on and has v sin i ≈ 320 km s−1. This combination of rotation and inclination angle lead to an observed >3000 K temperature gradient between the pole and equator. As a result, the true luminosity of the star is higher than estimated from photometry. Once the effects of rota-tion and inclinarota-tion are taken into account, the HR diagram age
Fig. 5.κ And b (magenta dot) in color–color diagrams compared to known MLTY field dwarfs and brown-dwarfs, and young directly imaged
companions. The photometry of young companions is found inBonnefoy et al.(2013,2014) (and references therein),Nielsen et al.(2012), and
Delorme et al.(2013). The photometry of MLTY field dwarfs is taken fromLeggett et al.(2010,2013).
of Regulus is reduced by nearly 100 Myr (Che et al. 2011). These results may help to reconcile the previously estimated age di ffer-ence between Regulus and its ∼176.00K2V companion.Gerbaldi et al. (2001) estimate ages for the primary and secondary of 150 Myr and 30–50 Myr, respectively, from model luminosity-temperature diagrams.Gies et al.(2008) also discovered a low-mass, short-period (∼40 days) companion to Regulus using long term radial velocity monitoring. They propose that the compan-ion is either a white dwarf or an M dwarf. If the compancompan-ion is a white dwarf, correct age determination of the system becomes more difficult because the evolution of the progenitor must be considered (Rappaport et al. 2009). These deep investigations of the Regulus system may shed light on the observed scatter in samples of known age in Figs.3and4. The estimated v sin i of κ And is not as large as that of Regulus, but the previous example highlights that rotation/inclination induced effects on the mea-sured physical parameters may be significant enougth to change the age interpretation. Further examples of interferometric stud-ies of rotating, early-type stars and discussions of how new data led to revised understandings of long studied stars can be found invan Belle(2012, and references therein).
Future observations of κ And and its companion will pro-vide the means to refine the system age. The proximity and luminosity of κ And make it amenable to a full interferomet-ric analysis where the measured radius, oblateness, and incli-nation can place strong constraints on its evolutionary status (van Belle 2012). Additionally, direct spectroscopic observa-tions of κ And b should allow for independent age constraints via gravity sensitive features. In the absence of further obser-vations, we use in the subsequent analyses 1/ an age for the κ And system based on the proposed kinematic membership to the Columba association (30+20−10 Myr); 2/ a more conservative age range – 30+120−10 Myr – defined by the lower age limit from kinematics and the upper age limit from the empirical CMD.
3.2. Comparison ofκ And b to reference objects
We first used the photometry of κ And b derived in Sect. 2
to study the companion location in color–color (Fig. 5) and color–magnitude diagrams (Fig. 6). The new J, H, Ks
-band based colors of κ Andromeda b are close to those of other late-M to mid-L class companions: USCO CTIO 108B
Fig. 6.Position of κ And b (magenta dot) in a color–magnitude diagram based on an improved near-infrared photometry.
(M9.5,Béjar et al. 2008), 2MASS J01033563-5515561(AB)b (Delorme et al. 2013), GSC 06214-00210 b (L0, Ireland et al. 2011), AB Pic b (L0, Bonnefoy et al. 2014), β Pictoris b (∼L2, Bonnefoy et al. 2013), 1RXS J160929.1-210524b (L4,
Lafrenière et al. 2008), CD-35 2722B (L4,Wahhaj et al. 2011). These colors are also similar to those of young L0-L3 dwarfs (Lγ dwarfs, Kirkpatrick 2005) listed by Faherty et al. (2013)
and of field L dwarfs with the availiable 2MASS photometry listed inBurgasser et al.(2006),Reid et al.(2008), andDupuy & Liu (2012). The companion still lies close to GSC 06214-00210 b and to L4-L6 dwarfs in Ks− L0vs. J − Ksand Ks− L0
vs. H − Ks diagrams. The companion colors are intermediate
between those of 1RXS J160929.1-210524b and AB Pic b in these diagrams. κ And falls midway between the sequence of field dwarfs and of the 3−11 Myr old companion GSC 06214-00210 b in a Ks− L0vs. L0− M0diagram. GSC 06214-00210 b
Fig. 7.κ And b spectral energy distribution (magenta dots) compared to
the mean spectral energy distribution of young M8-L0 dwarfs (Luhman et al. 2010) and of L0-L5γdwarfs (Faherty et al. 2013).
is surrounded by circum(sub)stellar material and shows signs of ongoing accretion (Bowler et al. 2011;Bailey et al. 2013). Therefore, the location of κ And b in this diagram suggests that it has an age between that of GSC 06214-00210 b and the popu-lation of field objects, or that it does not exhibit excess emission that is as strong as for GSC 06214-00210 b.
The companion κ And b falls on the sequence of L0-L4 field dwarfs in color–magnitude diagrams. The two L0γobjects of Faherty et al.(2013) with trigonometric parallaxes bracket the companion photometry. This is also self-consistent with the good match to AB Pic b (classified as L0 following the good match with the young L0γ dwarf 2MASS J01415823-4633574;
Kirkpatrick et al. 2006; Bonnefoy et al. 2010). The compan-ion falls above the 12+8−4 Myr old exoplanet β Pictoris b and midway between those of other known 30 Myr old compan-ions to 2MASS J01033563-5515561AB and HR 8799. This is consistent with κ And being more massive than the exoplanets HR 8799bcde (≤7-, 10-, 10-, 10 MJuprespectively;Marois et al.
2010;Currie et al. 2011;Sudol & Haghighipour 2012) and less massive than 2MASS J01033563-5515561(AB)b (12–14 MJup;
Delorme et al. 2013), if we assume the system is a member of the Columba moving group (see Sect.3.1).
We finally analyze the companion SED from the available photometry, the corresponding filter pass bands, and a flux-calibrated spectrum of Vega (Bohlin 2007), as shown in Fig.7. We also built, and report in the figure, the SED of typical young M8-L0 dwarfs using the 2MASS and Spitzer colors5 reported in Table 13 of Luhman et al. (2010) and normalized to the Ks band flux of κ And b. The errors on the normalization
fac-tor were propagated. We reconstructed the SED of Lγ dwarfs by taking the mean of the photometry reported in Table 3 of
Faherty et al.(2013) for a given spectra type and normalizing the flux to the one of κ And b in the Ksband. The SED of κ And b
5 We used the Gemini magnitude-flux converter for that purpose (http://www.gemini.edu/sciops/instruments/
midir-resources/imaging-calibrations/ fluxmagnitude-conversion)
falls between those of typical M9 and L0 dwarfs. It is incompat-ible with SEDs of L0 and L3γdwarfs.
In summary, our empirical analysis suggests that κ And b is an M9 to L3 dwarf. We used the bolometric correction BCKof
3.39 ± 0.03 mag (Todorov et al. 2010) derived for the prototype L0γdwarf 2MASS J01415823-4633574 (Kirkpatrick et al. 2006,
and considering the BCK of the Taurus M9.5 member
KPNO-Tau 4 and of another young L0 field dwarf 2MASS J02411151-0326587 for the error bar) in order to estimate log10(L/L ) =
−3.76 ± 0.06 for κ And b. This bolometric correction remains close to the one that is valid for M9-L8 field dwarfs (BCK =
3.19−3.33 mag;Liu et al. 2010).
3.3. Atmospheric models
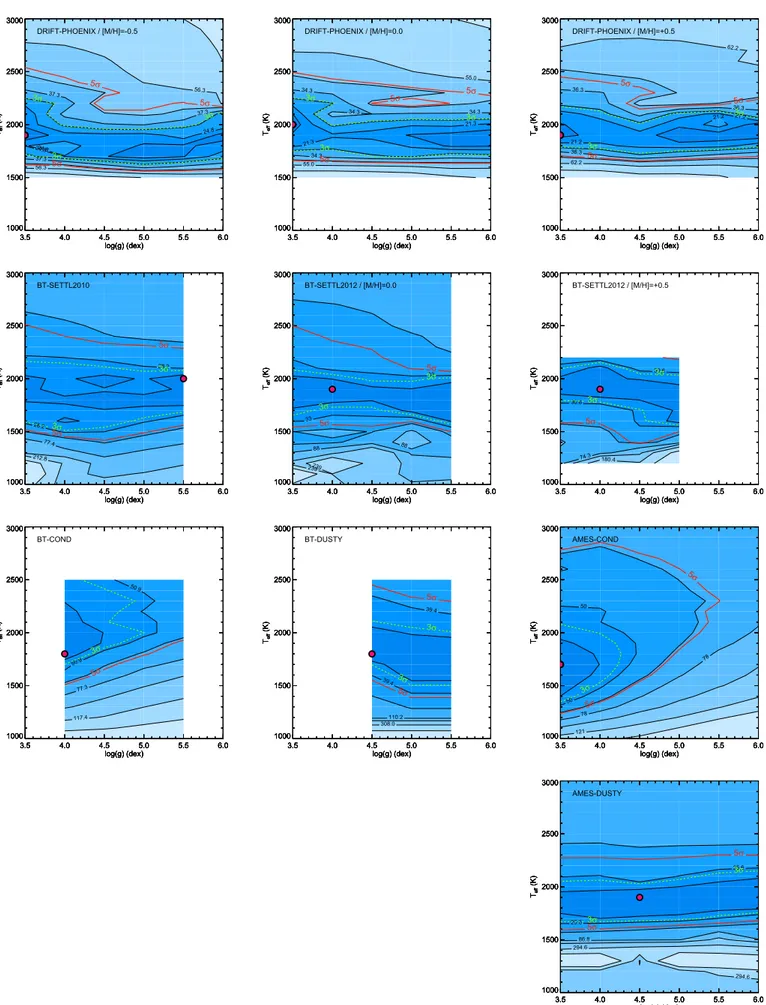
We compared the SED of κ And b to synthetic fluxes gen-erated from seven atmospheric grids (DUSTY, AMES-COND, BT-DUSTY, BT-AMES-COND, BT-Settl 2010, BT-Settl 2012, DRIFT-PHOENIX) to determine the atmospheric parameters of the companion (Teff, log g) and evaluate systematic errors on
these parameters introduced by the models (Bonnefoy et al. 2014). The models and the fitting procedure are described in
Bonnefoy et al.(2013). BT-Settl and DRIFT-PHOENIX mod-els are able to reproduce the spectra and photometry of late type companions such as κ And b, and of brown-dwarfs with vari-ous ages (Witte et al. 2011;Bonnefoy et al. 2014). We still used the 2010 release of the BT-Settl models (BT-Settl 2010), even though the models do not incorporate the latest physics. Indeed, synthetic spectra infered from the 2010 release of these mod-els tend to better reproduce the near-infrared (1.1–2.5 µm) spec-tra of young objects at the M − L spec-transition (Bonnefoy et al. 2014), such as κ And b. Results are reported in Table 3. The best-fitted synthetic fluxes are displayed in Fig.8. The χ2maps
of the fit (with 3 and 5σ confidence levels overlaid) are shown in Fig.9.
The models successfully reproduce the companion SED for Teff = 1900+100−200K. This corresponds roughly to the extreme
val-ues determined for a 3σ confidence level using the most ad-vanced models BT-SETTL12 (Fig. 9). The temperature coin-cides with the latest range derived for the young L0 objects, AB Pic b and 2MASS J01415823-4633574, from near-infrared spectra and SED fits (Teff = 1800+100−200 K; see Bonnefoy et al.
2014). We also find that models with photospheric dust produce better fits to the data. These models provide a better constraint on Teff, but not on the surface gravity (log g = 4.5 ± 1.0). This
was already the case for β Pictoris b (Bonnefoy et al. 2013). The high content in photospheric dust of κ And b is also con-sistent with constraints on the spectral type derived in Sect.3.2. To conclude, we note that the degenerate effects of metallicity and surface gravity do not affect the temperature determination of the companion.
The effective temperature and bolometric luminosity derived in Sect.3.2give a semi-empirical radius estimate of 1.2+0.2−0.1RJup
for κ And b. This radius is consistent with the value derived by adjusting synthetic fluxes to the observed companion SED ex-cept for the BT-DUSTY models, whose temperature determina-tion is likely biased by the limited coverage of the grid (Table3). The radius matches predictions from “hot-start” evolutionary tracks corresponding to the companion luminosity and tempera-tures for ages between 30 and 250 Myr.
Fig. 8.Best-fitted synthetic flux (horizontal bars) to the spectral-energy distribution of κ And b (magenta dots) considering the DRIFT-PHOENIX models with three different metallicities (left panel), the BT-SETTL models (middle panel), the AMES-DUSTY, AMES-COND, and BT-COND models (right panel). The corresponding synthetic spectra are overlaid in each panel.
Table 4. Mass of κ And b predicted by “hot-start” evolutionary models.
Model Age Mass from Teff Mass from L/L
(Myr) (MJup) (MJup)
COND03 30+20−10 14+11−2 13 ± 1 COND03 30+120−10 14+25−2 13+22−1
FM08 30+20−10 >10 >10
SB12 30+20−10 >10 >10
3.4. The mass ofκ And b
We compared Teff and the luminosity estimates derived in
pre-vious sections to predictions of evolutionary models in order to re-estimate the companion mass. We considered the two distinct age ranges determined in Sect.3.1.
3.4.1. Classical hot- and cold-start models
We first used the “hot-start” models ofBaraffe et al.(2003, here-after COND03). In Fig. 10, we compare masses predicted by these models for different companions. The mass estimates of κ And b are in the brown-dwarf regime if the system is 150 Myr old.
We also used the “hot-start” models ofFortney et al.(2008), andSpiegel & Burrows(2012), hereafter FM08 and SB12. These models explore the impact of chemical enrichment related to the formation process (1× and 5× solar for the FM08 models, 1× and 3× solar for the SB12 models) on the objects emergent flux and evolution. Results are reported in Table4. These models pre-dict masses above 10 MJup (maximum mass covered by these
models). The temperature and bolometric luminosity of κ And b give the same estimates.
We also considered the “cold-start” version of FM08 and SB12 models. Model predictions do not extend to high enough masses (M ≥ 10 MJup) to reproduce the luminosity and
temper-ature of κ And b.
3.4.2. Warm-start models
The formation mechanism of κ And b is not known (see Sect.4) and, more importantly, the outcome, in terms of initial bright-ness, of the different formation scenarios cannot be predicted yet. We show in Fig. 10 the impact of initial conditions with two cooling curves ofMarleau & Cumming(2014). The “cold-start” curves correspond to cases with initial entropy Sinitof 9.5
Boltzmann units per baryon (kB/baryon). The “hot-start”
cool-ing curves correspond to Sinit = 13 kB/baryon for a mass of
3 MJup, and 14 kB/baryon for masses from 5 to 13.6 MJup. It
is then essential to consider models with a wide range of possi-ble entropies, including those of the “hot-start” and “cold-start” models. We examined the predictions of two sets of “warm-start” models (Spiegel & Burrows 2012;Marleau & Cumming 2014) for κ And b for that reason.
The “warm-start” models of SB12 consider Sinit from 8 to
13 kB/baryon in 0.25 kB/baryon increments and masses from 1
to 15 MJup. The models incorporate a deuterium-burning phase
(Spiegel et al. 2011; A. Burrows, priv. comm.). Temperature and radii predictions were provided by the authors (D. Spiegel, priv. comm.) for this set of input parameters. We combined them to create bolometric luminosity predictions. The luminosity and ef-fective temperature predicted by the models tend to increase with the object mass and initial entropy and to decrease with ages. Therefore, we determined the combination of initial entropies and masses corresponding to κ And b’s measured luminosity and temperature, assuming a system age of t= 30 Myr and propagat-ing the associated uncertainties. We show the results in Fig.11
for an age of t = 30+20−10 Myr. The mass of κ And b is greater than or equal to 13 MJupaccording to these models. Predicted
masses from the luminosity agree with the ones derived from the temperature, although predictions do not extend to sufficiently high masses to reproduce the upper limit on the estimated Teffof
κ And b. The companion properties can not match model predic-tions for ages of 150 Myr for the same reason.
We also derived absolute flux predictions of SB12 models for the given filter passbands and the four sets of boundary con-ditions (free models at solar metallicity – cf1s, cloud-free models with three times the solar metallicity – cf3s,
hy-3.5 4.0 4.5 5.0 5.5 6.0 log(g) (dex) 1000 1500 2000 2500 3000 Teff (K) 3.5 4.0 4.5 5.0 5.5 6.0 log(g) (dex) 1000 1500 2000 2500 3000 Teff (K) 24.8 24.8 24.8 37.3 37.3 37.3 56.3 56.3 3.5 4.0 4.5 5.0 5.5 6.0 log(g) (dex) 1000 1500 2000 2500 3000 Teff (K) 3σ 3σ 3σ 3.5 4.0 4.5 5.0 5.5 6.0 log(g) (dex) 1000 1500 2000 2500 3000 Teff (K) 5σ 5σ 5σ DRIFT-PHOENIX / [M/H]=-0.5 3.5 4.0 4.5 5.0 5.5 6.0 log(g) (dex) 1000 1500 2000 2500 3000 Teff (K) 3.5 4.0 4.5 5.0 5.5 6.0 log(g) (dex) 1000 1500 2000 2500 3000 Teff (K) 21.3 21.3 34.3 34.3 34.3 34.3 55.0 55.0 3.5 4.0 4.5 5.0 5.5 6.0 log(g) (dex) 1000 1500 2000 2500 3000 Teff (K) 3σ 3σ 3σ 3.5 4.0 4.5 5.0 5.5 6.0 log(g) (dex) 1000 1500 2000 2500 3000 Teff (K) 5σ 5σ 5σ DRIFT-PHOENIX / [M/H]=0.0 3.5 4.0 4.5 5.0 5.5 6.0 log(g) (dex) 1000 1500 2000 2500 3000 Teff (K) 3.5 4.0 4.5 5.0 5.5 6.0 log(g) (dex) 1000 1500 2000 2500 3000 Teff (K) 21.2 21.2 21.2 36.3 36.3 36.3 62.2 62.2 3.5 4.0 4.5 5.0 5.5 6.0 log(g) (dex) 1000 1500 2000 2500 3000 Teff (K) 3σ 3σ 3.5 4.0 4.5 5.0 5.5 6.0 log(g) (dex) 1000 1500 2000 2500 3000 Teff (K) 5σ 5σ 5σ DRIFT-PHOENIX / [M/H]=+0.5 3.5 4.0 4.5 5.0 5.5 6.0 log(g) (dex) 1000 1500 2000 2500 3000 Teff (K) 3.5 4.0 4.5 5.0 5.5 6.0 log(g) (dex) 1000 1500 2000 2500 3000 Teff (K) 28.2 28.2 77.4 212.8 3.5 4.0 4.5 5.0 5.5 6.0 log(g) (dex) 1000 1500 2000 2500 3000 Teff (K) 3σ 3σ 3.5 4.0 4.5 5.0 5.5 6.0 log(g) (dex) 1000 1500 2000 2500 3000 Teff (K) 5σ 5σ BT-SETTL2010 3.5 4.0 4.5 5.0 5.5 6.0 log(g) (dex) 1000 1500 2000 2500 3000 Teff (K) 3.5 4.0 4.5 5.0 5.5 6.0 log(g) (dex) 1000 1500 2000 2500 3000 Teff (K) 33 33 88 88 239239 3.5 4.0 4.5 5.0 5.5 6.0 log(g) (dex) 1000 1500 2000 2500 3000 Teff (K) 3σ 3σ 3.5 4.0 4.5 5.0 5.5 6.0 log(g) (dex) 1000 1500 2000 2500 3000 Teff (K) 5σ 5σ BT-SETTL2012 / [M/H]=0.0 3.5 4.0 4.5 5.0 5.5 6.0 log(g) (dex) 1000 1500 2000 2500 3000 Teff (K) 3.5 4.0 4.5 5.0 5.5 6.0 log(g) (dex) 1000 1500 2000 2500 3000 Teff (K) 30.6 30.6 74.3 180.4 3.5 4.0 4.5 5.0 5.5 6.0 log(g) (dex) 1000 1500 2000 2500 3000 Teff (K) 3σ 3σ 3.5 4.0 4.5 5.0 5.5 6.0 log(g) (dex) 1000 1500 2000 2500 3000 Teff (K) 5σ BT-SETTL2012 / [M/H]=+0.5 3.5 4.0 4.5 5.0 5.5 6.0 log(g) (dex) 1000 1500 2000 2500 3000 Teff (K) 3.5 4.0 4.5 5.0 5.5 6.0 log(g) (dex) 1000 1500 2000 2500 3000 Teff (K) 50.9 50.9 77.3 117.4 3.5 4.0 4.5 5.0 5.5 6.0 log(g) (dex) 1000 1500 2000 2500 3000 Teff (K) 3σ 3.5 4.0 4.5 5.0 5.5 6.0 log(g) (dex) 1000 1500 2000 2500 3000 Teff (K) 5σ BT-COND 3.5 4.0 4.5 5.0 5.5 6.0 log(g) (dex) 1000 1500 2000 2500 3000 Teff (K) 3.5 4.0 4.5 5.0 5.5 6.0 log(g) (dex) 1000 1500 2000 2500 3000 Teff (K) 39.4 39.4 110.2 308.0 3.5 4.0 4.5 5.0 5.5 6.0 log(g) (dex) 1000 1500 2000 2500 3000 Teff (K) 3σ 3σ 3.5 4.0 4.5 5.0 5.5 6.0 log(g) (dex) 1000 1500 2000 2500 3000 Teff (K) 5σ 5σ BT-DUSTY 3.5 4.0 4.5 5.0 5.5 6.0 log(g) (dex) 1000 1500 2000 2500 3000 Teff (K) 3.5 4.0 4.5 5.0 5.5 6.0 log(g) (dex) 1000 1500 2000 2500 3000 Teff (K) 50 50 78 78 121 3.5 4.0 4.5 5.0 5.5 6.0 log(g) (dex) 1000 1500 2000 2500 3000 Teff (K) 3σ 3.5 4.0 4.5 5.0 5.5 6.0 log(g) (dex) 1000 1500 2000 2500 3000 Teff (K) 5σ 5σ AMES-COND 3.5 4.0 4.5 5.0 5.5 6.0 log(g) (dex) 1000 1500 2000 2500 3000 Teff (K) 3.5 4.0 4.5 5.0 5.5 6.0 log(g) (dex) 1000 1500 2000 2500 3000 Teff (K) 25.6 25.6 86.8 294.6 294.6 3.5 4.0 4.5 5.0 5.5 6.0 log(g) (dex) 1000 1500 2000 2500 3000 Teff (K) 3σ 3σ 3.5 4.0 4.5 5.0 5.5 6.0 log(g) (dex) 1000 1500 2000 2500 3000 Teff (K) 5σ 5σ AMES-DUSTY
Fig. 9.χ2maps corresponding to the comparison of the spectral energy distribution of κ And b to synthetic fluxes derived from atmospheric models for given log g and Teff. Minima are indicated by magenta dots. We overlaid contours corresponding to 3σ (green) and 5σ (red) confidence levels.
Fig. 10. Evolution of the luminosity of gaseous objects predicted by the COND models (solid black line) and by Marleau & Cumming
(2014) models with typical “hot-start” (dashed light pink curve; 3, 5, 10, 13.6 MJup), and “cold-start” initial conditions (dashed dark blue curve; 3, 5, 10, 13.6 MJup). We overlaid measured luminosity of young low-mass companions. A more complete version of this figure can be found inMarleau & Cumming(2014).
brid clouds at solar metallicity – hy1s, hybrid clouds with three times the solar metallicity – hy3s) used for κ And b following the same method as inBonnefoy et al.(2013). These synthetic fluxes were compared to the observed SED. The results are reported in Table5. The comparison is biased by the limited mass coverage of the models. We note, however, that solutions found within the models boundaries correspond to initial entropies midway be-tween those of hot and cold-start models, placing the mass at the typical planet/brown-dwarf boundary (∼13.6 MJup,Spiegel et al.
2011; Mollière & Mordasini 2012;Bodenheimer et al. 2013). These solutions correspond to Teffvalues that are in good
agree-ment with those determined from the companion SED.
In comparison, the models ofMarleau & Cumming(2014) have a much simpler outer boundary condition (hereafter MC13), using a gray, solar-metallicity atmosphere. They can be used to evaluate the impact of underlying hypotheses made in the models (e.g., atmosphere treatment, equation of state) on the derived joint mass and Sinitvalues. We ran Markov Chain Monte
Carlo simulations (MCMCs) in mass and initial entropy as in
Marleau & Cumming(2014) with the related models to account for the uncertainties on the age, Teff, and luminosity of κ And b.
We assumed Gaussian distributions on L and Teff. We took
nor-mal or lognornor-mal errorbars for the two considered age ranges (t= 30+20−10Myr and t= 30+120−10 Myr), and chose flat priors in Sinit
and M.
Figure 12displays the 68-, 95-, and 99% joint confidence regions from the MCMC runs for both age groups. Open and closed circles are as in Marley et al.(2007), showing the ap-proximate range of entropies spanned by hot and coldest starts,
Table 5. Best fit photometric predictions of the “warm-start” evolution-ary models.
Atmospheric model Age Mass Sinit χ2
(Myr) (MJup) (kB/baryon)
Cloud free – 1× solar 20 15 9.75 83.19
Cloud free – 3× solar 20 15 9.75 57.77
Hybrid cloud – 1× solar 20 14 9.75 14.56
Hybrid cloud – 3× solar 20 14 9.75 11.92
Cloud free – 1× solar 30 14 9.75 83.39
Cloud free – 3× solar 30 14 9.75 58.32
Hybrid cloud – 1× solar 30 14 10.25 13.73 Hybrid cloud – 3× solar 30 14 10.00 11.29
Cloud free – 1× solar 50 14 10.25 82.45
Cloud free – 3× solar 50 14 10.50 57.66
Hybrid cloud – 1× solar 50 14 13.00 19.30 Hybrid cloud – 3× solar 50 14 13.00 16.27
Cloud free – 1× solar 150 14 13.00 185.43
Cloud free – 3× solar 150 14 12.75 175.71
Hybrid cloud – 1× solar 150 14 13.00 173.50 Hybrid cloud – 3× solar 150 14 13.00 168.67 Notes. Solutions found at the edges of the parameter space (mass, Sinit) covered by the models are highlighted in italic.
respectively, but shifted upwards by+0.38 kB/baryon to match
the luminosity in the models of MC13 (see therein). The results are consistent with those of Fig.11.
Even for the low-age group, almost all solutions are in the mass regime where deuterium burning is important for the evo-lution of the object. A dramatic illustration of this lies in the solutions found at lower entropies. Whereas the models of SB12 allowed, for an age of 30+20−10Myr, initial entropies down to only 9.5 kB/baryon to 1σ in luminosity (see Fig.11), the models of
MC13 find that κ And b could have formed with an entropy as low as ≈8.8 kB/baryon, correcting downward from Fig. 12
for the entropy offset of 0.45 kB/baryon between the two
mod-els6. The low-Sinit solutions are possible only if the models
in-clude a rise in the object’s luminosity due to deuterium burning (Mollière & Mordasini 2012;Bodenheimer et al. 2013, Marleau & Cumming, in prep.). This is illustrated in Fig.13, which shows cooling tracks for different (M, Sinit) combinations that all reach
log L/L = −3.76 at 30 Myr. The lowest initial-entropy solutions
undergo a “flash”, where the entropy in the object increases on a short timescale. The combination of the measured Teffand
lumi-nosity (hence the object radius) cannot help to distinguish these different possible cooling curves. Indeed, the high initial entropy (“hot-start”) and the flashing cooling curves have a difference of some 25 K or 0.05 RJin predicted Teffand radius alone.
The exact low-entropy solutions can depend on the details of deuterium burning, for instance, on the initial deuterium con-tent or metallicity of the object (Spiegel et al. 2011;Mollière & Mordasini 2012), but the main conclusion is a robust one: the combustion of deuterium may play a significant role in the cooling history of κ And b, irrespective of the precise age of the system.We warn that while the lowest Sinitare comparable
to the extrapolation of the coldest starts (Marley et al. 2007) to higher masses, what this implies about the formation mechanism 6 The implementation of the equation of state ofSaumon et al.(1995) is slightly different in the two cases, with SB12 using a simpler version of theSaumon et al.(1995) code that does not include a contribution from the proton spin in the partition function. SeeMarleau & Cumming
Fig. 11.Predictions of the “warm-start” evolutionary models of SB12 for κ And b for a system at t ≈ 30+20−10Myr. The extreme values of the companion age, Teff, and luminosities define a range of masses and ini-tial entropies lying between the dashed and dot-dashed curves. We also overlay the initial entropies considered in “hot-start” (open circles) and “cold-start” (dots) models of FM08 (based onMarley et al. 2007).
is not clear given the major uncertainties about their outcome (see Sect.4).
4. Discussion
The characterization of κ And further illustrate the challenge of determining accurate masses for companions due to uncertain-ties on the age-dating methods and evolutionary tracks.
The deprojected (and projected) separation of κ And b (61+50−20AU,Carson et al. 2013) is compatible with the size of pri-mordial (e.g.,Mannings & Sargent 1997;Pani´c & Hogerheijde 2009; Guilloteau et al. 2013, and references therein) and de-bris disks (Booth et al. 2013, and references therein) surround-ing stars in the same mass range as κ And A, some of which show structures suggesting a clear signpost for planets (e.g., HR 4796, Schneider et al. 1999; Lagrange et al. 2012b). The companion location also fits well with the extent and the location of cavities/gaps/spirals in young structured (or transition) disks (Andrews et al. 2011; Grady et al. 2013;Quanz et al. 2013b) discovered around Herbig Ae stars. κ And b’s separation is close to that of the candidate substellar embryo (Quanz et al. 2013a) around the 2.4 M star HD 100546, whose mass might extend
inside the “brown-dwarf” regime. It is in addition midway be-tween the two outermost planets orbiting HR 8799, and nearly identical to the probable exoplanet HD 95086b (Rameau et al. 2013a), all orbiting intermediate-mass stars. Therefore, despite the large uncertainties on the mass of κ And b and the lack of disk excess emission around κ And A (Sect.3.1), we should still consider that the companion could have formed within a disk.
The growing population of massive gaseous companions dis-overed on short-period orbits around massive stars (e.g.,Galland et al. 2006;Deleuil et al. 2008;Hartmann et al. 2010;Lee et al. 2011; Bouchy et al. 2011, and references therein), the discov-ery of unusually dense substellar companions (e.g., CoRoT-20b and HAT-P-20b Bakos et al. 2011; Deleuil et al. 2012) and
Fig. 12.Joint posteriors for the mass and initial entropy of κ And b ob-tained through MCMC runs with the models ofMarleau & Cumming
(2014), which include deuterium burning from Teff(solid lines) and the bolometric luminosity (dashed lines) of κ And b, assuming Gaussian error-bars. Entropy values need to be decreased by 0.45 kB/baryon when comparing with SB12. The contours indicate the 68-, 95-, and 99% confidence levels (thick to thin lines). The color (from dark to light) is proportional to the joint posterior probability at each M and Sinitlocation in the Teff-based run. The age was taken as t= 30+20−10Myr (top panel) and t= 30+120−10 Myr (bottom panel).
recent simulations (Mordasini et al. 2009b; Bonnefoy et al. 2013) suggest that the core-accretion mechanism might still work well inside the brown-dwarf mass regime7. Kennedy &
Kenyon(2008) show that 10 M⊕ cores can form in less than
1 Myr from ∼3 to ∼23 AU around 2.4–2.8 M stars. Rafikov
(2011) also propose that core accretion could operate out to 40–50 AU. A formation closer to the snow line associated to 7 Disk instability associated to “tidal-downsizing” might also explain the observations (Boley et al. 2010,2011;Nayakshin 2010b,a,2011). But the models have not been extensively tested against observations yet (Forgan & Rice 2013).