Comparison between Control-Based Continuation and Phase-Locked
Loop Methods for the Identification of Backbone Curves & Nonlinear
Frequency Responses
Florian M¨
uller
1, Ga¨
etan Abeloos
2, Erhan Ferhatoglu
3, Maren Scheel
1,
Matthew R. W. Brake
4, Paolo Tiso
5, Ludovic Renson
6, Malte Krack
11
Institute for Aircraft Propulsion Systems,
University of Stuttgart, Postfach 10 60 37, 70049 Stuttgart, Germany
2
Department of Aerospace and Mechanics,
University of Li`
ege, Place du 20-Aoˆ
ut 7, B-4000 Li`
ege, Belgium
3
Department of Mechanical and Aerospace Engineering,
Politecnico di Torino, Corso Duca degli Abruzzi 24, 10129 Torino, Italy
4
Department of Mechanical Engineering,
Rice University, 6100 Main St., Houston, TX 77005-1827, USA
5
Department of Mechanical and Process Engineering,
ETH Z¨
urich, R¨
amistrasse 101, 8092 Zurich, Switzerland
6
Department of Mechanical Engineering
Imperial College London, South Kensington Campus, London SW7 2AZ, UK
Abstract
Control-based continuation (CBC) and phase-locked loops (PLL) are two experimental testing methods that have demonstrated great potential for the non-parametric identification of key nonlinear dynamic features such as nonlinear frequency responses and backbone curves. Both CBC and PLL exploit stabilizing feedback control to steer the dynamics of the tested system towards the responses of interest and overcome important difficulties experienced when applying conventional testing methods such as sine sweeps to nonlinear systems. For instance, if properly designed, the feedback controller can prevent the system from exhibiting untimely transitions between coexisting responses or even losing stability due to bifurcations. This contribution aims to highlight the similarities that exist between CBC and PLL and present the first thorough comparison of their capabilities. Comparisons are supported by numerical simulations as well as experimental data collected on a conceptually simple nonlinear structure primarily composed of a thin curved beam. The beam is doubly clamped and exhibits nonlinear geometric effects for moderate excitation amplitudes.
Keywords: Control-Based Continuation, Phase-Locked Loop, Backbone Curves, Nonlinear Dynamics, Experimental Identification
Introduction
Experimental characterization of the dynamics of nonlinear structures is challenging for multiple reasons. The characteristics of the structural response can be heavily dependent on the level of excitation of the structure. For instance, the frequency at which the structure’s displacement and the force applied to it are in phase quadrature can vary with the response amplitude. This relationship is called the backbone curve of the structure. Additionally, several periodic orbits can exist for identical excitation signals. This can be illustrated by the frequency response curves, the relationship between the structural response and the frequency of an harmonic excitation of constant amplitude. Consequently, classical methods used to characterize linear structures encounter difficulties. For instance, performing a sine sweep on a nonlinear structure can result in sudden jumps from one periodic orbit to another and might not unveil all possible limit states (including isolated and unstable ones).
In recent years, new methods for experimental characterization using feedback control were introduced in the lit-erature. The present work consists in performing for the first time the comparison between the phase-locked loop method (PLL) [1] and the control-based continuation (CBC) [2]. Both method can directly obtain the backbone curve in a single experiment. The consistency between the methods is studied as well as their capabilities.
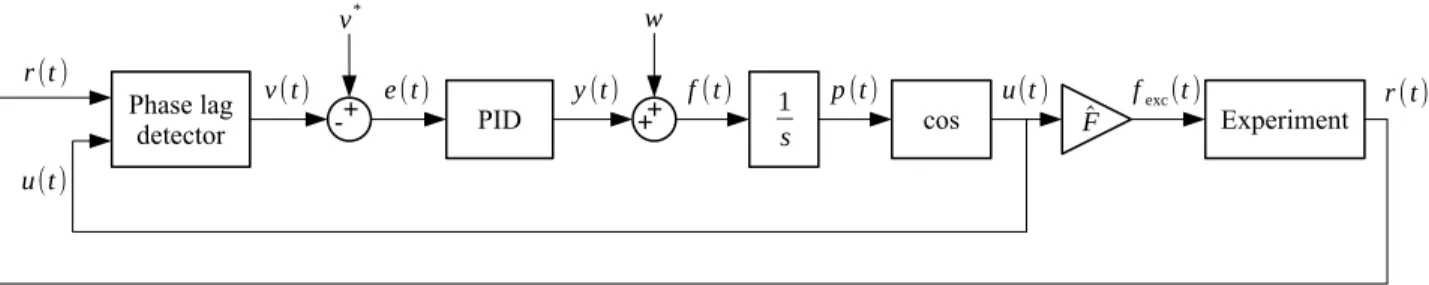
Phase lag detector PID 1 s cos + - ++ r(t ) u(t) v(t) v* e(t) y(t) f(t) w p(t) u(t ) fexc(t ) ^F Experiment r(t)
(a) The signals are the following: r(t) the measured response, p(t) the excitation phase, v(t) the measured phase lag, v∗(t) the target phase lag, e(t) the error, y(t) the PID controller output with units of frequency, w the linear resonance frequency, f (t) the excitation frequency, and the excitation signal u(t) multiplied by the gain ˆF to create the signal fexc(t) fed into the actuator of the experiment
PD + -r(t) r*(t) e(t) y(t) Experiment Iterations r(t)
(b) The signals are the following: r(t) the measured response, r∗(t) the target response, e(t) the error, y(t) the PD controller output with units of voltage which is fed into the shaker; iterations are made on r∗(t) to cancel the non-fundamental harmonics of e(t)
Fig. 1 Diagrams of the PLL and CBC methods, both using different feedback loops to impose respectively the excitation-response phase lag and the response amplitude; the experiment comprises an actuator, sensors, and the structure
Characterization methods
The phase-locked loop (PLL) method imposes a phase lag v∗(t) between the structural response r(t) and the excitation signal fexc(t) using feedback control. Fig. 1a shows the structure of the PLL feedback loop. The phase lag v(t) is
detected between the measured response signal r(t) and the oscillating signal u(t). The phase lag detector relies on the fact that the product of two harmonic signals possesses a constant part whose value depends on the phase lag. This constant part is isolated using a low-pass filter whose cut-off frequency is below the first harmonic of the
signals. Subtracting v(t) from the phase lag target v∗(t) gives the phase error e(t) = v∗− v(t) which is fed into a PID controller. The purpose of the controller is to cancel e(t) completely. The resulting signal y(t) has frequency units and can be seen as the frequency difference between the linear resonance frequency w and the excitation frequency f (t) = w + y(t). The time integral of the excitation frequency is the excitation phase p(t). The cosine of p(t) gives the excitation signal u(t). In order to control the excitation level, u(t) is multiplied by a gain ˆF creating the signal fexc(t) which feeds the actuator connected to the structure.
Control-based continuation (CBC) imposes the response amplitude using feedback control as well. Fig. 1b shows the feedback loop of CBC. The response r(t) is multiharmonic due to the nonlinearities in the experiment. r(t) is directly compared to a response target r∗(t) to create the error signal e(t), fed into a PD controller. The resulting excitation signal y(t) is fed into the shaker connected to the structure. Contrary to the PLL, the control error e(t) does not need to be cancelled completely as the target signal acts only as a proxy for the system states. In this case, y(t) must be a non-zero monoharmonic signal, and so must e(t). The main challenge of the method is to find an adequate r∗(t). The first harmonic of r∗(t) is the parameter controlling the excitation level. However, if r∗(t) was monoharmonic, the error signal e(t) would contain the harmonics of r(t) and the controller would be invasive, i.e. the excitation signal y(t) would be multiharmonic whereas a monoharmonic excitation is desired. After reaching steady-state, the higher harmonics of r∗(t) can be replaced by the ones of r(t). This is repeated until the higher harmonics are identical in both signals. At this point, e(t) is monoharmonic and so is y(t): the controller is non-invasive.
Fig. 2 Base-excited experiment comprising a shaker actuating the structure, itself composed of a rigid base and a thin curved beam; sensors consist in a laser vibrometer and an impedance head measuring the force and the acceleration at the shaker-base connection
Experimental results
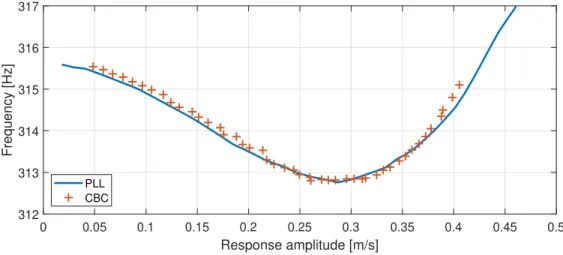
Both methods are applied on the structure shown in Fig. 2. It is a slightly curved beam bolted to a base which exhibits softening-hardening behavior. The base is mounted vertically on a shaker with an impedance head at their connection to measure the force and the acceleration at this point. The velocity of the beam is measured by a laser vibrometer (see Fig. 2). Backbones measured successively by CBC and PLL are shown and compared in Fig. 3 and present a clear softening-hardening behavior. They are very consistent with one another, both methods measured the same frequency for the fold bifurcation in the backbone curve. Fig. 4 shows the frequency response curves (FRCs) obtained by moth methods. Fig. 4a shows the FRCs directly measured by the PLL method. Although FRCs could have also been measured with the CBC method, they were interpolated from the data collected during amplitude sweeps [2]. These interpolated FRCs are shown in Fig. 4c. Corresponding FRCs obtained by both methods are compared in Fig. 4b. Because the experiments were not made successively, the backbones are not entirely consistent, but both them and the FRCs show high consistency between both methods.
312 313 314 315 316 317 Frequency [Hz] 0 0.05 0.1 0.15 0.2 0.25 0.3 0.35 0.4 0.45 0.5 Response amplitude [m/s] PLL CBC
Fig. 3 Comparison between the backbone curve directly measured with the PLL method and with the CBC
312 314 316 318 Frequency [Hz] 0 0.05 0.1 0.15 0.2 0.25 0.3 0.35 0.4 0.45 0.5 Response amplitude [m/s] Backbone (measured) FRCs (measured) 6 N 2.7 N 0.3 N
(a) FRCs directly measured with PLL
312 313 314 315 Frequency [Hz] 0 0.05 0.1 0.15 0.2 0.25 0.3 0.35 0.4 Response amplitude [m/s] Backbone (PLL, measured) FRC (PLL, measured) Backbone (CBC, measured) FRC (CBC, interpolated)
(b) Comparison between the FRCs mea-sured with PLL and iterpolated from data measured with CBC at a forcing amplitude of 2.7 N 312 313 314 315 Frequency [Hz] 0 0.05 0.1 0.15 0.2 0.25 0.3 0.35 0.4 Response amplitude [m/s] Backbone (measured) FRCs (interpolated) 2.7 N 5 N 1 N
(c) FRCs interpolated from data mea-sured with CBC
Conclusion
The phase-locked loop (PLL) and control-based continuation (CBC) were directly compared when applied to the same softening-hardening structure. Both methods are capable of directly measuring the backbone curve of the structure and give out consistent results. The PLL method can directly measure the frequency response curves experimentally. The CBC method can in theory do the same but in this work, it has been used to measure the full manifold of the structural response, from which the frequency response curves has been interpolated. The methods give consistent results for the backbones and the frequency response curves.
Acknowledgement
G.A. is funded by the FRIA grant of the Fonds National de la Recherche Scientifique (FNRS), L.R. is funded by a Research Fellowship from the Royal Academy of Engineering (RF1516/15/11). They gratefully acknowledge the financial support of the Royal Academy of Engineering and the FNRS.
References
[1] Scheel, M., Peter, S., Leine, R. I. and Krack, M., A phase resonance approach for modal testing of structures with nonlinear dissipation, Journal of Sound and Vibration, Vol. 435, pp. 56–73, 2018.
[2] Renson, L., Gonzalez-Buelga, A., Barton, D. A. W. and Neild, S., Robust identification of backbone curves using control-based continuation, Journal of Sound and Vibration, Vol. 367, pp. 145–158, 2016.