Cryogenic
1
zone compression GC-HRTOFMS for the
measurement of PCB-153 and DDE in 20 mL serum
samples
B. L'Homme and J.-F. Focant 2
Human exposure to POPs is of concern and typical biomonitoring studies require large amounts of blood (5–75 mL) from participants. As a proof of concept, we developed a miniaturized method based on MEPS and CZC applied to GC-HRTOFMS for the measurement of markers of exposure (PCB-153, DDE) in 20 mL human serum samples.
Introduction
Humans all over the world are exposed to chemicals during their lifetime. Among the thousands of existing anthropogenic compounds are persistent organic pollutants (POPs), including compounds like polychlorinated dibenzo-p-dioxins (PCDDs),
polychlorinated dibenzofurans (PCDFs), polychlorinated
biphenyls (PCBs), and organochlorine pesticides (OCPs), but there are also a large number of new molecules like halogenated ame retardants (HFRs). Although the peak exposure to PCDD/ Fs, PCBs, and OCPs happened in the 1970's, their persistence and ubiquity result, still today, in signicant exposure levels.
The aim of this work is to prove the concept of a minimally invasive method for the analysis of selected POPs in a small amount of sample (20 mL of serum). In this proof of concept study we concentrated our efforts on two target analytes (e.g.
PCB-153 and dichlorodiphenyldichloroethylene (DDE),
a metabolite of dichlorodiphenyltrichloroethane (DDT)) that can be considered as representative markers of exposure for both PCB and OCP families, and are of high interest in human
biomonitoring studies.1 Unlike the methodology recently
developed by Lu et al.,2our method was based on the
combi-nation of a miniaturized sample preparation procedure named micro-extraction by packed sorbent (MEPS) with the cryogenic modulation of gas chromatographic peaks for signal enhance-ment. This modulation process was reported earlier by Patter-son et al.3as cryogenic zone compression (CZC), a specic use of
comprehensive two-dimensional gas chromatography (GC ! GC) for ultra-trace level measurements. Similarly, fast GC is able
to improve compound detectability by time compression of regular GC peak widths from a few dozens of seconds to a few seconds,4CZC is able to act as a refocusing device that reduces
GC peak widths to the 50–200 ms range. Modulated GC peaks were characterized using a high-resolution (HR) mass spectro-metric time-of-ight analyzer (TOFMS). We further show that the method could easily be extended not only to other known POPs (e.g. HFRs and PCDD/Fs), but also to more emerging compounds thanks to the screening capabilities of GC ! GC.5,6
The use of (ultra) low volumes of blood can be an asset for extensive human biomonitoring studies, and potentially a valuable approach in the context of UNEP studies for POP inventories,7 especially in remote areas or in regions of the
world, such as in central America,8where the lack of data could
be, at least partly, overcome if an easy to use and non-invasive sampling method was available. Furthermore the application of the method to dried samples (dried-blood spots, DBSs), a method developed by Guthrie in 1963,9would facilitate long
range transportation and storage of such samples.10,11To the
best of our knowledge, Dua et al. and Burse et al. were the rst to briey report preliminary data on the potential use of human DBSs for hexachlorocyclohexane (HCH), DDT, and DDE measurement using GC coupled to a non-selective micro-electron capture detector (mECD).12,13 POP measurements in
a small sample volume have also been investigated in 0.5 mL plasma samples,14in regular newborn screening program (NSP)
samples,1,15–17and also in animal samples.18–20Despite the fact
that these methods required a signicantly lower amount of blood, compared to the typical amounts necessary in most human biomonitoring studies (5–75 mL of serum21), they were
still requiring sample volumes of 100 mL or more, a quantity hardly obtained by a simple nger or heel prick.
In this report, we present an analytical method that offers new possibilities with regards to the extremely low amount of sample used, while maintaining adequate detection limits for the measurement of 2 selected markers of exposure for both PCB and OCP families. Next to CZC, the screening capabilities of state-of-the-art coupling of cryogenically modulated GC ! GC
CART, Organic and Biological Analytical Chemistry, Chemistry Department, University of Li`ege, All´ee de la Chimie 3, B-6c Sart-Tilman, B-4000 Li`ege, Belgium
3 4
Cite this: DOI: 10.1039/c5ay00543d
Received 2nd March 2015 Accepted 14th November 2015 DOI: 10.1039/c5ay00543d www.rsc.org/methods 1 5 10 15 20 25 30 35 40 45 50 1 5 10 15 20 25 30 35 40 45 50
Analytical
Methods
COMMUNICATION
and HRTOFMS22 are also investigated for extension of the
approach to other POPs typically measured using classical GC
coupled to isotope dilution (ID) sector HRMS23 standard
methods.
Experimental
Samples and chemicals
Samples used in this study were made of sub-samples origi-nating from a measurement campaign that was run in our ISO17025 routine laboratory. All details about samples are available in a previous report.24All experiments were performed
in compliance with the relevant laws and institutional guide-lines; the research protocol was approved by the relevant insti-tutional review boards and ethics committees (French Ministry of Health, # 2001-1485). Written informed consent was obtained from each participant before the interview. A single epidemi-ologist collected data through a face-to-face interview. PCDD/F, non dioxin-like PCB (NDL-PCB), as well as selected OCP refer-ence levels were determined by a validated GC-IDHRMS method following EU standards or food and feed under ISO 17025 regulation and used as reference values. A mixture of internal standards of13C-labeled DDE and13C-labeled NDL-PCBs (#28,
52, 101, 138, 153, 180, and 209) (Cambridge Isotope Laborato-ries (CIL), Andover, MS, USA) was used in all analyses for isotopic dilution (ID) quantitation. Internal ID standards were added to samples prior to extraction. The recovery standard was made of a solution of13C-labeled PCB-80 (CIL) and was added to
the cleaned extract just before the GC-MS injection. It was used to assess the loss of compounds during analysis (internal standard vs. recovery standard) and the quantitation was not affected by any loss of compounds since all analytes were quantitated by ID against13C-labeled internal standards. The
calibration curve of PCB-153 was constructed using EC-5179 and EC-4058 standard solutions (CIL). Solvents (formic acid, methanol, hexane, dichloromethane and acetone) were Picograde® reagents (LGC Promochem, Wesel, Germany). The nonane puriss analytical-reagent grade standard for GC was purchased from Fluka (Steinheim, Germany). Water was obtained from a Milli-Q Ultrapure water purication system (Millipore, Brussels, Belgium). Chromatographic pure grade helium gas, 99.9999% alphagaz 2, was purchased from Air-liquide (Paris, France).
Filter paper supports used for DBSs were provided by Perkin Elmer (Norwalk, CT, USA). DBSs were prepared by pipetting a nite amount of serum or blood on the paper and were then dried in air for several hours and stored at room temperature in zip-closing plastic bags. Samples were subsequently extracted by liquid–liquid extraction (LLE) or by micro-extraction by packed sorbent (MEPS) using a dedicated
6 MEPS syringe and
C18 phase (SGE, Melbourne, Australia). LLE was performed aer elution of the sample out of the paper with 150 mL phos-phate buffer saline solution (PBS) followed by 150 mL formic acid 98%. The LLE extraction solvent was a mixture of hexane/ dichloromethane (DCM) 70 : 30, and samples were extracted 3 times with 350 mL aer hand shaking and centrifugation at 4500 rpm for 5 min. Clean up aer LLE of 100 mL samples was carried
out as follows: a Pasteur pipette (230 mm) was lled with approximately 2 g of acid silica (22% H2SO4) and 1 g of
anhy-drous sodium sulfate on the top. The hand-made column was conditioned and samples were eluted with the same hexane/ DCM mixture. MEPS was carried out by loading the sample on the sorbent (pumping several times), followed by washing with 400 mL water, and elution with hexane/DCM mixture 70 : 30. Instrumentation
Measurements were carried out on a JEOL AccuTof T100GC (JEOL Ltd., Tokyo, Japan). A GC oven (Agilent 6890) was equipped with a ZX1 – liquid nitrogen dual stage cooled loop modulator GC ! GC system (Zoex Corp., Houston, TX, USA). The rst dimension (1
D) GC column was an Rxi-XLB (30 m ! 0.25 mm ID ! 0.25 mm df) (Restek Corp., Bellefonte, PA, USA). The second dimension (2
D) GC column was an Rxi-17 (1.5 m ! 0.25 mm ID ! 0.25 mm df) (Restek). The oven temperature program was 130"C for 1 min, 10"C min#1to 238 "C, 2 "C
min#1to 244"C for 5 min, 2"C min#1to 268"C, and 8"C min#1
to 310"C for 0.5 min. 1.5 mL of the nal extract in nonane (out of
5–10 mL) was injected into a split/splitless injector held at 250"C
in splitless mode. Helium was used as the carrier gas at 1.0 mL
min#1. For negative chemical ionization (NCI) mode, MS
parameters were an ion source temperature of 140"C,
ionisa-tion voltage of 70 eV, methane (reagent gas) at 1 mL min#1,
acquisition range from 30.00 to 400.00 m/z, a recording interval of 0.04 s (25 Hz), an accumulation time of 0.037 s, a data sampling interval of 0.5 ns, and a detector voltage of 2300 V. For electron ionization (EI) mode, MS parameters were an ion source temperature of 250 "C, ionization voltage of 70 eV,
a detector voltage of 2300 V and the same recording parameters as with NCI. The mass accuracy of the instrument was ensured by daily single point calibration checks. Two-dimension GC ! GC chromatograms were generated using GC Image soware v2.3 (Zoex Corp.).
Cryogenic zone compression (CZC)
The cryogenic modulator was located between the two dimen-sions to sequentially trap compounds coming out of1D, refocus
them, and reintroduce them into2D.25–27Practically, one
inter-mittent hot jet and one permanent cold jet were focused on two single points of the column (due to a loop), and the device was reinjecting compounds in2D when the hot jet was red. This
process produced peaks of 200 ms width by the time they reached the mass spectrometer at the end of 2D. Because of
mass conservation, this zone compression process produced narrower and higher peaks, resulting in the enhancement of the overall sensitivity.28 Contrary to regular GC ! GC, where the
conservation rule29implies the production of several slices for
each1D signal to ensure proper resampling and possible
reso-lution of coeluting species, the CZC modulation process was exclusively used for signal enhancement. Therefore, the modulation period (PM, time between two hot jets, the duration
of a complete cycle of modulation) was enlarged from 4 to 8
seconds so that our 1D signals were only sampled once,
1 5 10 15 20 25 30 35 40 45 50 55 1 5 10 15 20 25 30 35 40 45 50 55
resulting in the production of a single modulated slice, thus increasing sensitivity as much as practically feasible (Fig. 1).
Results and discussion
Calibration curve
Calibration curves were obtained for DDE and for PCB-153. The working dynamic range spanned from 50 fg to 10 pg. Six cali-bration points (triplicates) gave a R2of 0.99842 for PCB-153 and
0.96821 for DDE with RSD for all calibration levels below 15% but with a constant lower precision for DDE, mainly due to the weaker response and subsequent lower peak area for this analyte.
Preparation of dried-blood spots (DBSs)
A nite and exact amount of serum or blood was pipetted to a lter paper in order to ensure good control on the volume. Transfer tips were never in direct contact with the paper. In this way, the sample freely spread on the lter paper to warrant constant volume delivery and to avoid oversaturating the lter paper. Aer a drying period of 1 hour, the piece of paper was subsequently cut around the dried sample. A blank of the same size was always collected next to the sample to correct for possible background levels.
Liquid–liquid extraction (LLE)
LLE was miniaturized and optimized to accommodate DBS sample sizes. This is an easy-to-use method compatible with the use of lter paper for dried samples, but difficult to automate due to the very small amount of solvents and samples handled. The rst critical step was the choice of solvents for extraction. For dilution and elution of the sample out of the lter paper, a phosphate buffer saline solution (PBS) and formic acid were used and a hexane/DCM mixture 70 : 30 was selected for the extraction itself. The results from target analyte measurements were cross-compared with regard to recovery rates and to bias from the reference method results. This combination of solvents gave a bias <$20% (RSD < 20%) and recovery rates around 50%. The negative bias increased over 30% when samples were not eluted out of the paper with formic acid. This was therefore judged necessary to effectively free target
molecules from encapsulation in lipidic structures, which are known to be hydrolyzed by acid treatment.30Different sets of
hexane/DCM and hexane/acetone mixtures were further tested for the LLE but conducted at lower recovery rates.
The optimization of the extraction step was carried out using sample sizes of 100 mL and was then further transposed to volumes down to 20 mL to reach the level of non-invasiveness that was targeted. This was made by proportionally sizing down volumes of aqueous and organic phases according to the volume of serum collected on the lter paper. Therefore, 20 mL samples required the use of 150 mL PBS and 150 mL formic acid 98% to elute the serum out of the paper, dilute it, denature proteins, break down lipidic structures, and also partially decompose the lter paper. At this stage, the emulsion con-taining part of the lter paper always appeared and the addition of a few drops of methanol was necessary to separate it and to retrieve a liquid sample that could be properly extracted. The manual extraction produced fractions that were collected directly in a GC vial (1.2 mL) prior to full evaporation under a nitrogen stream. The recovery standard and nonane, used as keeper, were added just before injection. In total, less than 1.4 mL of solvents were used for the parallel extraction of 5 samples of 20 mL DBS in 3 h. Besides the fact that the method cannot easily be automated, the major issue was that organic and aqueous phases were difficult to separate, even aer centrifugation, preventing full recapture of solvents and there-fore limiting recovery rates to the low 50% level. The scaling down of the procedure to 20 mL sample sizes had also the advantage to produce cleaner extracts than when using 100 mL sample sizes. Despite the fact that the use of a disposable glass micro-column was necessary to digest the remaining lipids and keep the 100 mL sample extracts at an acceptable level of cleanness, as is the case for regular sample sizes,3120 mL sample
extracts were analyzed as such and the clean up step was not necessary anymore, further simplifying the procedure.
A major issue in DBS analyses was to maintain the presence of a sufficient quantity of analytes for their efficient quanti-cation. Indeed, as we reduced sample sizes, the difference between blank levels and sample levels shrunk considerably. This was actually the limitation in the miniaturization of the DBS analysis, not to say that handling few microliters of solvents was quite challenging. Samples were extracted in
Fig. 1 Adjustment of the modulation period (PM) to move from multiple sampling (GC ! GC, left) to single sampling (CZC, right) of1D signals for
maximal signal enhancement of target analytes.
1 5 10 15 20 25 30 35 40 45 50 55 1 5 10 15 20 25 30 35 40 45 50 55
a routine accredited (ISO 17025) lab where dioxin, OCPs, PCBs and other POPs are analyzed on a daily basis and where blank levels are kept under control. The laboratory environment itself appeared to have a greater inuence on background levels than solvents and other consumables. Shaking and transfer steps of the LLE procedure increased the contact between air and the solution and were minimized as much as possible but remained the major port of entry for external contaminants. For this LLE approach, PCB-153 blank levels were in the range of 5–10 pg/ 20 mL DBS, whereas typical background contamination levels in DBS were in the range of 10–50 pg/20 mL. We therefore reached the limit where blank levels were of the same order as the sample levels. LLE-based measurements were performed using paired sample-blank correction values instead of working with the moving blank average quality control chart to be able to quantify samples exhibiting the higher levels. This undesirable situation could somewhat be improved by using a dedicated clean-room for DBS measurements but such a room was not available at the time of the study.
Micro-extraction by packed sorbent (MEPS)
As a ‘good method of extraction’ is easy to use, fast and robust, automated, and cost effective,32we had to nd an alternative to
the LLE approach as it only fullled part of these criteria, and especially suffered from blank issues. Another disadvantage of the LLE procedure was that an operator was involved in many steps, increasing risks of contamination and high variability. It was furthermore difficult to automate the procedure since it required precise liquid handling, a similar situation to single-drop micro-extraction (SDME),33liquid-phase micro-extraction
(LPME),34,35 and electro-membrane extraction (EME).36–38 We
therefore investigated an alternative solid-phase extraction (SPE)-based method, suitable for the analysis of our targets,39,40
and that allowed us to deal with small amounts of solvents and samples. Micro-extraction by packed sorbent (MEPS) was per-formed automatically on a automated liquid handler using
MEPS syringes.41 Practically, the sorbent (0.5–2 mg) was
included inside the needle of the syringe and was reused for up
to 10 times for different samples before being replaced. Samples were loaded on the sorbent aer elution out of the paper by pumping the solution through the sorbent in the syringe (up to 50 times), and further eluted with the hexane/DCM mixture. The sequence was developed and optimized during this study and consisted of 6 steps, as illustrated in Fig. 2. All solvents were similar to the ones used in LLE to keep parameters similar.
Internal standards were added on the lter paper aer it was cut and before elution so that the organic solvent could evap-orate. The organic phases collected (50 mL) aer the MEPS sequence were collected in another vial and the solution was evaporated until dryness and reconstituted with 3 mL recovery standard and 2–5 mL of nonane to concentrate the extract as much as possible. Nearly all the solution was injected (1–2 mL) to ensure maximum response.
The method was optimized regarding loading, washing and elution as dilution, and pre-soaking steps were identical to the LLE method. One common parameter to optimize in each step was the number of pump–release cycles of the syringe. For loading, 50 times pumping was found to be the best since pumping also mixed formic acid and serum, allowing the small organic molecules to be encapsulated to reach the outer solvent. It was also ideal to avoid clogging the MEPS cartridge with the sample. Once loaded, the sorbent was washed 4 times with water only. Methanol was also tested as a washing solvent, based on previous experience,21 but recovery rates drastically
dropped (factor 5–10) due to a pre-elution of compounds in this polar organic solvent. Finally, the elution was performed with twice with 25 mL to minimize the volume of solvent used while limiting the risk of carry over. Although the MEPS assembly is designed to be used several times aer cleaning and condi-tioning, a special care (washing at least 20 times with hexane) was needed to prevent cross-contamination, which appeared to be a weak point of the design. Ideally, to prevent carry over, MEPS should be considered as disposable.
Samples were extracted within 20 minutes but this method showed lower recovery rates than the LLE approach (15–30%). However, cleaner chromatograms were observed due to the lower amount of interfering compounds retained, and to a more selective extraction. In addition, extractions were automated and less subject to environmental contamination (lower back-ground levels) than LLE since all solutions remained in capped vials or in the MEPS syringe during the entire procedure. Moreover, less transfer and no shaking steps were required. The total volume of solvent required for the extraction was as low as 500 mL. For MEPS, blank levels were found to be in the range of 2–10 pg/20 mL DBS. Because of the use of 13C-based ID, the
impact of these limited recovery rates was limited to possible compound detectability issues.
Cryogenic zone compression (CZC) GC and comprehensive two-dimensional GC (GC ! GC) coupled to negative chemical ionization high resolution time-of-ight mass spectrometry (NCI-HRTOFMS)
CZC and GC ! GC were used to enhance chromatographic signals and to increase the peak capacity of the chromatographic
Fig. 2 Cycling sequence for the use of MEPS syringes for the extraction of selected POP markers of exposure in 20 mL human serum samples. 1 5 10 15 20 25 30 35 40 45 50 55 1 5 10 15 20 25 30 35 40 45 50 55
system prior to detection by using a mass analyzer.3,42Despite
the fact that the number of target compounds was limited, the use of two chromatographic dimensions (apolar phase as1D and
semi-polar phase as2D) was valuable to isolate matrix-related
interference away from the targets.43 The gain in intensity
following CZC was about 200 times between modulated and non-modulated peaks at a 25 Hz acquisition rate, and still 10 times between modulated and non-modulated peaks at, respectively, 25 Hz and 2 Hz, when 7 points data points
7 were
consistently collected to properly dene peak shapes.44 The
instrumental limit of detection (iLOD) was assessed by means of the signal to noise ratio (S/N) and was 20 fg mL#1for PCB-153
(S/N ¼ 10), and 2 pg mL#1for DDE (S/N ¼ 10), based on the
use of the M + 2 ion. On the other hand, we reached an iLOD of 40 fg mL#1for DDE (S/N ¼ 10) when reconstructing traces based
on the chlorine ion signal. Monitoring the chlorine signal instead of the M + 2 parent signal obviously precludes the use of
13C-labeled standards for quantitation and possibly reduces the
specicity of the qualication. It is however important to remember that possible DDE coeluters have good chances to be separated in 2D and that, in addition to the rst dimension
retention time value (1t
R) and full mass spectra, a second
dimension retention time value (2t
R) is available and brings an
extra clue for proper identication of DDE.45
Background levels in blood from individuals living in industrialized countries can be very different. Taking very recent studies in Belgium46 and in Spain47,48 into account,
typical levels can be considered to be in the range of 50–100 ng
g#1fat for PCB-153 and DDE. Based on a 20 mL DBS sample size,
we needed an iLOD at levels of 5–10 pg to properly quantify those compounds. With iLODs achieved in this proof-of-concept study, we are therefore able to quantify those targets in such samples. More importantly, in the context of POP inventories in developing countries where levels are somewhat expected to be higher due to the lack of regulation, PCB-153 and DDE would adequately be detected.
The HRTOFMS instrument was tuned to get the best compromise between resolution and intensity. The intensity was maximized while the mass resolution was maintained at 4000. As the targets of this study contained halogen atoms, we decided to use the negative chemical ionization (NCI) mode, a specic and sensitive ionization method for halogens. Chemical ionization (used with methane as the reagent gas) is a so ionization mode that prevents fragmentation by ther-malizing electrons to lower their energy. A special yttria coated rhenium lament was used to get a lower emission current as well.49As a result, fragmentation of halogen compounds was
very limited and parent molecular ions were maximized. This provided, together with the zone compression by CZC, the best sensitivity for the method. PCB-153 was quantitated on the basis of the molecular ion and DDE was quantitated either on the basis of the molecular ion or the chlorine ion. In this case, DDE could be uniquely identied using the two retention times provided by GC ! GC. The mass accuracy of the analyzer was maintained at 5 ppm for all measurements.
Fig. 3
8 Two-dimensional GC ! GC contour plot (left) and one-dimensional CZC chromatographic traces (right) for a real unfortified 20 mL human serum sample using NCI-HRTOFMS (TIC traces).
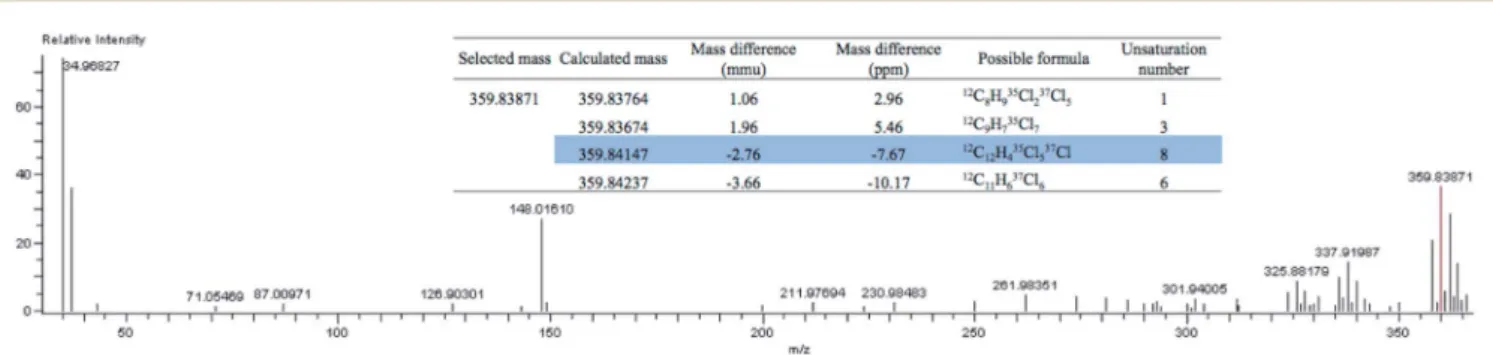
Fig. 4 Extraction of a molecular formula from the M + 2 signal of the parent ion cluster of CZC-NCI-HRTOFMS data collected from the MEPS of the unfortified 20 mL human DBS sample.
1 5 10 15 20 25 30 35 40 45 50 55 1 5 10 15 20 25 30 35 40 45 50 55
Additionally, based on the GC ! GC separation in a 2D space, this approach is particularly suitable to enlarge the list of targets to other POPs and further screen for unknown emerging analytes that would be similarly isolated. Although for target analysis we simply used the 1D reconstructed chromatographic trace as we only got one slice of modulation per peak, a proper GC ! GC investigation requires several slices to be produced from each1D signal. The modulation period (P
M) was reduced
and the sensitivity was partly traded when this screening mode was investigated. Reconstructed 2D representations were used for screening and for pattern recognition (Fig. 3). In Fig. 3, despite the apparent low amount of peaks, we identied other dominant PCBs and separated some of them (80 and PCB-101 for example) from interference thanks to the2D. Data in
Fig. 3 were recorded in NCI mode, which provided a low back-ground level and a more specic response to halogenated compounds. In addition, our instrument allowed us to switch easily, in about 20 minutes, between ionization modes. There-fore, next to NCI also used together with CZC to maximize sensitivity, we injected the same sample in electron ionization (EI) mode at 70 eV to increase the fragmentation to perform library searching and structural analysis. Specication of the instrument was 5 ppm for mass accuracy, and 4000 for resolu-tion. We had access to both the molecular formula and isotopic pattern calculations. An example of the usefulness of the HRTOFMS and the formula calculation is illustrated in Fig. 4, where the full mass spectrum of an abundant peak in a real 20 mL DBS sample revealed another hexachlorinated PCB (parent ion at 359.83871 Da). The proposed highlighted formula is the rst possible formula of a native compound with regard to the isotopic distribution of chlorine atoms. The mass accuracy observed in this case was slightly lower (7.6 ppm) than the 5 ppm specication, likely due to the matrix effect. The hyphen-ation of GC ! GC to high resolution TOFMS was thus a really powerful tool that was sensitive enough, thanks to the cryogenic compression of signals, to analyze POPs in small sample amounts (20 mL). It could easily be further complemented by pre-screening data tools such as the one based on sentinel ltration of MS signals using mass defects.50,51
Conclusion
These results demonstrate the feasibility of analyzing selected POPs in a small sample amount (20 mL) such as human dried-blood spots (DBSs). The sample preparation appeared to be the crucial point in the procedure. Liquid–liquid extraction (LLE) was rst developed with good success but micro-extraction by packed sorbent (MEPS) was more suitable in our quest for miniaturization. Indeed, the procedure was auto-mated and only 500 mL of solvent were required for the whole extraction. Our instrumentation, combining advantages of GC ! GC and CZC with negative chemical ionization (NCI), and high resolution time-of-ight mass spectrometry (HRTOFMS), provided a very sensitive and specic solution for the measurement of selected POP markers of exposure in blood and serum using isotopic dilution (ID). Target analysis was demonstrated with PCB-153 and DDE, but screening
capabilities of the system arose and will make analyses of other POPs, and unknown and/or emergent compounds possible in the future.
Acknowledgements
We thank JEOL Ltd. for instrumental support; Restek for providing us with GC columns; SGE for MEPS syringes; Research Training Fund for Industry and Agriculture (F.R.I.A) for nancial support of Ph.D.
Notes and references
1 A. F. Olshan, Environ. Health Perspect., 2007, 115, 1767–1779. 2 D. Lu, D. Wang, H. S. S. Ip, F. Barley, R. Ramage and J. She, J. Chromatogr. B: Anal. Technol. Biomed. Life Sci., 2012, 891–892, 36–43.
3 D. G. Patterson, S. M. Welch, W. E. Turner, A. Sj¨odin and J.-F. Focant, J. Chromatogr. A, 2011, 1218, 3274–3281. 4 J.-F. Focant, J. W. Cochran, J.-M. D. Dimandja, E. DePauw,
A. Sj¨odin, W. E. Turner and D. G. Patterson, Analyst, 2004, 129, 331–336.
5 J.-F. Focant, A. Sj¨odin, and D. G. Patterson, Hyphenated Methods, in The Encyclopedia of Mass Spectrometry, Elsevier, 2006, vol. 8, pp. 553–564.
6 J.-F. Focant, C. Pirard, G. Eppe and E. DePauw, J. Chromatogr. A, 2005, 1067, 265–275.
7 UNEP CHemical and Waste toolkits: toolkit.pops.int (accessed 9thFebruary 2015).
8 A. Fernandez, A. Singh and R. Jaff´e, Mar. Pollut. Bull., 2007, 54, 1681–1691.
9 R. Guthrie, Pediatrics, 1963, 32, 338.
10 C. H. Arnaud, Chem. Eng. News, 2011, 89, 13–17.
11 C. P. Stove, A.-S. M. E. Ingels, P. M. M. De Kesel and W. E. Lambert, Crit. Rev. Toxicol., 2012, 42, 230–243. 12 V. Dua, C. Pant, V. Sharma and G. Pathak, Bull. Environ.
Contam. Toxicol., 1996, 56, 50–57.
13 V. Burse, M. DeGuzman, M. Korver, A. Najam, C. Williams, W. Hannon and B. Therrell, Biochem. Mol. Med., 1997, 61, 236–239.
14 S. Salihovic, L. Mattioli, G. Lindstrom, L. Lind, P. M. Lind and B. van Bavel, Chemosphere, 2012, 86, 747–753.
15 D. J. Schonfeld, P. M. Rainey, M. R. Cullen, D. R. Showalter and D. V. Cicchetti, Am. J. Dis. Child., 1995, 149, 447–450. 16 S. N. Chaudhuri, S. J. M. Butala, R. W. Ball and C. T. Braniff,
J. Exposure Sci. Environ. Epidemiol., 2009, 19, 298–316. 17 H. Spliethoff, L. Tao, S. Shaver, K. Aldous, K. Pass, K. Kannan
and G. Eadon, Environ. Sci. Technol., 2008, 42, 5361–5367. 18 A. Shlosberg, Q. Wu, W. K. Rumbeiha, A. Lehner, O. Cuneah,
R. King, O. Hatzofe, K. Kannan and M. Johnson, Arch. Environ. Contam. Toxicol., 2012, 62, 502–511.
19 T. C. Dainty, E. S. Richmond, I. Davies and M. P. Blackwell, Int. J. Toxicol., 2012, 31, 4–13.
20 A. Shlosberg, W. K. Rumbeiha, A. Lublin and K. Kannan, J. Environ. Monit., 2011, 13, 1547–1558.
21 J.-F. Focant, G. Eppe, A. Massart, G. Scholl, C. Pirard and E. De Pauw, J. Chromatogr. A, 2006, 1130, 97–107. 1 5 10 15 20 25 30 35 40 45 50 55 1 5 10 15 20 25 30 35 40 45 50 55
22 H. Shunji, T. Yoshikatsu, F. Akihiro, I. Hiroyasu, T. Kiyoshi, S. Yasuyuki, U. Masa-aki, K. Akihiko, T. Kazuo and O. Hideyuki, J. Chromatogr. A, 2008, 1178, 187–198. 23 G. Eppe, E. De Pauw, and J.-F. Focant, Hyphenated Methods,
in The Encyclopedia of Mass Spectrometry, Elsevier, 2006, vol. 8, pp. 531–541.
24 J.-F. Viel, N. Floret, E. Deconinck, J.-F. Focant, E. De Pauw and J.-Y. Cahn, Environ. Int., 2011, 37, 449–453.
25 E. Ledford Jr and C. Billesbach, J. High Resolut. Chromatogr., 2000, 23, 202–204.
26 P. Marriott and R. M. Kinghorn, J. Chromatogr. A, 2000, 866, 203–212.
27 T. Hy¨otyl¨ainen, M. Kallio, K. Hartonen, M. Jussila, S. Palonen and M.-L. Riekkola, Anal. Chem., 2002, 74, 4441–4446.
28 J. Phillips and J. Beens, J. Chromatogr. A, 1999, 856, 331–347. 29 J. C. Giddings, J. High Resolut. Chromatogr., 1987, 10, 319–
323.
30 M. I. Avelda˜no and L. A. Horrocks, J. Lipid Res., 1983, 24, 1101–1105.
31 J.-F. Focant and E. DePauw, J. Chromatogr. B: Anal. Technol. Biomed. Life Sci., 2002, 776, 199–212.
32 L. G. Blomberg, Analytical and B. Chemistry, 2008, 393, 797– 807.
33 L. Xu, C. Basheer and H. K. Lee, J. Chromatogr. A, 2007, 1152, 184–192.
34 S. Pedersen-Bjergaard and K. E. Rasmussen, J. Chromatogr. B: Anal. Technol. Biomed. Life Sci., 2005, 817, 3–12.
35 A. Rodr´ıguez, S. Pedersen-Bjergaard, K. E. Rasmussen and C. Ner´ın, J. Chromatogr. A, 2008, 1198–1199, 38–44.
36 I. J. Ø. Kjelsen, A. Gjelstad, K. E. Rasmussen and S. Pedersen-Bjergaard, J. Chromatogr. A, 2008, 1180, 1–9.
37 T. M. Middelthon-Bruer, A. Gjelstad, K. E. Rasmussen and S. Pedersen-Bjergaard, J. Sep. Sci., 2008, 31, 753–759. 38 M. Balchen, L. Reubsaet and S. Pedersen-Bjergaard,
J. Chromatogr. A, 2008, 1194, 143–149.
39 Y. Pico, M. Fernandez, M. J. Ruiz and G. Font, J. Biochem. Biophys. Methods, 2007, 70, 117–131.
40 B. Gomara, L. Ramos and M. J. Gonzalez, J. Chromatogr. B: Anal. Technol. Biomed. Life Sci., 2002, 766, 279–287.
41 M. Abdel-Rehim, Bioanalysis, 2009, 1, 687–691. 42 J. A. Murray, J. Chromatogr. A, 2012, 1261, 58–68.
43 J.-F. Focant, A. Sj¨odin, W. I. Turner and D. G. Patterson, Anal. Chem., 2004, 76, 6313–6320.
44 M. Adahchour, M. Brandt, H. Baier, R. Vreuls, A. Batenburg and U. Brinkman, J. Chromatogr. A, 2005, 1067, 245–254. 45 B. L'homme, C. Brasseur and J. F. Focant, Organohalogen
Compd., 2011, 73, 1142–1145.
46 K. Croes, E. Den Hond, L. Bruckers, I. Loots, B. Morrens, V. Nelen, A. Colles, G. Schoeters, I. Sioen, A. Covaci, T. Vandermarken, N. Van Larebeke and W. Baeyens, Environ. Int., 2014, 71, 20–28.
47 M. B. Zubero, J. J. Aurrekoetxea, M. Murcia, J. M. Ibarluzea, F. Go˜ni, C. Jim´enez and F. Ballester, Arch. Environ. Contam. Toxicol., 2015, DOI: 10.1007/s00244-014-0107-6, in press. 9
48 O. Huetos, M. Bartolom´e, N. Aragon´es, M. Cervantes-Amat, M. Esteban, M. Ruiz-Moraga, B. P´erez-G´omez, E. Calvo, M. Vila and A. Casta˜no, Sci. Total Environ., 2014, 493, 834– 844.
49 J. J. Manura, The Mass Spec Source, 2005, 27, 3–4. 10
50 S. Hashimoto, Y. Zushi, A. Fushimi, Y. Takazawa, K. Tanabe and Y. Shibata, J. Chromatogr. A, 2013, 1282, 183–189. 51 Y. Zushi, S. Hashimoto, A. Fushimi, Y. Takazawa, K. Tanabe
and Y. Shibata, Anal. Chim. Acta, 2013, 778, 54–62. 1 5 10 15 20 25 30 35 40 45 50 55 1 5 10 15 20 25 30 35 40 45 50 55