Breeding and Genetics: Genomic Selection and Whole-Genome Association I
29 Effect of different genomic relationship matrices onaccu-racy and scale. I. Misztal*1, C. Y. Chen2, I. Aguilar5, Z. G. Vitezica3, A. Legarra3, and W. M. Muir4, 1University of Georgia, Athens, 2
New-sham Choice Genetics, Chesterfield, MO, 3INRA, Castanet-Tolosan,
France, 4Purdue University, West Lafayette, IN, 5INIA, Las Brujas,
Uruguay.
Phenotypic data on body weight (BW) and breast meat area (BM) were available on up to 287,614 broilers. A total of 4,113 animals were genotyped for 57,636 SNP. The records were analyzed by a single step genomic BLUP (ssGBLUP), which accounts for all phe-notypic, pedigree and genomic information. The genomic relationship matrix (G) in ssGBLUP was constructed using either equal (0.5; GE) or current (GC) allele frequencies, and with either all SNP or SNP with minor allele frequencies (MAF) below multiple thresholds (0.1, 0.2, 0.3, and 0.4) ignored. Additionally, a pedigree based relationship matrix for genotyped animals (A22) was available. The matrices and their inverses were compared with regard to average diagonal (AvgD) and off-diagonal (AvgOff) elements. In A22, AvgD was 1.00 and AvgOff was 0.01. In GE, both averages decreased with the increasing thresholds for MAF; AvgD decreasing from 1.37 to 1.02 and AvgOff decreasing from 0.72 to 0.03. In GC, AvgD was around 1.01 and AvgOff was 0.00 for all MAF. For inverses of relationship matrices, all AvgOff were close to 0; AvgD was 2.4 in A22, varied from 11.6 to 13.0 for GE, and increased from 8.7 to 12.9 for GC as the threshold for MAF increased. Predictive abilities with all GE and GC were similar. Compared with BLUP, EBVs of genotyped animals in ssGBLUP were, on average, biased up to 1 additive SD higher with GE and down by 2 additive SD with GC. The bias was eliminated by adding constant 0.014 (equal to AvgOff in A22) to GC. This constant is equivalent to twice the mean relationship between gametes in the genotyped and ungenotyped populations. Reduction of SNP with low MAF has a low effect on the realized accuracy. Unbiased evaluation in ssGBLUP may be obtained with GC scaled for compatibility with A22.
Key words: genomic selection, single step, bias
30 Comparisons of numerator and genomic and relationship matrices. H. Wang* and I. Misztal, University of Georgia, Athens. The objective of this study was to quantify differences between the numerator (A) and genomic (G) relationship matrices for possible application in detection of pedigree and genotyping errors. Data were obtained from Cobb-Vantress, including 2422 individuals in 3 genera-tions from the same line and genotyped for 57,636 SNP. The A matrix was constructed using pedigrees for 3 generations. The G matrix was constructed using current allele frequencies and scaled for identical means of diagonal and off-diagonal elements of A for the common animals. In A (G), the mean diagonal (AvgD) element was 1.01 ± 0.015, ranging from 1.00 to 1.09 (1.01 ± 0.07, ranging from 0.48 to 1.86). The mean of the off-diagonal elements (AvgOff) was 0.031 ± 0.051, ranging from 0 to 0.062 (0.031 ± 0.055, ranging from −0.13 to 0.69). For G–A, AvgD was 0 ± 0.073, ranging from −0.52 to 0.86, and AvgOff was 0 ± 0.032, ranging from −0.50 to 0.52. The distribution of AvgOff for G–A was approximately normal with long tails, with only 0.53% elements outside the range from −0.10 to 0.10. The SD of the off diagonal elements of G–A increased from 0.03 where aij < 0.01 to 0.04 where aij > 0.10. Visually, matrix A contained blocks with elements close to 0 and blocks with higher correlations. Similar blocks occurred in G; however, the blocks with elements close to 0
were smaller. Moreover, G–A showed several rows and columns with high values. After removing animals with the average relationship to other animals >0.030, the differences between G and A decreased. When A is obtained with long generation pedigrees and G is scaled for compatibility with A, differences between G and A are very small. Larger differences may indicate pedigree errors, genotyping errors, or mixing of lines/breeds.
Key words: genomic selection, genomic relationship matrix, errors 31 A recursive method of approximation of the inverse of genomic relationships matrix. P. Faux*1, N. Gengler1,2, and I. Misz-tal3, 1University of Liege, Gembloux Agro-Bio Tech, Animal Science
Unit, Gembloux, Belgium, 2National Fund for Scientific Research,
Brussels, Belgium, 3University of Georgia, Animal and Dairy Science
Department, Athens.
Genomic evaluations by some procedures such as genomic BLUP (GBLUP) or single-step GBLUP (ssGBLUP) use the inverse of the genomic relationship matrix (G). The cost to create such an inverse is cubic and becomes prohibitively expensive after 30–100k genotypes. The purpose of this study was to develop methodologies, which even-tually could compute a good approximation of G−1 at reduced cost. A recursive approximation of the inverse is based on a decomposition similar to that for the pedigree-based relationship: G−1 = (T−1)’D−1T−1, where T is a triangular and D a diagonal matrix. In the first step, ani-mals are processed from the oldest to the youngest. For each animal, a subset of ancestors is selected with coefficients of genomic relation-ship to that animal greater than a threshold. A system of equations is created where the coefficients of G for the selected ancestors are in the left hand side and the coefficients of G for the given animal cor-responding to the ancestors are the right hand side. The solution to that system of equation is stored in one line of T. Then, D is computed as diagonal elements of T−1G(T−1)’. If off-diagonals of D are too large, the approximation to G can be improved by repeated applications of G−1 = (T−1)’D−1T−1 and D = T−1G(T−1)’. After n rounds, the approxi-mation of G inverse is a product of 2n triangular matrices and one diagonal matrix. This recursive method has been assessed on a sample of 1,718 genotyped dairy bulls. The correlation between GEBV using the complete or approximated G were 0.54 in the first round, 0.96 in the second, and 0.99 in the third. The cost of the proposed method depends on the population structure. It is likely to be high for closely related animals but lower for populations where few animals are strongly related. Additional research is needed to identify near-sparsity in T and D to eliminate unimportant operations.
Key words: genomic prediction, computing methods, dense matrix inversion
32 Adapting Bayesian mixture model algorithms to estimate hyperparameters that characterize genetic architecture in genomic selection models. R. J. Tempelman*1, W. Yang1, J. P. Steibel1, and N. M. Bello2, 1Michigan State University, East Lansing, 2Kansas State
University, Manhattan.
Various genomic selection models (e.g., BLUP, BayesA, BayesB) have been formally compared with each other with the understanding that different traits are better fit by one model versus another. However, it has been generally underappreciated that BLUP and BayesA are
163 J. Anim. Sci. Vol. 89, E-Suppl. 1/J. Dairy Sci. Vol. 94, E-Suppl. 1
merely special cases of BayesB; that is, certain key hyperparameters can be estimated rather than arbitrarily specified. These key hyper-parameters are: 1) the proportion (π) of single nucleotide polymor-phism (SNP) markers that are directly associated with causal variants, 2) the scale parameter that determines the typical genetic variance for each non-null SNP marker, and 3) a degrees of freedom parameter that determines how much heterogeneity there exists in this genetic vari-ability across SNPs. We demonstrate the use of fundamental Bayesian mixture model algorithms for estimating these key hyperparameters from the data, highlighting, in particular, methods based on slab and spike priors as well as the stochastic search and variable selection algorithm. We use simulation studies to demonstrate the properties of these methods on estimates of these 3 key hyperparameters. First, we consider simulated populations assuming linkage equilibrium between all markers with a proportion π of the markers being synonymous with causative variants. These simulations provide a positive control for which the model for both data generation and analysis are in near agreement; we subsequently demonstrate that inferences were in good agreement with the true values specified for each hyperparameter. We then consider more extensive comparisons between the various meth-ods under more realistic linkage disequilibrium situations between SNP markers with different levels of marker density (0.15 < r2 < 0.30). In general, estimates of all 3 hyperparameters decreased as marker density increased, thereby further highlighting the need to infer upon these hyperparameters rather than arbitrarily specifying them. Key words: genetic architecture, genomic selection, mixture models 33 Improving accuracy of genomic selection by hierarchical Bayesian modeling of spatially correlated chromosomal effects. W. Yang* and R. J. Tempelman, Michigan State University, East Lansing. Hierarchical mixed effects models have been effectively used to pre-dict genomic merit of livestock using high density SNP marker panels. Two currently popular approaches, BayesA and BayesB, are based on specifying all SNP-associated effects to be independent of each other. BayesB has been particularly effective as it extends BayesA in allowing a large proportion of SNP markers to be associated with null effects. We propose extensions of these 2 models to attempt to specify these effects as spatially correlated due to the chromosomally proxi-mal effects of causal variants. These 2 methods, respectively labeled ante-BayesA and ante-BayesB, are based on a first order unstructured antedependence specification between SNP effects. Based on a simu-lation study with 10 replicated data sets, each differing by 6 different LD levels ranging from r2 = 0.16 to 0.30, the antedependence meth-ods had significantly (P < 0.001) higher accuracies than their corre-sponding classical counterparts at higher LD levels (r2 > 0. 27) with differences exceeding 3%. A cross-validation comparison was also conducted on the heterogeneous stock mice data resource (http://mus. well.ox.ac.uk/mouse/HS/) using 6 week weights as the phenotype. The data set included 2,296 individuals and 950 randomly selected SNPs to ensure an adjacent average pair-wise LD r2 = 0.3, as representative of current livestock data. The antedependence methods increased cross-validation prediction correlations by up to 3.6% compared with their classical counterparts (P < 0.001). We used a final set of simulation studies to demonstrate that it is possible to infer upon key parameters (e.g., proportion of SNPs with null effects, average genetic variance at each SNP) that define the genetic architecture of our antedependence methods. In general, ante-BayesA and ante-BayesB required less than 10% greater computational time compared with their classical coun-terparts such that they should become increasingly attractive for whole genome selection, particularly as the density of SNP chips increases.
Key words: Bayesian inference, genomic selection, antedependence 34 Incorporating molecular breeding values with variable call rates into genetic evaluations. S. D. Kachman*1, G. L. Bennett2, K. J. Hanford1, L. A. Kuehn2, E. J. Pollak2, W. M. Snelling2, M. L. Span-gler1, and R. M. Thallman2, 1University of Nebraska, Lincoln, 2U.S.
Meat Animal Research Center, Clay Center, NE.
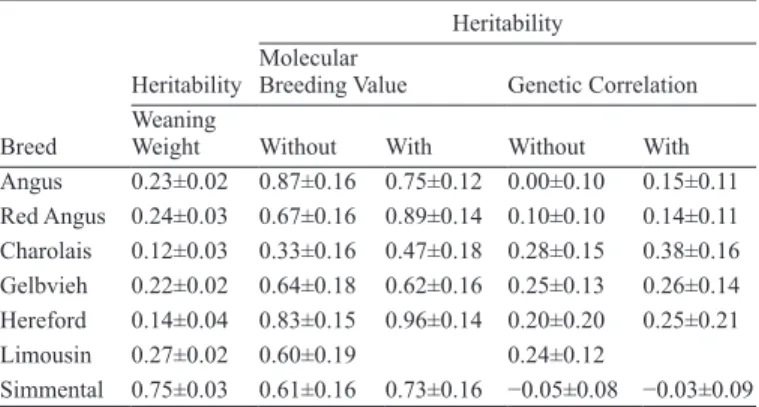
A partial genotype (PG) for an animal can result from panels with low call rates used to calculate a molecular breeding value (MBV). A MBV can still be calculated using PG by replacing the missing marker covariates with their mean value. This approach is expected to change the distribution of the MBV by reducing the variance and percentage of genetic variation explained by the MBV. Under independence, the variance of a MBV is 2Σbi2pi(1-pi) where bi and pi are the effect and the allelic frequency of marker i, respectively. For animal a the pro-portion, Pa, of the complete genotype (CG) MBV variance accounted for by PG is then the ratio of the variances calculated by summing over the partial and the complete set of markers. Similarly, the genetic covariance between a trait and PG MBV is also proportional to Pa. The proportion of CG covariance between animals a and b with PG was assumed to be proportional to PaPb. The PG model for the MBV of animal a, scales the CG genetic effect by Pa and adds a missing genotype effect with variance Pa(1-Pa) times the CG genetic variance. A weaning weight MBV was constructed from 159 Single Nucleotide Polymorphisms using genotype and weaning weight data from 3,327 Cycle VII calves from the US Meat Animal Research Center. Geno-type (n = 2,503) and weaning weight (n = 148,897) data from purebred calves of 7 breeds were used to evaluate the MBV. The genotype data had an average call rate of 85.2% (11.3–100%). Two trait analyses were run for each breed separately, both with and without accounting for PG in the model. Overall, MBV heritabilities and its genetic cor-relation with weaning weight were larger when the effects of PG were incorporated into the analysis (Table 1).
Table 1. Estimated genetic parameters
Breed
Heritability
Heritability Molecular
Breeding Value Genetic Correlation Weaning
Weight Without With Without With
Angus 0.23±0.02 0.87±0.16 0.75±0.12 0.00±0.10 0.15±0.11 Red Angus 0.24±0.03 0.67±0.16 0.89±0.14 0.10±0.10 0.14±0.11 Charolais 0.12±0.03 0.33±0.16 0.47±0.18 0.28±0.15 0.38±0.16 Gelbvieh 0.22±0.02 0.64±0.18 0.62±0.16 0.25±0.13 0.26±0.14 Hereford 0.14±0.04 0.83±0.15 0.96±0.14 0.20±0.20 0.25±0.21 Limousin 0.27±0.02 0.60±0.19 0.24±0.12 Simmental 0.75±0.03 0.61±0.16 0.73±0.16 −0.05±0.08 −0.03±0.09
Key words: genomic evaluation, mixed models, beef cattle
35 Impacts of inclusion of foreign data in genomic evaluation of dairy cattle. K. M. Olson*1, P. M. VanRaden2, and D. J. Null2,
1National Association of Animal Breeders, Columbia, MO, 2Animal
Improvement Programs Laboratory, ARS, USDA, Beltsville, MD.
The accuracy of genomic predictions tends to increase with larger numbers of animals in the training data set. Because of this, many countries have combined data to increase the size of their training pop-ulations. The objective of this study was to investigate different
ods of combining the data using domestic data, a combined domestic and foreign training population, and a domestic and foreign multi-trait method. Foreign bulls with US daughters were considered domestic in this study. The combined foreign and domestic training data set was comprised of bulls and cows that were proven (had daughter or own information) as of August, 2007 and totaled 9,874 Holsteins and 1,473 Brown Swiss. The domestic training animals included cows and bulls and totaled 8,674 Holsteins and 741 Brown Swiss. The foreign training data set had 1,200 Holsteins and 732 Brown Swiss. Over 90% of the foreign data from Holsteins were from Canada, which has a very high genetic correlation to the United States. Most the Brown Swiss data were from Germany and Switzerland, but animals from 6 other coun-tries were included in the data. The validation data sets consisted of US bulls that were unproven as of August, 2007 and proven with daugh-ters in at least 10 herds as of December, 2010. There were 3,094 and 115 Holstein and Brown Swiss validation bulls, respectively. Genetic correlations for the multi-trait method were computed as the weighted average of countries genetic correlation with the United States based from Interbull. Results show a general increase of about 2% from inclu-sion of foreign data over domestic data only in the Holstein population and an increase of 5% in the Brown Swiss. Multi-trait methodology was beneficial for Brown Swiss and most traits gained reliability and some traits gained as much as 6%. Multi-trait was not advantageous in Holsteins, probably due to the high genetic correlation between the 2 countries. It is recommended that countries with high genetic cor-relations be treated as a single population. Diverse populations may benefit from the implementation of multi-trait methodology.
Key words: country, dairy cattle, genomic evaluation
36 Optimization of principal component extraction for direct genomic value prediction in a multibreed population. N. P. P. Mac-ciotta*1, M. A. Pintus1, R. Steri1, G. Gaspa1, D. Vicario2, E. Santus3, J. T. H. Van Kaam4, and P. Ajmone Marsan5, 1Università di Sassari,
Sassari, Italy, 2ANAPRI, Udine, Italy, 3ANARB, Bussolengo, Italy, 4ANAFI, Cremona, Italy, 5Università Cattolica del Sacro Cuore,
Piancenza, Italy.
A joint use of data coming from different breeds is a strategy for miti-gating the huge unbalance between number of markers and number of phenotypes in genomic selection (GS) programmes. A further reduc-tion of data asymmetry can be obtained by using Principal component analysis to derive new synthetic variables to be used as predictors in the calculation of direct genomic values (DGV). In the present work the PC approach is used for predicting DGV for dairy traits in bulls of 3 breeds farmed in Italy: 863 Holstein (H), 749 Brown Swiss (BS), 479 Simmental (S), respectively. Animals were genotyped with the 54K Illumina beadchip. SNPs retained after edits were 39,225. PC were extracted from the joint data set of the 3 breeds or separately by each breed. Extraction was carried out by chromosome. Different amounts of PC were retained on the basis of the explained variance: 0.50, 0.70, 0.80 and 0.90. Effect of PC on polygenic EBV was estimated in the reference population with a BLUP model. Traits considered were milk yield, fat and protein percentages. Reference animals were considered those born before 2000. Accuracies were calculated as correlation between DGV and polygenic EBV. The increase of number of retained PC (from 1,255 to 8,452, corresponding to 0.5 and 0.9 of explained variance, respectively) resulted in an increase of DGV accuracy. Higher DGV accuracies were obtained for milk yield in the Simmental bulls (0.45–0.55 depending on the number of PC used) even though this trait showed the highest variability. On average, the increase was more relevant for protein percentage and in the BS bulls. The use of
a multibreed approach did not result in an increase of DGV accuracy compared with single breed estimation. Actually values tend to remain similar in the 2 approaches or, as in the case of Brown Swiss for milk yield, to decrease markedly. These results may be linked to the reduced size of the sample but may be also related to the different genetic struc-ture and selection history of the 3 breeds.
Key words: genomic selection, multibreed, principal component 37 Adjustment of deregressed values from cow evaluations to have the similar mean and variance as bull deregressed values. G. R. Wiggans*, P. M. VanRaden, and T. A. Cooper, Animal Improvement
Programs Laboratory, ARS, USDA, Beltsville, MD.
Traditional evaluations of cows with genotypes have been adjusted since April 2010 to be compatible with evaluations of bulls to improve their accuracy in estimation SNP effects. This adjustment made them not comparable with traditional evaluations of cows. Recent work has improved the adjustment by using a bull only direct genomic value to group cow according to the amount of adjustment required. This adjustment cannot be applied to all cows because the grouping requires a genotype and adjustments based on genotyped cows probably would over adjust other cows. To create an adjustment for all cows, Mende-lian sampling (MS), the difference between PTA and parent average (PA), was calculated for milk, fat, and protein. These were deregressed by dividing by a function of reliability with the reliability from parent average removed. Standard deviations (SD) of these values were grouped by reliability. A linear function of reliability was estimated as a multiplicative adjustment to reduce the SD from cows to that of bulls with similar reliability. Averages of PA by birth year were sub-tracted from PA to create within year PA deviation groups and mean deregressed MS was calculated for bulls and cows by group. These means for bulls fell and those for cows rose with increasing devia-tion. The differences were fit by linear regression on PA deviation and used to adjust cow deregressed MS. Adjusted cow evaluations were propagated to the PA of progeny. This adjustment reduced the PTA of cows with high PA and increased those of cows with low PA, but did not change the estimates of genetic trend because the adjustment was within birth year. It also reduced the within birth year variance of cow evaluations. This adjustment does not replace the adjustment of evaluations of genotyped cows because the use of bull only direct genomic values more precisely tailors the adjustment to the individual cow. However, it reduces the amount of the genotype based adjustment so should improve the comparability of evaluations of cows with and without genotypes.
Key words: cow evaluation, genomics, Mendelian sampling
38 Effectiveness of genomic selection on milk flow traits in dairy cattle. K. A. Gray*1, J. P. Cassady1, A. Rossoni2, and C. Maltecca1,
1North Carolina State University, Raleigh, 2Italian Brown Breeders
Association, Bussolengo, VR, Italy.
The objective of this study was to estimate the effect of genomic selec-tion on accuracy of predicselec-tion for traits associated with milkability. Milk flow measures for total milking time (TMT), time of plateau (TP), descending time (DT), average milk flow (AVGF) and maxi-mum milk flow (MMF) were collected on 37,213 Italian Brown cows. Estimated breeding values were obtained through standard BLUP techniques. Heritabilies were estimated to be 0.11, 0.31, 0.06, 0.28, 0.41 for TMT, TP, DT, AVGF and MMF, respectively. For 696 sires included in the phenotypic analysis, genomic information for 35,044 165 J. Anim. Sci. Vol. 89, E-Suppl. 1/J. Dairy Sci. Vol. 94, E-Suppl. 1
informative markers were obtained. Genotyped sires had on average 37 ± 3.9 daughters, and a reliability of ~0.60 averaged across all flow traits. Genotyped sires were partitioned based on their TMT EBV reli-abilities into a discovery set (TMT EBV reliability >0.70, n = 381) and a prediction set (TMT EBV reliability <0.70, n = 315). Pseudo-phenotypes for these sires were obtained by EBV de-regression and subsequently employed in obtaining genomic breeding values through a multiple trait GBLUP model. The GEBV reliabilities in the predic-tion set were compared with de-regressed parental averages (PA) and breeding values obtained using traditional BLUP methods (EBV) on the same individuals. The GEBV reliabilities in the prediction set were 0.64 (0.27 PA), 0.62 (0.28 PA), 0.69 (0.20 PA), 0.71 (0.28 PA), and 0.67 (0.29 PA) for TMT, TP, DT, AVGF and MMF, respectively. Average gain in reliability from genomic information was 0.37, 0.34, 0.49, 0.43 and 0.38. The EBV reliabilities in the prediction set were 0.46, 0.50, 0.29, 0.49, and 0.51 for TMT, TP, DT, AVGF, and MMF, respectively. Loss in accuracy when compared with the genomic model was 0.18, 0.12, 0.40, 0.22 and 0.16 for TMT, TP, DT, AVGF, and MMF, respec-tively. For all traits, use of a genomic model resulted in increased accu-racy of prediction for sires with little or no progeny information. Gain in accuracy increased as heritability decreased. Inclusion of genomic information increased accuracy of prediction for milk flow measures. Key words: genomic selection, accuracy of prediction, milk flow 39 Visualization of associations between single nucleotide poly-morphisms and economically important dairy traits using biplot analysis. A. I. Vazquez1, K. A. Weigel*2, G. J. M. Rosa2, D. Gianola2, and D. B. Allison1, 1University of Alabama, Birmingham, 2University
of Wisconsin, Madison.
In food animal species, the breeding objective consists of several interrelated traits, and implementation of genomic selection requires estimation of single nucleotide polymorphism (SNP) effects on these traits. When the number of markers is large and multiple traits are considered, extracting meaningful information from the results is challenging. Biplot analysis is an important tool for this purpose in plant breeding, but its features have not yet been explored in animal breeding. A biplot is a scatter plot that approximates and graphically displays a 2-way table, such that relationships between rows, rela-tionships between columns, and interactions between rows and col-umns can be visualized simultaneously. Biplots can uncover patterns in estimated SNP effects (rows) on phenotypic traits (columns) and shed light on the causes of genetic correlations between traits. In this study, phenotypes were predicted transmitting abilities for milk, fat, protein, daughter pregnancy rate, somatic cell score, productive life, and lifetime net merit for 3,305 Holstein sires, and genotypes were 32,518 SNP markers. The 32,518 × 7 matrix of estimated SNP effects was decomposed into principal components (PC), of which the first and second explained 42 and 29% of the total variation, respectively. A biplot of the first and second PC showed that SNP effects for milk, fat, and protein tended to lie on a common axis, whereas SNP effects for daughter pregnancy rate, somatic cell score, and productive life
tended to lie on a second axis that was nearly perpendicular to the first. Estimated SNP effects for lifetime net merit represented a com-promise between the 2; however, sets of individual SNPs had correla-tions between performance and fitness that were negative, neutral, or positive. The SNPs with largest estimated effects for lifetime net merit differed from those with largest estimated effects for the 6 biological traits. Our study suggests that biplots may facilitate interpretation of genomic data and assist animal breeders in incorporating information about individual SNPs into selection decisions.
Key words: genomic selection, dairy cattle, biplot analysis
40 Using single nucleotide polymorphism to detect selection signature in Hereford beef cattle. Y. Huang*1, C. Maltecca1, M. D. MacNeil2, and J. P. Cassady1, 1Department of Animal Science, North
Carolina State University, Raleigh, 2USDA-ARS, Fort Keogh
Live-stock and Range Research Laboratory, Miles City, MT.
The objective of this study was to investigate selection signature in 2 sources of purebred Hereford beef cattle. Data were available from 240 Line 1 Herefords (L1) born between 1953 to 2008, and 311 Indus-try Herefords (IH) born between 1970 and 2008. Line 1 Herefords were sampled from a closed line mainly selected for post weaning gain. Industry Herefords were a sample of registered US purebred Herefords. A genome-wide scan using 52,156 SNPs revealed differ-ent characteristics in L1 and IH. Average minor allele frequency of SNPs was 0.19 ± 0.168 in L1 and 0.23 ± 0.161 in IH. Number of homozygous markers was of 11,382 in L1 and 5,745 in IH. The fixa-tion index was 0.260 and 0.031 for L1 and IH, respectively. To detect differences in selection between the 2 populations, pooled heterozy-gosity (Hp) was calculated for sliding windows of 6 SNPs across the genome. Low Hp values are indicative of a high degree of fixation and putative selective sweeps. High Hp values can be the result of ongoing selection sweeps, balancing selection, or selection for multiple traits. Average Hp was 0.26 ± 0.10 for L1 and 0.29 ± 0.08 for IH. 225 low Hp windows (Hp <0.05) were identified in L1 while only 25 in IH. Fifty-four known QTLs were previously found to be associated with traits including birth weight and weaning weight, co-localized with low Hp windows that were common in L1 and IH on BTA 1, 3, 6, 13, 14, 15, 16, 18, and 25. Fifty-six known QTLs associated with growth traits such as average daily gain and yearling weight co-localized with low Hp windows that were only found in L1 in BTA 2, 5, 14, 17, 21, and 26. Number of high Hp windows (Hp >0.46) was of 155 in L1 and 78 in IH. This might reflect that L1 being selected for only one trait, while IH was selected on several traits with multiple concurring sweeps. Dif-ferences in number of high Hp windows might also indicate regional balancing selection. Based on these results it was concluded that there had been a loss of heterozygosity in Line 1 Herefords. The low Hp windows indicated putative selective sweeps in L1. Further investiga-tions are needed to explain the high Hp windows across the genome. Key words: Hereford, selection signature, SNP