CPD
4, 249–270, 2008 Tree-ring analysis and droughts in northwestern France O. Planchon et al. Title Page Abstract Introduction Conclusions References Tables Figures J I J I Back CloseFull Screen / Esc
Printer-friendly Version
Interactive Discussion
Clim. Past Discuss., 4, 249–270, 2008 www.clim-past-discuss.net/4/249/2008/
© Author(s) 2008. This work is distributed under the Creative Commons Attribution 3.0 License.
Climate of the Past Discussions
Climate of the Past Discussions is the access reviewed discussion forum of Climate of the Past
Contribution of tree-ring analysis to the
study of droughts in northwestern France
(XIX–XXth century)
O. Planchon1, V. Dubreuil1, V. Bernard2, and S. Blain3
1
COSTEL LETG, UMR 6554 CNRS, Universit ´e Rennes-2, Place Recteur H. Le Moal, 35043 Rennes Cedex, France
2
Civilisations Atlantiques et Arch ´eosciences UMR 6566 CNRS, Universit ´e Rennes-1, 263 Avenue du g ´en ´eral Leclerc, 35042 Rennes Cedex, France
3
Luminescence Laboratory, Dept. Of Archaeology, University of Durham, South Road, Durham, DH1 3LE / CRPAA UMR5060 IRAMAT CNRS, Universit ´e Bordeaux-3, Maison de l’Arch ´eologie 33607 Pessac Cedex, France
Received: 20 December 2007 – Accepted: 9 January 2008 – Published: 25 February 2008 Correspondence to: O. Planchon (olivier.planchon@Uhb.fr)
CPD
4, 249–270, 2008 Tree-ring analysis and droughts in northwestern France O. Planchon et al. Title Page Abstract Introduction Conclusions References Tables Figures J I J I Back CloseFull Screen / Esc
Printer-friendly Version
Interactive Discussion
Abstract
A tree-ring analysis based on oak samples in the North-West of France showed the effects of droughts periods on the growth index, during the late XIXth and XXth cen-tury. Four types of droughts were identified using the results of the tree-ring analysis and the available climate data. The “type 1” was subjected to a continuous and
in-5
tense drought during all the vegetative period (spring and summer), the “type 2” was subjected to a summer drought succeeding no precipitation deficit in spring, the “type 3” was subjected to a remarkable winter drought and during the years of the “type 4”, precipitation deficits were recorded for several but not successive months, over an het-erogeneous spatial distribution. The long, intense and countinuous droughts clearly
10
showed a spatial structuring effect on the growth index, especially when the two suc-cessive vegetative seasons (spring and summer) recorded strong precipitation deficits combined with shrivellings. These extreme cases involved the lowest growth index over most of the studied area, with some variations due to the altitude and exposure effects on the local-scale spatial distribution of the hydrological stress. The
hydrologi-15
cal balance for the station of Rennes (Brittany) confirmed these results in accordance with the intensity and/or duration of drought periods: the most intense droughts of the “type 1“ were especially pointed out. A climatic interpretation of growth index data and maps could so be possible over northwestern France with an application to the medieval times and perhaps to other periods, but the cause of the different drought
20
patterns must be more precisely studied during the contemporary period (late XIXth century and all the XXth century).
1 Introduction
Several dendrochronological studies were carried out to estimate the most precisely the temperature variation during the last millenium in the northern hemisphere (Jones
25
CPD
4, 249–270, 2008 Tree-ring analysis and droughts in northwestern France O. Planchon et al. Title Page Abstract Introduction Conclusions References Tables Figures J I J I Back CloseFull Screen / Esc
Printer-friendly Version
Interactive Discussion
reconstructions of the temperature variability, pointing out time analysis rather than spatial analysis. Masson-Delmotte et al. (2005) analysed long-time (400 years) tree-ring data series from timber woods and oaks of the area of Rennes (Brittany, western France), to show the precipitation seasonality and the drought frequency in a detailed climatic reconstruction for all western Europe. The aim of this present paper is to
pro-5
pose a climatic interpretation of the regional-scale spatial distribution of the vegetation growth index over a less wide geographical area, but using several selected samples over all the studied area. Climate variability has an important economic weight on agriculture even in industrialized countries. In the temperate-oceanic areas of west-ern Europe, the interannual climate variability, especially the variability of evaporation
10
deficiency, may lead to social and economical impacts. The recent droughts in Eu-rope have emphasised the vulnerability of EuEu-ropean economies to shortages in water supply (Lloyd-Hughes, 2002). For example, in Brittany (western France), the main ru-ral activities (maize and pasture lands) were strongly affected by the droughts of the years 1989, 1990 and 2003. Major initiatives such as the ARIDE (Assessment of the
15
Regional Impact of Droughts in Europe: see Stahl, 2001) and the WRINCLE (Water Resources: Influence of Climate change in Europe: see Kilsby, 2001) projects pointed out the importance of an improved understanding of drought in Europe. Since the mid-dle of the 70 s, an increase of the winter precipitation combined with a decrease of the summer precipitation was recorded in western France (Dubreuil et al., 1998) as
20
well as in the British Isles (Mayes, 1996; Kiely, 1999). If these pluviometric features were associated with a climatic trend (as shown by most of global change scenarios: Stahl, 2001), their effects could cause real problems in the areas of intensive agricul-ture. Thus, a mapping of the space-time and regionalization of the extreme climate features depending on their intensity (e.g. droughts in western Europe: Zaidman et al.,
25
2001) should be precised using long data series. Tree rings are very useful and precise proxy data which allow to reconstruct the past climate variability. A dendrochronolog-ical analysis was carried out using data from oak trees in northwestern France, over the Armorican massif and a large part of the Paris basin. The data were first selected
CPD
4, 249–270, 2008 Tree-ring analysis and droughts in northwestern France O. Planchon et al. Title Page Abstract Introduction Conclusions References Tables Figures J I J I Back CloseFull Screen / Esc
Printer-friendly Version
Interactive Discussion
for the period 1880–1980, because the highest number of synchronous tree ring series was recorded during that period. The mapping of the results was carried out using a GIS.
The oceanic-temperate climate of northwestern France is usually subjected to the At-lantic weather disturbances throughout the year. Their frequency and intensity present
5
a seasonal variability which directly determines the precipitation regimes. The pre-cipitation regime in north-western France is the result of the seasonal change in the circulation pattern in the mid- and high-latitudes over the North Atlantic Ocean and Eu-rope. Autumn and winter are usually the rainiest seasons although the lie of the studied area involves some regional and local differences in the precipitation amounts and in
10
the seasonal distribution of precipitation. The relatively sheltered inland basins, valleys and flat plateaus experience a more equitably distribution of low amounts (locally less than 600 mm) of precipitation throughout the year. The highest hills in NW France reach about 380–400 m in western Brittany and Normandy and precipitation is orographically enhanced on hillslopes presenting a westerly/southwesterly/southerly aspect (more
15
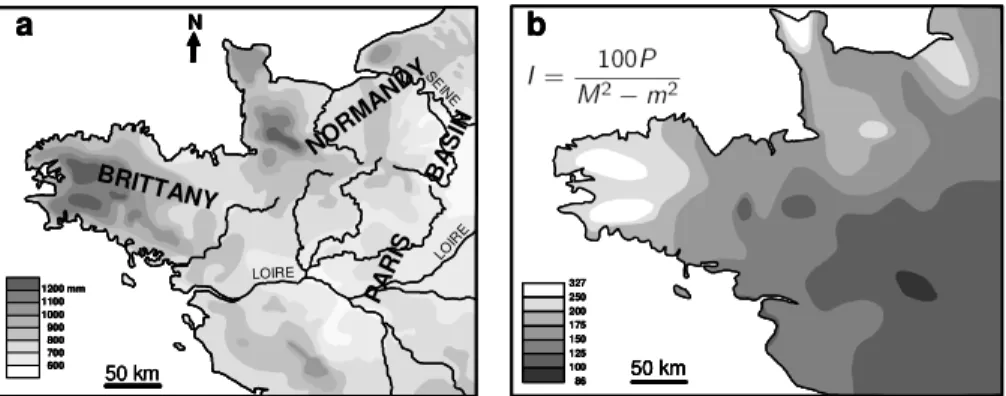
than 1200 mm on the highest hilly areas). High annual precipitation amounts depend-ing on heavy precipitation durdepend-ing the cold season are the distinctive feature of western Brittany and western Normandy (Fig. 1a), due to the exposure of these hilly areas to the prevailing Atlantic disturbance tracks. During early winter (December and Jan-uary), the strong westerlies induce heavy precipitation and explain the rainiest period
20
between November and January. The sheltered inland basins, valleys and low flat plateaus of eastern Brittany, the lower Loire valley area and the Paris basin experi-ence a more equitably distribution of precipitation throughout the year. Precipitation is orographically enhanced on hillslopes presenting a westerly/southwesterly/southerly aspect. The highest hills have heights of about 400 m in western Normandy and in
25
western Brittany. At small scales, topographical effects locally influence effects of the circulation type on precipitation.
In summer the westerly circulation is relatively weak and the weather disturbances tracks are high in latitude. So relatively low rainfall amounts are recorded on the
Euro-CPD
4, 249–270, 2008 Tree-ring analysis and droughts in northwestern France O. Planchon et al. Title Page Abstract Introduction Conclusions References Tables Figures J I J I Back CloseFull Screen / Esc
Printer-friendly Version
Interactive Discussion
pean Atlantic fringe, especially in the southern part of the area. Consequently, summer is the less rainy season in most of northwestern France ranged between 14% (west and south coast of Brittany) and about 25% (central and northern Paris basin) of the an-nual precipitation. Although precipitation deficits can occur throughout the year, the warm season is especially subjected to drought periods in western France (Dubreuil,
5
1994 and 1997). Aridity index were developed taking precipitation and temperature into account. The spatial distribution of the aridity index of Emberger (1955) in northwest-ern France (period 1961–1990; Fig. 1b) is according to the spatial distribution of the annual precipitation, with the highest (=wettest conditions) index in western Brittany and Normandy and the lowest (=driest conditions) index in the Loire valley. The driest
10
conditions recorded in the Loire valley are strengthened by the relatively high summer maximum temperature (≥25◦C in July).
2 Methods and data
2.1 Dendroclimatology
The dendrochronology is the analysis of the annual growth rings of trees, leading to
15
the calculation of significant indices of climate and general chronology of the past. The width of a tree ring was determined by the temperature and/or the moisture that prevailed during the year of its formation. Since stress from temperature and/or moisture variations reduces the width of the seasonal growth of a tree ring, den-drochronology has important application in the study of long-term climatic variations
20
(http://amsglossary.allenpress.com/glossary/browse). A statistical regression is used to show the connection between the climate instrumental data and the proxy data variability for the studied period. Dendrochronology allows to identify extreme climate events and their small-scale impacts, and also allows to propose a year-by-year pre-cise dating. The synchronization of the tree ring series was based on the identification
25
CPD
4, 249–270, 2008 Tree-ring analysis and droughts in northwestern France O. Planchon et al. Title Page Abstract Introduction Conclusions References Tables Figures J I J I Back CloseFull Screen / Esc
Printer-friendly Version
Interactive Discussion
the selected trees (Lambert, 1998). The measure of tree-ring width is a significant indi-cator of the climatic effect on the tree growth, therefore the variation in tree-ring growth shows the climate variability too. The dendroclimatological data were standardized, in order to exclude the variation in growth due to the tree age and to decrease the anthro-pogenic effect. The tree-ring data serie expressed in growth index allows to show the
5
climatic effect more clearly. The climatic interpretation was only based on the negative characteristic years (showing a growth drop of the studied oaks). The comparison be-tween the results of the dendroclimatological analysis and the available climate data for the period 1880–1980 allowed to identify the prevailing climatic features which caused the growth drop of the oaks. The identification of the characteristic years was based
10
on the intercomparison between average dendrochronological data of each of selected present-day forests.
2.2 Tree-ring and climate data
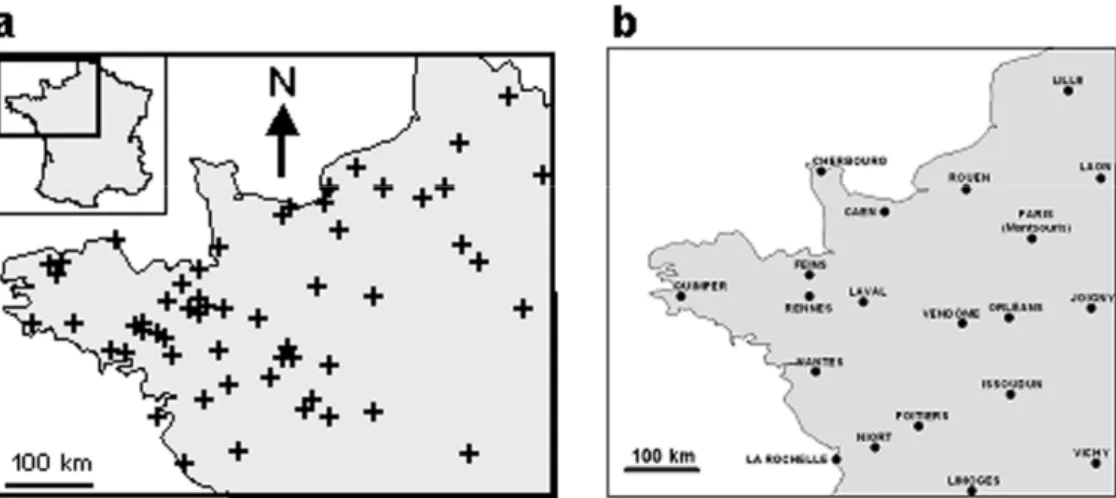
The data were recorded from oak trees over the Armorican massif and a large part of the Paris basin (Fig. 2a). The data recorded from alive trees samples were taken
15
from the Dendron II database (Lambert), from the Tree-Ring Database available on-line atwww.ncdc.noaa.gov/paleo/treering.htmland the data of the G ˆavre Forest (lower Loire valley area) and of the farm of La Bintinais (close to Rennes in eastern Britanny) were produced by Guibal (Institut Mediterranean Institute of Ecology and Paleoecol-ogy, Marseille). The data recorded from 16 referential sites allowed to take the period
20
1880–1995 into account.
The average monthly temperature and the monthly precipitation amounts for the pe-riod 1880–1980 got out the GHCN file (CDIAC/ORNL and NCDC) and were collected using the French Bulletins du Centre M ´et ´eorologique for the late XIXth century and the early XXth century, using the R ´esum ´es mensuels du temps of the French
meteorologi-25
cal office (M´et´eo-France) for the XXth century and got out the M´et´eo-France database. Reference meteorological stations were selected close to the sites of tree samples, to identify the climatic features associated with the negative characteristic years. In order
CPD
4, 249–270, 2008 Tree-ring analysis and droughts in northwestern France O. Planchon et al. Title Page Abstract Introduction Conclusions References Tables Figures J I J I Back CloseFull Screen / Esc
Printer-friendly Version
Interactive Discussion
to show more precise results about the precipitation anomalies and their space-time distribution, monthly precipitation data were obtained from 20 meteorological stations of the M ´et ´eo-France network over the studied area for the period 1881–1980 (Fig. 2b).
3 Results and discussion
3.1 Identification and typology of drought periods
5
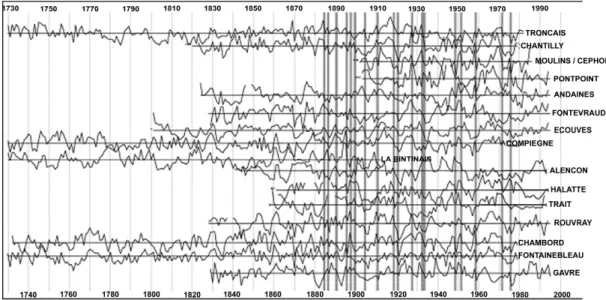
The best data coverage (number of tree-rings per year) was obtained for the period 1880–1980, as shown on Fig. 3. Monthly climate data have been collected for that period. During the studied period, 19 negative characteristic years were identified and the climate data analysis and results of the investigations by Dubreuil (1994) showed that all these years were subjected to drought events: 1885, 1887, 1891, 1896, 1898,
10
1900, 1905, 1911, 1915, 1919, 1921, 1928, 1933, 1934, 1949, 1952, 1959, 1972 and 1976. Drought is a regionally persistent and slowly developing hydrological phe-nomenon leading to a significant threat to water resources (Stahl et al., 2002). An atmo-spheric drought signal (dry weather period) causes a regional precipitation deficit over an extend period of time, which eventually results in a hydrological drought. As drought
15
affect the vegetation growth, tree rings may be precise indicators of past droughts, their intensity and spatial extent (Cook et al., 1999; Bonin and Burn, 2005). Drought can be defined by the combination of a precipitation deficit and high temperature anoma-lies (especially in the warm season). In this paper, drought periods (especially in the warm season) were at first identified using climate (ombrothermic) diagrams P=2T (P :
20
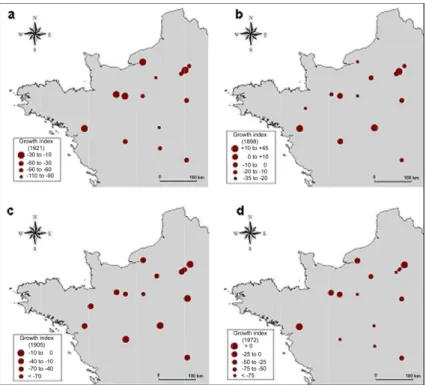
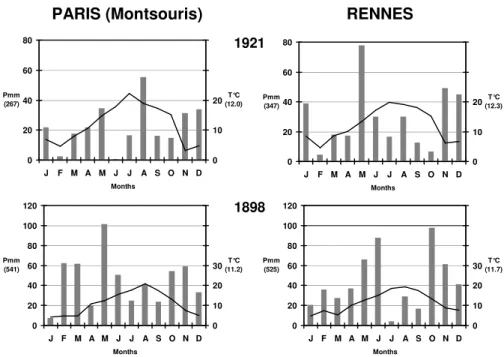
precipitation expressed in mm; T : temperature expressed in ◦C), according to Bag-nouls and Gaussen (1957) and Walter and Lieth (1964). Taking these diagrams into account, a month with P <2T is classified “dry”. This method allowed to classify the negative characteristic years identified and mapped in northwestern France (maps of growth index) in four types of years affected by droughts. Figure 4 shows one
refer-25
CPD
4, 249–270, 2008 Tree-ring analysis and droughts in northwestern France O. Planchon et al. Title Page Abstract Introduction Conclusions References Tables Figures J I J I Back CloseFull Screen / Esc
Printer-friendly Version
Interactive Discussion
Paris (Montsouris Park) and Rennes for each of these selected years (location of these stations: see Fig. 1b). According to the characteristics of the drought in northwestern France, the negative characteristic years were classified as follow:
Type 1 (Fig. 4a). Continuous and intense drought during all the vegetative period (spring and summer): 1896, 1921, 1949, 1976, and secondarily (shorter period of
5
drought) 1900, 1911.
Type 2 (Fig. 4b). Summer drought succeeding no precipitation deficit in spring: 1898, 1928, 1933, 1952, 1959; (without shrivelling): 1885 and 1887; (discontinuous): 1919.
Type 3 (Fig. 4c). Remarkable winter drought: 1891, 1905, 1934. Type 4 (Fig. 4d). Unclassified years without P <2T values: 1915, 1972.
10
Drought is the most discriminant climatic feature among the negative characteris-tic years. Several distinctive features of the drought were shown, depending on the duration, the intensity and the season(s) of drought. These features and the hydro-logical balance have an impact on the plant growth and should be take into account. The intensity of the hydrological deficit depends on the drought characteristics
above-15
mentioned. The hierarchy of the negative characteristic years essentially depends on the duration and intensity of droughts in summer and/or spring, whereas autumn is not a discriminant season. The results of this classification were confirmed and precised using other methods, especially to identify winter droughts and to explain the particu-larity of the “type 4” years (1915 and 1972, without dry months according to the climate
20
diagrams: for the year 1972, see Fig. 5). Precipitation differences were calculated us-ing monthly data of 20 meteorological stations of the M ´et ´eo-France network over the studied area (Fig. 1b), for the period of December–August 1880-1980 at monthly and seasonal timescales. The results confirmed the classification of the 19 negative char-acteristic years based on the duration and the intensity of the drought, and also based
25
on the seasons most affected by the drought (Table 1).
During the first class of type 1 (a: years 1896, 1921, 1949, 1976), the above men-tioned drought in spring and summer succeeded a strong precipitation deficit in winter. Therefore, during these years, the three consecutive seasons of winter, spring and
CPD
4, 249–270, 2008 Tree-ring analysis and droughts in northwestern France O. Planchon et al. Title Page Abstract Introduction Conclusions References Tables Figures J I J I Back CloseFull Screen / Esc
Printer-friendly Version
Interactive Discussion
summer were subjected to great negative precipitation differences in most of the ref-erence stations and involved the lowest growth index over most of the studied area. During the other years of the type 1 (1900, 1911), winter was not subjected to precip-itation deficits (1900) and/or the period of precipprecip-itation deficit in spring-summer was interrupted by some wet months e.g. in June 1911. The shorter periods of drought
5
during the years of types 2 (b) and 3 (c) resulted in negative but smaller precipitation differences for all the period of December–August. The percent difference in precipita-tion for the years of type 3 clearly shows the strong deficit in winter, compared with the other seasons. In 1915 and 1972, precipitation deficits were recorded for several but not successive months, over an heterogeneous spatial distribution.
10
In spite of the wide impact of the droughts, their effects are not homogeneous at regional and local scales. The spatial distribution of the plant growth index associated with the Type 1 (Fig. 4a) showed that the growth drop was lessened in the forests located on the highest reliefs (hills of Normandy). The hydrological deficit was probably smaller on the hills of the Armorican massif (lower temperature and evapotranspiration)
15
than in the neighbouring plains, especially in the plains and low plateaus of the central and southern Paris basin and the lower Loire valley area. The usually wettest sites were the least subjected to the droughts, according to Dubreuil (1996) and according to Fig. 1b. The spatial differences shown on the maps of the other types (Fig. 4b, c, d) were also due to the regulation process by the vegetation cover or the soil. Such a
20
result points out particularities of the spatial distribution of the hydrological stress and should be confirmed and developed at a local-scale in topoclimatological studies. 3.2 Hydrological balance and prevailing weather patterns
The hydrological balance for the station of Rennes (Brittany) confirmed the above men-tioned results, in accordance with the intensity and/or duration of drought periods.
Wa-25
ter balance for all the stations of western France shows an obvious risk of drought occuring mostly in summer. Whereas average precipitation data do not clearly show this problem, the interannual variability of evaporation deficiency underlines the
phe-CPD
4, 249–270, 2008 Tree-ring analysis and droughts in northwestern France O. Planchon et al. Title Page Abstract Introduction Conclusions References Tables Figures J I J I Back CloseFull Screen / Esc
Printer-friendly Version
Interactive Discussion
nomenon with a better accuracy. In this study, we used the difference between the potential evapotranspiration of Turc and the present evapotranspiration to quantify the deficit in spring (March, April and May) and in summer (June, July and August). In win-ter, the hydrological surplus was calculated for the months of December, January and February. In order to compare with dendrochronological data, we used homogenized
5
series of temperature and precipitation at Rennes (period 1880–1980) as described by Moisselin et al. (2002). For the implementation of the Turc formula we also used an estimation of the monthly sunshine duration:
Estimated sunshine duration=26.88*(T x−T n)−963
with T n: monthly mean of minimal temperature and T x: monthly mean of maximal
10
temperature.
(The coefficient of determination R2was 0.85 for the period 1961–1990)
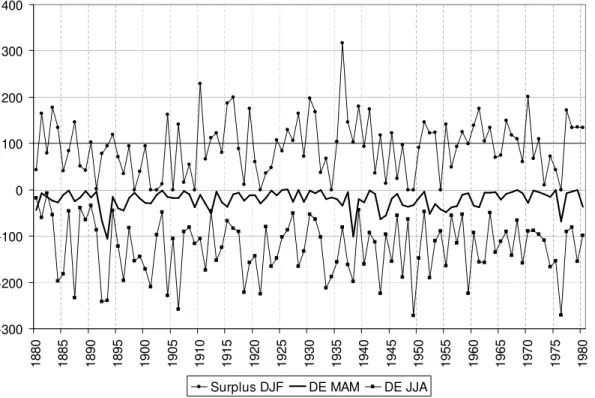
Figure 6 shows the chronology of the spring and summer deficits between 1880 and 1980. The interannual average for the summer deficit was about 125 mm (ranging from 8 mm in 1882 to 272 mm in 1949) while the spring deficit was 21 mm and the average
15
winter surplus was about 100 mm (the intense surplus of 1936 year of great flood in the city of Rennes). During the selected century, 13 years recorded a summer deficit of more than 200 mm and 8 years recorded a spring deficit of more than 50 mm. The intense summer droughts of 1976 and 1949 were clearly shown. Some of the years pointed out in the dendrochronological study are also shown on this graph: 1921,
20
1959, 1887. Some of the winter deficits are present in the two approaches too: 1891, 1905 and 1934. Despite these results, some summers and springs well shown in the dendrochronological study did not correspond to strong hydrological deficits in summer (1898, 1919). Conversely, several years characterized by strong deficits were not well shown in the dendrochronological series in summer (1892, 1893, 1906, 1943), in spring
25
(1893, 1938) or in winter (1901, 1909, 1954). Therefore, the tree-ring analysis must be go deeper, in association with a detailed study of the climatic causes of the different drought patterns using long-time climate data series.
CPD
4, 249–270, 2008 Tree-ring analysis and droughts in northwestern France O. Planchon et al. Title Page Abstract Introduction Conclusions References Tables Figures J I J I Back CloseFull Screen / Esc
Printer-friendly Version
Interactive Discussion
streamflow deficiencies. Zaidman et al. (2001) found that groudwater fed catchments in chalk geology regions of southeastern UK and northwestern France appear to be prone to this behaviour if groundwater recharge winter is lower than normal. How-ever, not all winter deficiencies are followed by a summer drought, and not all summer droughts are preceded by lower than usual winter streamflows (Stahl, 2001). Droughts
5
in northwestern France are due to the persistence of high surface pressure areas over western and/or central Europe. Therefore, the prevailing weather disturbances tracks are deflected northwards and anticyclonic conditions were observed in 70% of the dry periods of ten days between 1951 and 1980 (Perron, 1990; Dubreuil, 1994). Variation in intensity and in spatial extent of droughts may be due to the different large-scale
10
weather patterns over Europe, which cause the drought conditions. These patterns were reported e.g. by Stahl (2001) for the period 1962–1990. Winter precipitation deficits were often associated either with blocking high pressure systems over Europe and reduced zonal circulation (e.g. 1890–1891) or zonal circulation of long periods of anticyclonic conditions. Most of the severe summer droughts across Europe were
15
associated with high pressure systems across central Europe (e.g. 1898). Long and multi-seasonal droughts (e.g. 1976) were associated with a complex succession of dif-ferent weather patterns including varied and frequent anticyclonic conditions. Different types of anticyclonic conditions irregularly affected the year 1972 too. The analysis of the frequency of the large-scale circulation patterns causing drought conditions in
20
western and northwestern France will be useful to improve the climatic interpretation of the growth index maps. Such an analysis is possible and will be developed using the objective computational version of the Hess-Brezowsky Grosswetterlagen system (GWL) of classifying European synoptic regimes, from 1850 to the present (James, 2007).
CPD
4, 249–270, 2008 Tree-ring analysis and droughts in northwestern France O. Planchon et al. Title Page Abstract Introduction Conclusions References Tables Figures J I J I Back CloseFull Screen / Esc
Printer-friendly Version
Interactive Discussion
4 Conclusions
The results presented in this paper showed the effects of different types of droughts on the oak trees growth index in northwestern France, during the late XIXth and XXth century. Four types of droughts were identified using the results of the tree-ring analy-sis and the available climate data.The long, intense and countinuous droughts clearly
5
showed a spatial structuring effect on the growth index, especially when the two suc-cessive vegetative seasons (spring and summer) recorded strong precipitation deficits combined with shrivellings. These extreme cases involved the lowest growth index over most of the studied area, with some variations due to the altitude and exposure effects on the local-scale spatial distribution of the hydrological stress. A climatic interpretation
10
could so be possible especially in these cases of relatively homogeneous low growth index over most of northwestern France and with an application to the medieval times. In order to improve the climatic interpretation of the growth index maps of the medieval times and perhaps on other periods, the cause of the different drought patterns will be more precisely studied during the contemporary period (late XIXth century and all
15
the XXth century): i) with the analysis of the frequency of the large-scale circulation patterns for the characteristic years using the GWL catalogue, ii) with the analysis of the linkage between the circulation patterns and the space-time variability of the pre-cipitation anomalies during the characteristic years.
Despite these results, some summers and springs well shown in the
dendrochrono-20
logical study did not correspond to strong hydrological deficits in summer. Conversely, several years characterized by strong deficits were not well shown in the dendrochrono-logical series in summer, in spring or in winter. Therefore, the tree-ring analysis must be go deeper. Parallel to the tree-ring analysis, the mapping of the precipitation anomalies may show different spatial patterns based on the strength of the negative anomalies
25
CPD
4, 249–270, 2008 Tree-ring analysis and droughts in northwestern France O. Planchon et al. Title Page Abstract Introduction Conclusions References Tables Figures J I J I Back CloseFull Screen / Esc
Printer-friendly Version
Interactive Discussion
References
Bagnouls, F. and Gaussen, H.: Saison s `eche et indice x ´erothermique, Bull. Soc. Hist. Nat., Toulouse, 88, 193–239, 1957.
Blain, S., Planchon, O., and Bernard, V.: Cartographie des donn ´ees dendrochronologiques du nord-ouest de la France pour la p ´eriode m ´edi ´evale (XIVe-XVesi `ecles) : essai d’interpr ´etation
5
climatique, Actes du 19ecolloque de l’AIC, Epernay, 3, 131–135, 2006.
Bonin, D. and Burn, D.: Use of tree ring reconstructed streamflows to assess drought, Canadian Journal of Civil Engineering, 32(6), 1114–1123, 2005.
Cook, E. R., Meko, D. M., Stahle, D. W., and Cleaveland, M. K.: Drought reconstructions for the continental United states, J. Climate, 12, 1145–1162, 1999.
10
Dubreuil, V.: La s ´echeresse dans la France de l’Ouest : ´etude d’apr `es les bilans hydriques et les donn ´ees des satellites NOAA-AVHRR. Doctoral Thesis, Rennes-2 University (F), 381 p, 1994.
Dubreuil, V.: Synth `ese g ´eographique de la s ´echeresse dans les r ´egions oc ´eaniques, La M ´et ´eorologie (8es ´erie), 15, 22–34, 1996.
15
Dubreuil, V.: La s ´echeresse dans la France de l’Ouest: une contrainte climatique trop souvent oubli ´ee, S ´echeresse, 8(1), 47–55, 1997.
Dubreuil, V., Mounier, J., and Lejeune, C.: L’accentuation r ´ecente du d ´eficit estival dans la France oc ´eanique, Publications de l’Association Internationale de Climatologie, 11, 151– 157, 1998.
20
Emberger, L.: Une classification biog ´eographique des climats, Recueil des travaux des labora-toires de la Facult ´e des Sciences de Montpellier, 7, 3–43, 1955.
Jones, P. D. and Mann, M. E.: Climate over past millennia, Reviews of Geophysics, 42, RG2002, 42 pp., 2004.
James, P. M.: An objective classification for Hess and Brezowsky Grosswetterlagen over
Eu-25
rope, Theoretical and Applied Climatology, 88, 17–42, 2007.
Jones, P.D., Osborn, T.J. and Briffa, K.R.: The evolution of climate over the last millenium,
Paleoclimate review, 292, 662–667, 2001.
Kessler, J. and Chambraud, A.: La M ´et ´eo de la France, in: tous les climats localit ´e par localit ´e, edited by: J. C. Latt `es, 312 p., 1986.
30
Kiely, G.: Climate change in Ireland from precipitation and streamflow observations, Advances in Water Resources, 23, 141–151, 1999.
CPD
4, 249–270, 2008 Tree-ring analysis and droughts in northwestern France O. Planchon et al. Title Page Abstract Introduction Conclusions References Tables Figures J I J I Back CloseFull Screen / Esc
Printer-friendly Version
Interactive Discussion
Kilsby, C. G., editor: Water Resources: Influence of Climate change in Europe ENV4-CT97-0452, Water Resource Systems Research Laboratory, University of Newcastle, Newcastle-Upon-Tyne (UK), 96 p., 2001.
Lambert, G.N.: La dendrochronologie, m ´emoire de l’arbre, in: A. Ferdi `ere, Les m ´ethodes de datation en laboratoire, Errance, Paris (F), 13–69, 1998.
5
Lloyd-Hughes, B.: The long-range predictability of European drought, Doctoral Thesis, Univer-sity of London (UK), 203 p., 2002.
Masson-Delmotte, V., Raffalli-Delerce, G., Danis, P. A., Yiou, P., Stievenard, M., Guibal, F.,
Mestre, O., Bernard, V., Goosse, H., Hoffmann, G., and Jouzel, J.: Changes in European
precipitation seasonality and in drought frequencies revealed by a four-century-long tree-ring
10
isotopic record from Brittany, western France, Clim. Dynam., 24, 57–69, 2005.
M ´ET ´EO-FRANCE: Normales climatiques P ´eriode 1961–1990, Toulouse (F): Service Central
d’Exploitation de la M ´et ´eorologie, Tome 1 – Stations de m ´etropole.
Moisselin, J. M., Schneider, M., Canellas, C., and Mestre. O.: Changements Climatiques en France au 20 `eme si `ecle : ´etude des longues s ´eries de donn ´ees homog ´en ´eis ´ees franc¸aises
15
de pr ´ecipitations et temp ´eratures, La M ´et ´eorologie, 38, 45–56, 2002.
Perron, G.: Types de temps et ensoleillement en climat oc ´eanique: une m ´ethode de climatolo-gie appliqu ´ee `a la Bretagne, Doctoral Thesis, Rennes-2 University (F), 312 p., 1990.
Stahl, K.: Hydrological drought: A study across Europe, Doctoral thesis, Albert-Ludwigs-Universit ¨at Freiburg i. Br. (D), 122 p., 2001.
20
Turc, L.: Evaluation des besoins en eau d’irrigation, ´evapotranspiration potentielle, Annales Agronomiques, 1, 13–49, 1961.
Walter, H. and Lieth. H.: Klimadiagramm-Weltatlas, Verlag Gustav Fischer, Jena (D), 8000 stations and 55 maps, 1964.
Zaidman, M. D., Rees, H. G., and Young, A. R.: Spatio-temporal development of streamflow
25
CPD
4, 249–270, 2008 Tree-ring analysis and droughts in northwestern France O. Planchon et al. Title Page Abstract Introduction Conclusions References Tables Figures J I J I Back CloseFull Screen / Esc
Printer-friendly Version
Interactive Discussion
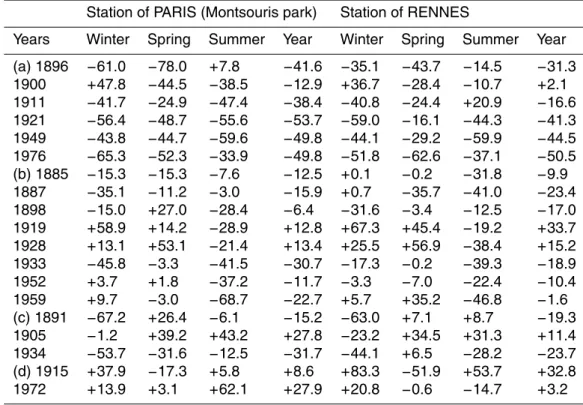
Table 1. Percent difference in precipitation at the meteorological stations of Paris (Montsouris
park) and Rennes, for the negative characteristic years (period December–August: winter/DJF, spring/MAM and summer/JJA) relative to 1881–1980 average. Winter includes the month of
December of the previous year. (a) Type 1: long and intense drought, (b) Type 2: summer
drought, (c) Type 3: winter drought, (d) Type 4: years with discontinuous short periods of
negative precipitation differences.
Station of PARIS (Montsouris park) Station of RENNES
Years Winter Spring Summer Year Winter Spring Summer Year
(a) 1896 −61.0 −78.0 +7.8 −41.6 −35.1 −43.7 −14.5 −31.3 1900 +47.8 −44.5 −38.5 −12.9 +36.7 −28.4 −10.7 +2.1 1911 −41.7 −24.9 −47.4 −38.4 −40.8 −24.4 +20.9 −16.6 1921 −56.4 −48.7 −55.6 −53.7 −59.0 −16.1 −44.3 −41.3 1949 −43.8 −44.7 −59.6 −49.8 −44.1 −29.2 −59.9 −44.5 1976 −65.3 −52.3 −33.9 −49.8 −51.8 −62.6 −37.1 −50.5 (b) 1885 −15.3 −15.3 −7.6 −12.5 +0.1 −0.2 −31.8 −9.9 1887 −35.1 −11.2 −3.0 −15.9 +0.7 −35.7 −41.0 −23.4 1898 −15.0 +27.0 −28.4 −6.4 −31.6 −3.4 −12.5 −17.0 1919 +58.9 +14.2 −28.9 +12.8 +67.3 +45.4 −19.2 +33.7 1928 +13.1 +53.1 −21.4 +13.4 +25.5 +56.9 −38.4 +15.2 1933 −45.8 −3.3 −41.5 −30.7 −17.3 −0.2 −39.3 −18.9 1952 +3.7 +1.8 −37.2 −11.7 −3.3 −7.0 −22.4 −10.4 1959 +9.7 −3.0 −68.7 −22.7 +5.7 +35.2 −46.8 −1.6 (c) 1891 −67.2 +26.4 −6.1 −15.2 −63.0 +7.1 +8.7 −19.3 1905 −1.2 +39.2 +43.2 +27.8 −23.2 +34.5 +31.3 +11.4 1934 −53.7 −31.6 −12.5 −31.7 −44.1 +6.5 −28.2 −23.7 (d) 1915 +37.9 −17.3 +5.8 +8.6 +83.3 −51.9 +53.7 +32.8 1972 +13.9 +3.1 +62.1 +27.9 +20.8 −0.6 −14.7 +3.2
CPD
4, 249–270, 2008 Tree-ring analysis and droughts in northwestern France O. Planchon et al. Title Page Abstract Introduction Conclusions References Tables Figures J I J I Back CloseFull Screen / Esc
Printer-friendly Version Interactive Discussion 1200 mm 1100 1000 900 800 700 600 50 km N BRITTANY NO RMAN DY PAR IS BAS IN SE INE LOIRE LO IRE a b 50 km 327 250 200 175 150 125 100 86 1200 mm 1100 1000 900 800 700 600 50 km N BRITTANY NO RMAN DY PAR IS BAS IN SE INE LOIRE LO IRE a 1200 mm 1100 1000 900 800 700 600 50 km N BRITTANY NO RMAN DY PAR IS BAS IN SE INE LOIRE LO IRE a b 50 km 327 250 200 175 150 125 100 86 b 50 km 50 km 327 250 200 175 150 125 100 86
Fig. 1. (a) Average annual precipitation in north-western France for the climatological
pe-riod 1961–1990, according to Kessler and Chambraud (1986) and M ´ET ´EO-FRANCE: Climate
Normals 1961–1990,(b) Distribution of the Emberger index in northwestern France for the
cli-matological period 1961–1990, according to Dubreuil (1994): P=Annual precipitation (mm),
M=Average daily maximum temperature of the warmest month, m=Average daily minimum
CPD
4, 249–270, 2008 Tree-ring analysis and droughts in northwestern France O. Planchon et al. Title Page Abstract Introduction Conclusions References Tables Figures J I J I Back CloseFull Screen / Esc
Printer-friendly Version
Interactive Discussion
Fig. 2. Location of the studied dendrochronological sites (a) and the main reference
CPD
4, 249–270, 2008 Tree-ring analysis and droughts in northwestern France O. Planchon et al. Title Page Abstract Introduction Conclusions References Tables Figures J I J I Back CloseFull Screen / Esc
Printer-friendly Version
Interactive Discussion
Fig. 3. Synchronization of the referential data series for the contemporary period. Grey vertical
lines show the synchronous growth anomalies (negative characteristic years) for most of these referential data series.
CPD
4, 249–270, 2008 Tree-ring analysis and droughts in northwestern France O. Planchon et al. Title Page Abstract Introduction Conclusions References Tables Figures J I J I Back CloseFull Screen / Esc
Printer-friendly Version
Interactive Discussion
Fig. 4. Spatial distribution of the growth index for the years 1921 (a), 1898 (b), 1905 (c) and
CPD
4, 249–270, 2008 Tree-ring analysis and droughts in northwestern France O. Planchon et al. Title Page Abstract Introduction Conclusions References Tables Figures J I J I Back CloseFull Screen / Esc
Printer-friendly Version
Interactive Discussion
PARIS (Montsouris) RENNES
0 20 40 60 80 J F M A M J J A S O N D Months Pmm (267) 0 10 20 30 40 T°C (12.0) 0 20 40 60 80 J F M A M J J A S O N D Months Pmm (347) 0 10 20 30 40 T°C (12.3) 1921 0 20 40 60 80 100 120 J F M A M J J A S O N D Months Pmm (541) 0 10 20 30 40 50 60 T°C (11.2) 0 20 40 60 80 100 120 J F M A M J J A S O N D Months Pmm (525) 0 10 20 30 40 50 60 T°C (11.7) 1898 0 20 40 60 80 100 120 J F M A M J J A S O N D Months Pmm (734) 0 10 20 30 40 50 60 T°C (10.5) Pmm T°C 0 20 40 60 80 100 120 J F M A M J J A S O N D Months Pmm (652) 0 10 20 30 40 50 60 T°C (10.9) 0 20 40 60 80 100 120 140 160 J F M A M J J A S O N D Months Pmm (740) 0 10 20 30 40 50 60 70 80 T°C (11.3) 1905 0 20 40 60 80 100 120 140 160 J F M A M J J A S O N D Months Pmm (584) 0 10 20 30 40 50 60 70 80 T°C (10.8) 1972
Fig. 5. Climate diagrams of 4 representative years among the identified negative characteristic
years, for the stations of Paris (Montsouris park) and Rennes. Location of these stations: see Fig. 1b.
CPD
4, 249–270, 2008 Tree-ring analysis and droughts in northwestern France O. Planchon et al. Title Page Abstract Introduction Conclusions References Tables Figures J I J I Back CloseFull Screen / Esc
Printer-friendly Version
Interactive Discussion
PARIS (Montsouris) RENNES
0 20 40 60 80 J F M A M J J A S O N D Months Pmm (267) 0 10 20 30 40 T°C (12.0) 0 20 40 60 80 J F M A M J J A S O N D Months Pmm (347) 0 10 20 30 40 T°C (12.3) 1921 0 20 40 60 80 100 120 J F M A M J J A S O N D Months Pmm (541) 0 10 20 30 40 50 60 T°C (11.2) 0 20 40 60 80 100 120 J F M A M J J A S O N D Months Pmm (525) 0 10 20 30 40 50 60 T°C (11.7) 1898 0 20 40 60 80 100 120 J F M A M J J A S O N D Months Pmm (734) 0 10 20 30 40 50 60 T°C (10.5) Pmm T°C 0 20 40 60 80 100 120 J F M A M J J A S O N D Months Pmm (652) 0 10 20 30 40 50 60 T°C (10.9) 0 20 40 60 80 100 120 140 160 J F M A M J J A S O N D Months Pmm (740) 0 10 20 30 40 50 60 70 80 T°C (11.3) Pmm T°C 1905 0 20 40 60 80 100 120 140 160 J F M A M J J A S O N D Months Pmm (584) 0 10 20 30 40 50 60 70 80 T°C (10.8) Pmm T°C 1972 Fig. 5. Continued.
CPD
4, 249–270, 2008 Tree-ring analysis and droughts in northwestern France O. Planchon et al. Title Page Abstract Introduction Conclusions References Tables Figures J I J I Back CloseFull Screen / Esc
Printer-friendly Version Interactive Discussion -300 -200 -100 0 100 200 300 400 18 80 18 85 18 90 18 95 19 00 19 05 19 10 19 15 19 20 19 25 19 30 19 35 19 40 19 45 19 50 19 55 19 60 19 65 19 70 19 75 19 80
Surplus DJF DE MAM DE JJA
Fig. 6. Chronology of the spring (MAM) and summer (JJA) deficits and of the winter (DJF)