HAL Id: hal-01655280
https://hal.inria.fr/hal-01655280
Submitted on 4 Dec 2017
HAL is a multi-disciplinary open access
archive for the deposit and dissemination of
sci-entific research documents, whether they are
pub-lished or not. The documents may come from
teaching and research institutions in France or
abroad, or from public or private research centers.
L’archive ouverte pluridisciplinaire HAL, est
destinée au dépôt et à la diffusion de documents
scientifiques de niveau recherche, publiés ou non,
émanant des établissements d’enseignement et de
recherche français ou étrangers, des laboratoires
publics ou privés.
Impact of viewing immersion on visual behavior in
videos
Toinon Vigier, Matthieu Perreira da Silva, Patrick Le Callet
To cite this version:
Toinon Vigier, Matthieu Perreira da Silva, Patrick Le Callet. Impact of viewing immersion on visual
behavior in videos. Sino-French Workshop on information and communication technology, Jun 2017,
Qingdao, China. �hal-01655280�
Impact of viewing immersion on visual behavior in videos
Toinon Vigier, Matthieu Perreira Da Silva, Patrick Le Callet
LS2N, Université de Nantes, France
Abstract
The emergence of UHD video format induces larger screens and involves a wider stimulated viewing angle. Therefore, its effect on visual attention can be questioned since it can impact quality assessment, metrics but also the whole chain of video processing and creation. Moreover, changes in visual attention from different viewing conditions challenge visual attention models. In this paper, we present, first, a comparative study of visual attention and viewing behavior, based on eye tracking data obtained in three different viewing conditions (SD-12°, HD-30° and UHD-60°). Then, we present a new video eye tracking database which permits a dynamic analysis of the impact of viewing immersion on visual attentional process in videos.
1
Introduction
Recent technological developments have made possible to TV manufacturers to provide larger and larger screens, improving viewers’ immersion. Nowadays, the new video Ultra High Definition (UHD) format is mainly defined by an increasing of the resolution from 1980 × 1080 in High Definition (HD) to 4K (3840 × 2160) or 8K (7680 × 4320) in UHD. This new resolution permits, according to the International Telecommunication Union (ITU), to also increase the size of the screen without loosing image quality [ITU12]. Furthermore, ITU defines an optimal viewing distance for TV screen as the distance for which the viewer is no longer able to distinguish two lines spaced by one pixel on the screen [ITU08]. This viewing distance is directly proportional to the height of the screen (H), and it is set at 6H in SD, 3H in HD and 1.5H in UHD-4K. These new viewing conditions directly lead to an increase of the visual field stimulated by the video (see Figure1), impacting the way the observer looks at the video.
Figure 1: The increase of stimulated visual angle from SD to UHD.
In this paper, we present, first, a comparative study of visual attention and viewing behavior, based on eye tracking data obtained in three different viewing conditions (SD-12°, HD-30° and UHD-60°). Then, we present a new video eye tracking database which permits a dynamic analysis of the impact of viewing immersion on visual attentional process in videos.
2
Impact of immersion on visual deployment in videos
2.1
Materials and methods
2.1.1 Datasets
In order to study the impact of visual immersion on gaze deployment in videos, we compared oculomotor behavior of observers in three datasets with different viewing conditions. These datasets had to be freely available and had to respect the following conditions: free viewing (no task), no soundtrack, and fulfillment of ITU recommendations. These three datasets – IVC_SD [BCPL09], SAVAM [GEV+14] and IVC_UHD – are described in Table1 .
2.1.2 Saliency maps
We directly computed saliency maps on gaze positions rather than fixations as in [MRP+13] in order to avoid
Name Resolution W (mm) D FOV Obs Src t IVC_SD 720 × 576 287.5 1380 11.89 49 51 9 SAVAM 1920 × 1080 531.6 1000 29.77 48 32 18 IVC_UHD 3840 × 2160 1422.2 1200 61.30 37 78 12
Table 1: Description of the eye tracking datasets. W is the width of the screen in mm. D is the viewing distance in mm. FOV is the horizontal viewing angle. Obs is the number of observers. Src is the number of video sources and t is the length of them in seconds.
gaussian function with σ = 1° of visual angle as recommended in [LB13a]. It corresponds to a full width at half maximum (FWHM) of 2.2° which is approximately the size of the fovea. Saliency maps were computed according to the proposed methodology for each video of each dataset.
2.1.3 Metrics
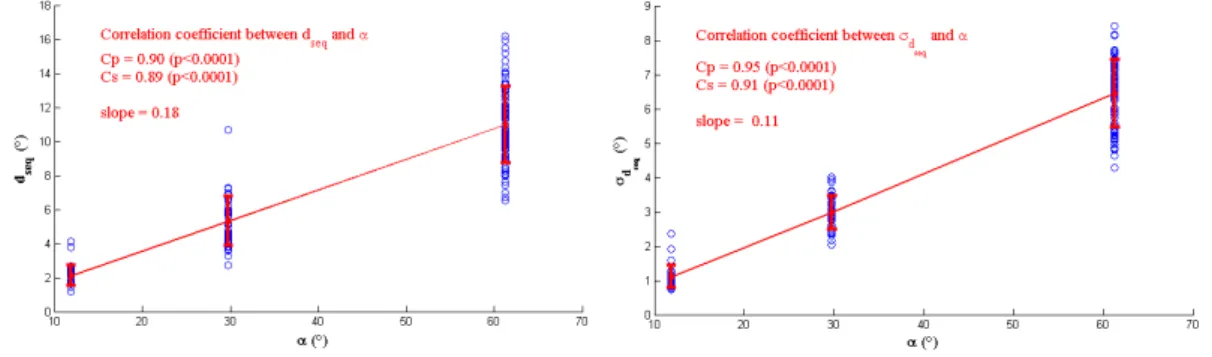
Dispersion To evaluate the impact of stimulated visual angle on visual attention, we analyzed the dispersion of gaze data through two metrics computed for each video of the datasets: the mean and the standard deviation of the distances in degree of visual angle between gaze points and the center of the screen over all sequence video frames. In the following, we denote the mean of distances for one video sequence as dseqand the standard deviation
of distances for one video sequence as σdseq.
Comparison with center models Center bias is a well know phenomenon in visual attention deployment corresponding to the tendency to gaze mostly at the center of the visual content. This bias would arise from different causes as motor bias, viewing strategy or video content [MRP+13, MLB07, TCC+09]. To evaluate the
distribution of gaze points around the center of the video, we compared the experimental saliency maps with center models thanks to Pearson correlation based measures (Cp) and Kullback-Liebler divergence (KLD) as recommended in [LB13a]. Here, center models correspond to anisotropic 2D gaussian centered in the map. The ratio of the gaussian preserves the ratio of the map. The width is expressed in visual angle degrees and it represents the FWHM of the gaussian. Figure2 depicts a 10° center model in SD, HD and UHD viewing conditions.
Figure 2: Center models with width = 10° in SD, HD and UHD.
2.2
Results
2.2.1 Dispersion
Figure 3: Impact of visual angle on dseq and σdseq. The error bars represent standard deviations.
Figure 3shows that dseq linearly increases along with the visual angle. The ratio between dseq and α remains
nearly constant around 0.18. A Kruskal-Wallis test validates that dseq/α is not significantly different between
exhibits a slight but significant difference on σdseq/α between IVC_SD and SAVAM and between IVC_SD and
IVC_UHD (p<0.01).
Results on dispersion clearly indicate that observers scan a wider visual angle when stimulated visual angle increases. Nevertheless, the fact that the ratio between dseqand α remains constant, suggests that, until a stimulated
visual angle up to 60°, observers scan the same proportion of the image, reaching the same salient region. The slight increase of dispersion from SD to HD and UHD can be explained by a higher inter-observer variability due to an extended freedom of scanpath or a methodology bias due to the difference of sequence length through the datasets.
2.2.2 Comparison with center models
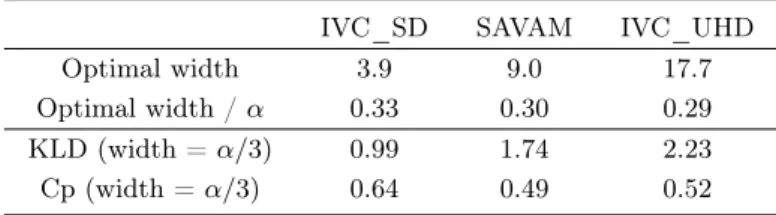
From the KLD and the Pearson correlation between center models of different width and saliency maps, we compute the optimal width of the center model for each dataset. It corresponds to the mean of the width that minimizes KLD and the width that maximizes Pearson correlation coefficient Cp. Table2shows that optimal width increases along with stimulated visual angle but the ratio between the optimal width and α also remains nearly constant around α/3.
IVC_SD SAVAM IVC_UHD Optimal width 3.9 9.0 17.7 Optimal width / α 0.33 0.30 0.29 KLD (width = α/3) 0.99 1.74 2.23 Cp (width = α/3) 0.64 0.49 0.52
Table 2: Optimal center model.
These results show a linear rule between optimal center model and stimulated visual angle. It confirms the previous assertion that gaze data distribution in video remains relatively stable between SD, HD and UHD viewing conditions. Moreover, it suggests that central bias is largely due to video content rather than motor bias. The optimal width of the center model, α/3, might reflect the rule of thirds in image and video composition.
2.3
Improvement of visual saliency models with an optimal center model
Some authors show that modulating visual saliency models with a center model enables to simulate central bias improving model performance[MRP+13,MLB07,JEDT09]. However, the size of center models is rarely motivated.
From the results in the previous section, we propose to use viewing conditions and more precisely stimulated visual angle to compute an optimal center model. The FWHM of the gaussian in the optimal center model is set as wopt = α/3. Then we can deduce σopt as:
σopt=
wopt
2√2 ln 2, thus σopt≈ α 7.06
To assess the optimality of the proposed center model, we confront the performance of visual saliency models with the original saliency map by computing KLD and Cp as described in Section 2.3.2 for 25 videos of the IVC_SD and IVC_UHD datasets. More precisely, we compare different center, static and dynamic map fusions from the model proposed in [MHG+09]. This computational model is a bottom-up visual attention model. The fusion
between static and dynamic maps is based on the maximum of the static map a and the skewness of the dynamic map b [MSTM13].
Msd= aMs+ bMd+ abMs× Md
The modulation of the fusion with center model is conducted in two configurations, whether the center model is applied before or after the static-dynamic fusion.
Results detailed in [REF] show that the proposed center model is always the best predictor in SD and UHD conditions. Most of the time, it significantly outperforms the other center models. The comparison of the two fusion configurations suggests that it is better to modulate maps with central model before fusion. In this case, this simple adaptation permits to improve model performance of more than 100% in SD and around 50% in UHD. All the models (center, static and fusion) obtained better results in SD than in UHD which is consistent with results of [4] obtained on static images. In this section, we proved that an optimal center model, directly dependent on stimulated visual angle, permits to significantly improve performance of visual saliency models on professional videos. However, other improvements are required to better fit visual attention models to UHD resolution.
These results are based on static metrics, averaged over all each video sequence: impact on immersion on dynamic effects in visual attention as saccades and scanpaths are not studied. Towards that, it is needed to compare visual behavior in the same video content for different viewing conditions. Therefore, we constructed a new eye tracking video dataset.
3
A new HD and UHD video eye tracking dataset
4
Dataset description
In this section, we describe a new HD and UHD video eye tracking dataset, freely available at http://ivc. univ-nantes.fr/en/databases/HD_UHD_Eyetracking_Videos/and described in detail in [VRPL16].
4.1
Video content
The dataset is composed of 37 native UHD high quality video sequences from seven content provider: SJTU Media Lab [STZ+13], Big Bug Bunny (Peach open movie project), Ultra Video Group, Elemental Technologies ,
Sveriges Television AB (SVT), Harmonic, Tears of steel (Mango open movie project). In HD, the original sequences were downscaled with Lanczos-3 algorithm which was proven as the best filter both in terms of performance and perceptual quality [LKB+14].
4.2
Eye tracking experiments
4.2.1 Experimental setup and procedure
UHD and HD were assessed in two different sessions with different observers to avoid any effect of memorization. - Session 1: UHD videos were viewed by 36 observers on a 65” Panasonic TX-L65WT600E UHD screen at the
viewing distance of 170cm, namely a viewing angle of 62°.
- Session 2: HD videos were viewed by 34 observers on a 46” Panasonic Full HD Vieta screen at the viewing distance of 120cm, namely a viewing angle of 33°.
Gaze data were recorded with the mobile SMI eye tracking glasses combined with the head tracker OptiTrack ARENA. Indeed, because of the larger stimulated viewing angle in UHD, observers can need to move more their head and eye tracking systems may not be accurate enough at the edges of the screen.
We adopted a free-viewing approach in these experiments. Sequences were randomized for each observer. They were 2 seconds spaced out. The whole test lasted approximately 25 minutes.
4.3
Gaze data
For each video and each observer, the following gaze data were stored: eye identifier (0 for left eye and 1 for right eye) ; time (sec) ; eye position in X axis (px) ; eye position in Y axis (px). The origin (0,0) is in the upper left corner of the frame. If the eye was not tracked by the eye tracker, the X and Y positions were set as NaN.
The mean of successive left and right eye positions might be calculated to obtain binocular information.
4.4
Fixation points and saccades
A fixation is defined as the status of a region centered around a pixel position which was stared at for a predefined duration. A saccade corresponds to the eye movement from one fixation to another.
Most often, saliency maps are computed from fixation points rather than gaze points. Thus, we extracted fixation points and saccades from the gaze data following the method explained in [Tob14].
More precisely, fixations were detected according four parameters: • the fixation velocity maximum threshold, set as 30°/s;
• the maximum time between separate fixations, set as 75 ms ; • the minimum visual angle between separate fixations, set as 0.5° ; • the minimum fixation duration, set as 100 ms.
For each source, we provide the following data about fixations: starting time of fixation (ms) ; end of fixation (ms) ; fixation position in X axis (px) ; fixation position in Y axis (px) ; number of gaze points in the fixation ; observer number.
We also provide saccade data between fixations as follows: starting time of saccade (ms) ; end of saccade (ms) ; position of start of saccade in X axis (px) ; position of start of saccade in Y axis (px) ; position of end of saccade in X axis (px) ; position of end of saccade in Y axis (px) ; saccade length (px) ; saccade orientation (°) ; observer number.
4.5
Dataset usage
The main goal of this dataset is the comparison of visual attention and viewing behavior in HD and UHD. Different kinds of analyses can be done: impact of viewing conditions and resolution on distribution of gaze points and fixations (Figures ?? and4), comparison of saliency through fixation density maps (Figures ?? and5), comparison of distribution of saccades (Figures ?? and6), etc. Different indicators and metrics can be computed from these data as proposed in [LB13b], in order to compare results in HD and UHD. Moreover, this dataset can be used to evaluate the performance of visual saliency models in HD and UHD, by comparing fixation density maps computed from acquired data with simulated saliency maps.
(a) HD (b) UHD
Figure 4: Gaze points (red) and fixations (blue) for all observers (Big Bug Bunny, sequence 2, frame 100).
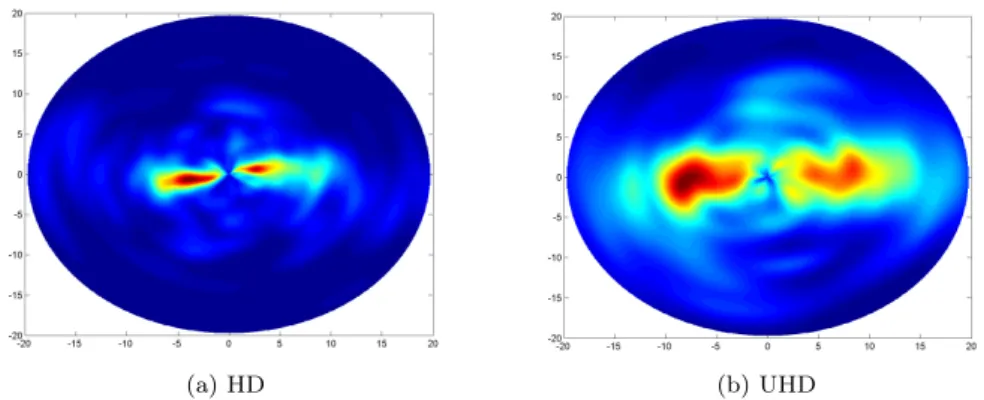
(a) Original frame. (b) Fixation density map in HD. (c) Fixation density map in UHD.
Figure 5: Example of fixation density maps in HD and UHD. Video sequence Traffic_and_Buildings, frame 150.
(a) HD (b) UHD
Figure 6: Polar distribution of saccades between 0 et 20° length in the whole video sequence Bosphorus. Furthermore, this dataset provides useful data for any researcher working on dynamic visual attention in videos (dynamic visual attention modeling, visual attention and quality of experience, saliency-based video compression, etc.). The main qualities of the dataset are the large number of sources and observers compared to previously published video saliency database, as well as the high quality of professional videos.
5
Conclusion
In this paper, we assessed the impact of visual angle on visual attention deployment. By comparing results on three eye tracking datasets on SD, HD and UHD videos, we showed that the dispersion of gaze points is directly correlated with stimulated visual angle. Results suggest that visual deployment in the video content remains relatively stable until a stimulated visual angle of about 60°. Moreover, we proved that an optimal center model, with a width equal to one third of stimulated visual angle, is the best predictor of visual saliency on professional
videos. These results have been successfully applied to make visual saliency models more robust toward viewing conditions by modulating them with this optimal center model.
We also presented a new HD and UHD video eye tracking dataset on 37 high quality video sequences, respectively seen by 34 and 36 observers in HD and UHD. For each video sequence, gaze point, fixation and saccade data are provided. The main objective of this dataset is the comparison of visual attention and viewing behavior in HD and UHD. Indeed, the emergence of UHD video format induces larger screens and involves a wider stimulated visual angle. Therefore, its effect on visual attention can be questioned since it can impact quality assessment, metrics but also the whole chain of video processing and creation. Thanks to the variety of video sequences and the large number of observers, these data can be really useful for any study on visual attention in videos.
References
[BCPL09] Fadi Boulos, Wei Chen, Benoit Parrein, and Patrick Le Callet. Region-of-Interest intra prediction for H.264/AVC error resilience. In 2009 16th IEEE International Conference on Image Processing (ICIP), pages 3109–3112. IEEE, nov 2009.
[GEV+14] Yury Gitman, Mikhail Erofeev, Dmitriy Vatolin, Bolshakov Andrey, and Fedorov Alexey.
Semiauto-matic visual-attention modeling and its application to video compression. In 2014 IEEE International Conference on Image Processing (ICIP), pages 1105–1109. IEEE, oct 2014.
[ITU08] ITU-R BT.1769. Parameter values for an expanded hierarchy of LSDI image formats for production and international programme exchange. 2008.
[ITU12] ITU-R BT.2020. Parameter values for ultra-high definition television systems for production and inter-national programme exchange. 2012.
[JEDT09] Tilke Judd, Krista Ehinger, Fredo Durand, and Antonio Torralba. Learning to predict where humans look. In 2009 IEEE 12th International Conference on Computer Vision, pages 2106–2113. IEEE, sep 2009.
[LB13a] Olivier Le Meur and Thierry Baccino. Methods for comparing scanpaths and saliency maps: strengths and weaknesses. Behavior research methods, 45(1):251–266, 2013.
[LB13b] Olivier Le Meur and Thierry Baccino. Methods for comparing scanpaths and saliency maps: strengths and weaknesses. Behavior Research Methods, 45(1):251–266, 2013.
[LKB+14] Jing Li, Yao Koudota, Marcus Barkowsky, Helene Primon, and Patrick Le Callet. Comparing upscaling
algorithms from HD to Ultra HD by evaluating preference of experience. In 2014 Sixth International Workshop on Quality of Multimedia Experience (QoMEX). IEEE, 2014.
[MHG+09] Sophie Marat, Tien Ho Phuoc, Lionel Granjon, Nathalie Guyader, Denis Pellerin, and Anne
Guérin-Dugué. Modelling spatio-temporal saliency to predict gaze direction for short videos. International Journal of Computer Vision, 82(3):231–243, 2009.
[MLB07] Olivier Le Meur, Patrick Le, and Dominique Barba. Predicting visual fixations on video based on low-level visual features. 2007.
[MRP+13] Sophie Marat, Anis Rahman, Denis Pellerin, Nathalie Guyader, and Dominique Houzet. Improving
Visual Saliency by Adding ’Face Feature Map’ and ’Center Bias’. Cognitive Computation, 5(1):63–75, 2013.
[MSTM13] Satya M Muddamsetty, Desire Sidibe, Alain Tremeau, and Fabrice Meriaudeau. A performance eval-uation of fusion techniques for spatio-temporal saliency detection in dynamic scenes. In 2013 IEEE International Conference on Image Processing, pages 3924–3928. IEEE, sep 2013.
[STZ+13] Li Song, Xun Tang, Wei Zhang, Xiaokang Yang, and Pingjian Xia. The SJTU 4K video sequence
dataset. In 2013 Fifth International Workshop on Quality of Multimedia Experience (QoMEX). IEEE, 2013.
[TCC+09] P. H. Tseng, Ran Carmi, Ian G M Cameron, Douglas P Munoz, and Laurent Itti. Quantifying center
bias of observers in free viewing of dynamic natural scenes. Journal of Vision, 9(7):4–4, jul 2009. [Tob14] Tobii Technology. User Manual - Tobii Studio. 2014.
[VRPL16] Toinon Vigier, Josselin Rousseau, Matthieu Perreira Da Silva, and Patrick Le Callet. A new HD and UHD video eye tracking dataset. In ACM Multimedia Systems Conference, Klagenfurt, Austria, 2016.