HAL Id: hal-01650131
https://hal-mines-paristech.archives-ouvertes.fr/hal-01650131
Submitted on 28 Nov 2017
HAL is a multi-disciplinary open access
archive for the deposit and dissemination of
sci-entific research documents, whether they are
pub-lished or not. The documents may come from
teaching and research institutions in France or
abroad, or from public or private research centers.
L’archive ouverte pluridisciplinaire HAL, est
destinée au dépôt et à la diffusion de documents
scientifiques de niveau recherche, publiés ou non,
émanant des établissements d’enseignement et de
recherche français ou étrangers, des laboratoires
publics ou privés.
and Data Management System for Irradiation Facilities:
the CERN IRRAD Use Case
Blerina Gkotse, M. Glaser, Pierre Jouvelot, Emanuele Matli, Giuseppe
Pezzullo, Federico Ravotti
To cite this version:
Blerina Gkotse, M. Glaser, Pierre Jouvelot, Emanuele Matli, Giuseppe Pezzullo, et al.. Towards a
Unified Environmental Monitoring, Control and Data Management System for Irradiation Facilities:
the CERN IRRAD Use Case. RADECS 2017, RADiation Effects on Components and Systems, Oct
2017, Genève, Switzerland. �hal-01650131�
Abstract— The qualification of materials, electronic components and equipment for the CERN High Energy Physics experiments and beyond requires testing against possible radiation effects. These quite complex tests are performed by specialized teams working in irradiation facilities such as IRRAD, the Proton Irradiation Facility at CERN. Building upon the details of the overall irradiation control, monitoring, and logistical systems of IRRAD as a use case, we introduce the motivations for and general architecture of its new data management framework, currently under development at CERN. This infrastructure is intended to allow for the seamless and comprehensive handling of IRRAD irradiation experiments and to help manage all aspects of the facility. Its architecture, currently focused on the specific requirements of the IRRAD facility, is intended to be upgraded to a general framework that could be used in other irradiation facilities within the radiation effects community, as well as for other applications.
Index Terms— control systems, IRRAD, irradiation facility,
monitoring, radiation tests
I. INTRODUCTION
HE increasing level of complexity of the upcoming generation of High Energy Physics (HEP) experiments designed and built at CERN [1], as well as the advancements in space applications [2] and in the nuclear energy field [3], make the components and material qualification against possible radiation effects a prerequisite. Irradiation qualification experiments are performed in facilities where the tested items are exposed to specific radiation fields. These irradiation tests can be quite complex and the experimentalists should take into consideration many parameters during the operation (temperature, humidity, dose rate, samples alignment, etc.) [4]. Therefore, the accurate monitoring of these parameters, the control of the equipment in real time,
This project has received funding from the European Union’s Horizon 2020 research and innovation program under grant agreement no. 654168.
B. Gkotse, M. Glaser, E. Matli, G. Pezzullo and F. Ravotti are with the Experimental Physics Department, CERN, Geneva 23, CH-1211, Switzerland (e-mail: Blerina.Gkotse@cern.ch).
B. Gkotse and P. Jouvelot are with MINES ParisTech, PSL Research University, Paris, France.
and the availability of the data of a given experiment, impact directly the relevance and accuracy of the results obtained from the irradiation tests. Since materials become often radioactive after irradiation, personnel safety and radiation protection play an important role in an irradiation facility. Furthermore, the safety of the equipment (damage, breakdown) needs also to be taken into account [5]. Therefore, a versatile management system is needed to handle all these aspects.
Designing such management system is a difficult and time-consuming task. This is currently being developed for one particular irradiation facility, namely the IRRAD proton irradiation facility at CERN. The IRRAD facility (see Fig.1) is dedicated to the qualification of components for HEP experiments [6]. In IRRAD, a high-energy proton beam with, a momentum of 24 GeV/c and typical size of 12×12 mm2
(FWHM), is delivered from the Proton Synchrotron accelerator (PS) in pulses (spills), with a width of 400 ms and of irregular frequencies. This beam of Minimum Ionizing Particles (MIPs) [7] is used to irradiate detectors, electronic components and systems, as well as calorimetric materials, and particularly suitable for Displacement Damage and Single-Event Effects testing.
This paper has two goals: (1) first is to provide a detailed account of the control systems of IRRAD, as well as of the hardware and software tools currently in place for its environmental monitoring; (2) second, it is to use the IRRAD system description as a use case, to outline the design of a new, integrated management system for the data related to irradiation facilities. Ultimately, we hope such a system can provide a solid foundation for the implementation of comprehensive data management systems for existing and future irradiation facilities in both academia and industry.
In Section II, we introduce how the control of the IRRAD irradiation equipment is performed. Section III details how the irradiation beam is instrumented and monitored. Environmental issues are addressed in Section IV, while further applications of the gathered experimental data are surveyed in Section V and more administrative management issues discussed in Section VI. Finally, we frame the
Towards a Unified Environmental Monitoring,
Control and Data Management System
for Irradiation Facilities:
the CERN IRRAD Use Case
B. Gkotse, Student Member, IEEE, M. Glaser, P. Jouvelot, E. Matli, G. Pezzullo, F. Ravotti, Member,
IEEE
generalization of all these data management issues into a proposal for a unified irradiation facility management system in Section VII. We conclude and present future work in Section VIII.
Fig. 1. IRRAD facility irradiation area.
II. IRRADIATION SYSTEM CONTROL
The two main components of IRRAD under user control are the tables where the samples are placed and its conveyer for remote operation.
A. IRRAD Tables
In IRRAD, various irradiation experiments, for items ranging from small detectors of 5×5 mm2 to large setups (up to
several tens of cm2) can be installed on remotely controlled
stages (the IRRAD tables shown in Fig. 2) [8]. These tables have three degrees of freedom: they can move along the transversal beam direction (X, Y) and rotate around it (θ). Samples can thus be placed, with a ±0.1 mm precision, into the core of the proton beam. Small samples are usually placed on one of the standard support holders of IRRAD. However, samples often vary in shape and dimension. In these cases, customized support holders are needed; users prepare those themselves, following the specifications provided by the IRRAD coordinators. Samples larger than the beam spot can be irradiated by setting the IRRAD tables into scanning mode, which means that the holders will be continuously moving from one position to another on the X and/or Y axis.
Fig. 2. IRRAD tables.
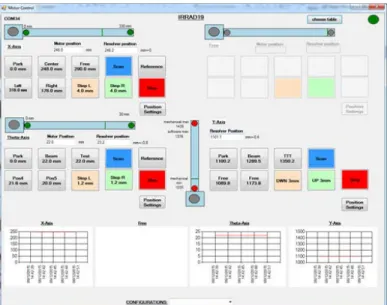
To allow the control, configuration and monitoring of the IRRAD tables, a dedicated custom-made software system (developed using Windows Forms [9] and C #) communicates through RS232 with a microprocessor [10] that is programmed to move the tables to the assigned positions.
As displayed in Fig. 3, the software interface allows IRRAD users to:
• view the IRRAD tables’ current position and status, and the history of the movements;
• control the movements of the IRRAD tables;
• define the requested positions, speed and configuration parameters.
Fig. 3. User interface of the IRRAD table control system.
In addition to user control, some intelligence is integrated to the system in order to ensure its proper use. For instance, if a specific movement or the setting of some parameter is forbidden in a particular experiment, then the administrators can deactivate this option in order to prevent users from committing mistakes when using the software interface. In addition, notifications are displayed to the users. For example, if a power cut has occurred, the interface notifies the users that they need to set the system to a valid reference point, otherwise the irradiation position value would not be reached correctly.
B. IRRAD1 Shuttle
IRRAD is also equipped with a shuttle system, called IRRAD1. This shuttle is a conveyer (Fig. 4) moving on a rail path, and it is used to remotely place small samples (up to 5×5 cm2 of overall size from the outside area of IRRAD to the
irradiation position inside the bunker.
Fig. 4. Shuttle conveyer.
no need for human intervention in IRRAD, but also users can perform irradiations without stopping beam delivery. The shuttle moves into a 10 m-long channel chicane (Y-axis in Fig. 4) with a cross-section of 40×40 cm2 located inside the
radiation shielding that separates the irradiation area from the outside [11]. Since the conveyer moving along the Y-axis brings the samples close to the beam position, another motorized axis is needed to position the samples precisely in beam spot. Therefore, on the shuttle, a motor and a sample holder are installed to move the samples along the X-axis as shown in Fig. 4. In the beginning of an irradiation sequence, the user loads the samples at the LOAD position (Fig.5). When the conditions for the irradiation are nominal (beam intensity, time, etc.), the samples can be moved in the BEAM position for irradiation. Once the cumulated fluence for the samples reaches the one requested by the user, the samples are moved out of the beam in the intermediate PARK position (4 m far from the LOAD position) for the cool-down step. A Geiger counter is installed at that point, connected to an outside AD6 dosimeter acting as readout unit [12] that provides the dose rate of the samples. When the dose rate of the samples is low enough, the user can move the shuttle to the LOAD position and retrieve the samples. A second AD6 dosimeter is also installed at the LOAD position in order to show to users the current dose rate.
Fig. 5. LOAD position of the shuttle IRRAD1, outside the control room of IRRAD. The users’ interface depicted in Fig. 6 is also visible here.
For the control and monitoring of the IRRAD1 shuttle, there are two categories of users: the administrators and the IRRAD users. IRRAD users usually need only to move the samples in or out of the beam, whereas the administrators (IRRAD coordinators) need to have full control of the shuttle system. For these reasons, two dedicated interfaces were developed, oriented towards IRRAD users’ (Fig. 6) and administrators’ (Fig. 7) requirements respectively.
The IRRAD1 users’ interface (in Fig. 6) is a simplified interface that allows users to move samples in the required position. This interface supports two modes of operation: (1) the automatic mode takes into account the current position and executes automatically the commands required to move the samples in the proper position; while (2), in the manual mode, users can perform step by step movements. This interface also displays the levels of radiation on the LOAD and PARK
positions. Moreover, when irradiation is ongoing, the total cumulated proton fluence is also displayed. As for the IRRAD table interface described above, this one also does not allow users to perform wrong movements.
Fig. 6. IRRAD user interface of the IRRAD1 shuttle control system.
The administrator interface (Fig. 7) provides full control of the shuttle system. In addition to the previously described functionalities, the administrators can also configure the position settings. Furthermore, they can monitor the movements and the dose rate of the shuttle in real time. This interface can also guide the users for the insertion of samples in the beam at precise times; this leads to a high precision on the number of spills that the samples will receive, a particularly important parameter to accurately perform short irradiation experiments.
Fig. 7. Administrator interface of the IRRAD1 shuttle control system.
Finally, this interface can be used for handling the operational and electrical constraints for the shuttle (similar to the ones for the tables), as well as dealing with network and connectivity issues.
III. IRRADBEAM INSTRUMENTATION
In order to control the position, shape and alignment of the irradiation beam, the IRRAD facility uses a specific type of detector called Beam Profile Monitor (BPM) [13]. These detectors are composed of arrays of 4×4 mm2 Cu pads that
generate an electron charge via Secondary Electron Emission when the proton beam impinges on them [14]. This signal is read by a Data Acquisition (DAQ) unit outside the radiation zone, which integrates and records the signal through an Arduino YUN; these data are then sent to a server for further processing and finally stored in an Oracle database. The stored data are used to populate a real-time web display of the Gaussian beam-profile, the intensities in each pad and the longitudinal profile of the beam, as shown in Fig. 8. The mean (x0, y0) and the variance σ of the Gaussian beam profile are
also computed and displayed. Since the BPM is the only instrument to control the irradiation beam in IRRAD, it is used by the CERN Control Center (CCC) to steer and center properly the beam; it is also a key parameter for the IRRAD operators and users to check the beam status and record the data for offline data analysis of the irradiation experiment results.
Fig. 8. Beam profile display. In the upper part, the X-Y Gaussian profiles of the beam are displayed. In the bottom part (left-hand side), one sees the pad intensities while on the right-hand side, the longitudinal profile of the beam.
On the IRRAD tables, two slightly different types of detectors, called mini-BPM and single-pad BPM, are installed. They are used to align the samples that are placed on the IRRAD tables in the beam. Even though these detectors have different forms and purposes, they use the same data acquisition and processing system architecture [13].
For control operations, a dedicated user interface has been developed; the IRRAD operators use it, in particular, when there is a need to align the center of the samples with the beam spot or check whether the samples are correctly placed in the beam.
The BPM data allow the reconstruction and display of the 3D beam profile in order to cope with the users’ requirements for precision and offline data analysis. In contrast with the beam profile display mentioned earlier and used in operation, which takes into account only the intensities on the two axes, the 3D reconstruction process uses all the acquired BPM intensities, via a SciPy function [15] for the least square minimization. The implemented method has been validated over hundreds of spills against other fitting methods [13] (Fig. 9).
Fig. 9. Reconstruction of beam profile.
IV. ENVIRONMENTAL MONITORING
In any irradiation experiment, it is crucial to monitor and keep track of the ongoing environmental conditions (temperature, humidity, samples alignment, etc.). That is why, in the IRRAD facility, temperature, humidity [16] and radiation sensors are installed and sampled continuously.
In particular, irradiation experiments at low temperatures (down to -25 °C) require continuous monitoring of this parameter. Except for the temperature logging during the irradiation, temperature monitoring sensors are also needed after the experiment when the samples are kept cold in order to avoid annealing phenomena. Therefore, multiple temperature sensors have been installed in different storage areas, for monitoring purposes after the irradiation process.
As mentioned in Section II.B, the dose rate measured by the AD6 radiation monitor on the IRRAD1 shuttle is an important parameter. This is related to the safety of the people handling the irradiated material, and therefore needs to be measured and recorded constantly in order to notify and prevent users from manipulating samples with excessively high dose rates.
Since the size of the beam spot is relatively small (12×12 mm2 FWHM), as also the samples often are (5×5mm2), their
positioning in beam is challenging. In order to supply the users with an as-high-as possible proton flux, over an as-much-as possible homogeneous surface, the samples should be positioned in the beam with high precision. For these reasons, the positions of the IRRAD tables and shuttle are also continuously monitored. The display and archiving of these positions enable the users to have a visual contact in real time with the ongoing experiment and to see any possibly accidental movement.
As displayed in Fig.10, all the monitored data are acquired through a dedicated hardware system and a server that, after processing, sends them to an Oracle database. From that point on, the data can be visualized in different ways and through different platforms.
Fig. 10. Environmental monitoring system.
V. FURTHER SOFTWARE APPLICATIONS
As described in the previous paragraphs, the IRRAD facility is monitoring all the environmental conditions, including the IRRAD tables and shuttle positions, as well as the characteristics of the beam. All these data points are used by the IRRAD operators, the facility users and other CERN groups (e.g., CCC operators), via different platforms and user interfaces. More specifically, they are used, for instance, for the following purposes.
• Data extraction tools. For example, one of the user interfaces developed is the display of the position of the tables in time. This way, users can easily detect the exact duration of an irradiation, which is a necessary parameter for the further computation of the cumulated fluence.
• Alarms and notifications. Alarms and notifications are controlled by a dedicated application. This application runs continuously and, if needed, notifies the operators whenever a deviation or any unexpected variable change occurs. For instance, if there has been no beam for some time, the IRRAD operators will be notified by e-mail.
• Online Status Panel. A status panel (Fig. 11) integrating all the necessary signals from the BPM intensities, the IRRAD tables and the temperatures is used daily by the operators in order to follow up the facility operation [17].
• Offline data analysis and statistics. The acquired data are also used by the IRRAD users who need to perform their own offline data analysis of the irradiation experiments or want to integrate these data in their research work. Moreover, the IRRAD facility coordinators use the stored data to perform statistical analysis of the irradiation runs. Using this analysis, reports about the quality of the beam, statistical results of the irradiation experiments can be elaborated.
Fig. 11. IRRAD online status panel.
VI. IRRADDATA MANAGEMENT SYSTEM
In addition to the infrastructure, control systems and data related to beam operations, the facility information system also manages the data of the irradiation experiments (requested fluence, type of irradiation, etc.), the samples’ features (type of material, size, shape, etc.) and the users’ identification details (contact information, responsibilities, etc.). As a result, these processes generate a significant amount of data to handle, calling for a facility that provides an efficient and intelligent data management system integrating all the previously mentioned components.
After a research regarding the existing management systems used in other irradiation facilities [18], it was obvious that there was no existing framework that could fulfill the IRRAD requirements. For this reason, it was necessary to build a new integrated data management system. Based on the defined specifications [19], a database schema (Fig. 12) was designed and implemented on an ORACLE database.
Fig. 12. ORACLE database schema.
Then the interfaces, specific to each user profile, were designed. In order to provide different permissions and displays depending on responsibilities, different types of users were defined (i.e., system administrator, IRRAD manager, sample owner, operator and experimental physicist). These users see different interfaces according to their profiles. These interfaces were prototyped using Balsamiq mockups [20], which allowed for easy testing and evaluation of the interfaces
by the users before the full-fledged development (Fig. 13).
Fig. 13. Example of a Balsamiq mockup interface.
Taking into consideration users’ feedback, a first interface prototype was developed. One of the key characteristics of this system is the proper handling of the interaction, exchange and synthesis of the data coming from the various IRRAD individual components, aiming for a full exploitation of these acquired data.
The main functionalities of this system were built as part of the AIDA-2020 EU project [21]. Among these functionalities, the registration of a new irradiation experiment is illustrated in Fig. 14, a step where new samples and users as well as the assignment of samples, users and dosimeters to an irradiation experiment can be declared. The interface also displays the current status of the samples (ready, in beam, completed, etc.), the environmental conditions and the proton beam characteristics.
Fig. 14. Sample owner page displaying the registration of a new irradiation experiment.
Additional features are also taken into account, including: • the cumulated fluence of the samples;
• information about the proton interaction in matter (e.g., total radiation length);
• dosimetry [22];
• and the sample traceability.
VII. TOWARDS A UNIFIED IRRADIATION
FACILITY FRAMEWORK
Due to the mostly experimental nature of irradiation facilities, in many of those, operations are performed manually
and most of the data logged in Excel files and even on paper, as was also done at IRRAD until recently. Some of these facilities do have some software applications that have been developed in-house, or bought from external companies. These are either outdated, due to lack of continuous IT support, or not integrated within a unified data management system. This situation increases the risk of data loss for these facilities and causes inconvenience during irradiation experiments, as, for instance, filling multiple forms by hand, and possible incorrect scientific and technical conclusions from the data analysis.
We believe that there is a need for a new unified irradiation data management framework that could be deployed in any irradiation facility. This framework needs to be abstract enough to comply with all types of irradiation facilities and, in the meantime, flexible enough to be fit to the detailed requirements of each facility.
A. Irradiation Facility Modeling
Designing such a common data management system calls for a thorough investigation of the characteristics of existing facilities and of the details that differentiate them. The results of the research we performed [18] showed that it is necessary to build an abstract irradiation facility model that would fully represent their functionalities and operations. The main characteristics that would identify an irradiation facility are specified below.
• Source. Every facility requires a source, used for the irradiations. This source can be a particle accelerator (linear or synchrotron), a radioactive source or a target on which a particle beam impinges, creating additional radiation fields (see below).
• Devices Under Test (DUT). The purpose of all the irradiation facilities is to expose materials of different kind to radiation. There, prototype devices (e.g., the IRRAD samples) are tested before the full production. • Radiation field
.
The source generates a specificradiation field that is used to irradiate the DUTs. There are different types of radiation fields, e.g., protons, neutrons, gamma or mixed field. The radiation field, energy and flux are the basic characteristics that define the use of each facility. Moreover, size and/or shape are also important parameters.
• Users. The users are those who own or handle the DUTs. They may have different levels of responsibilities, depending on the experiment.
• Irradiation experiment. All the steps of an irradiation experiment have to be specified. The experiment should follow user requirements, while the operators need to provide the most efficient implementation. • Control systems. Usually the irradiation facilities have
specific control systems to navigate their DUTs to specific positions.
• Monitoring and notifications. Monitoring is required for all the experiments in order to manage the conditions under which the irradiation experiments are performed. In case of condition changes, the users and operators have to be notified.
• Dosimetry. For every irradiation experiment, it is necessary to collect the dose rate and the cumulated dose provided to the DUTs. This is achieved through dosimetry. There are different ways to perform a dosimetry, one example being through γ spectrometry. • Storage. After an irradiation experiment, most of the
DUTs need to be stored in specifically designed areas for the cool-down. Depending on the material and the experiment, some samples may be stored at room temperature while others need to be kept in low temperature locations.
• Traceability. After irradiation experiments, in most cases the DUTs become radioactive. Therefore, safety is a key concern in an irradiation facility. To ensure that none of the radioactive equipment will be lost, each item is traced and identified by a specific label. • Radiation protection & Safety. In addition to the safety
issues related to DUTs, irradiation facilities need to ensure also the safety of the users and operators. For this reason, it is necessary and mandatory to carry their dosimeters and/or specific equipment depending on the existing dangers.
• Data analysis. The purpose of each experiment is to derive some useful conclusions that can be extracted by data analysis. In addition, facility coordinators also perform some data analysis in order to assess the performance of their facility and the experiments. • Legislation. Specific legislation is applied to irradiation
facilities, such as the regulations about ionizing radiation or regarding the traceability of radioactive materials and waste.
• Funding. Irradiation facilities follow different principles for the funding and payment methods. Some facilities allow experiments only between collaborations, while other facilities are functioning as companies where they charge their users according to the time they use the facility.
This general model includes the main entities of a typical irradiation facility. However, these entities have specific properties and interconnections among them. For this reason, we posit that the best approach to address these issues is to design an ontology that will represent this model [23].
B. Ontology-based Facility Management System Design
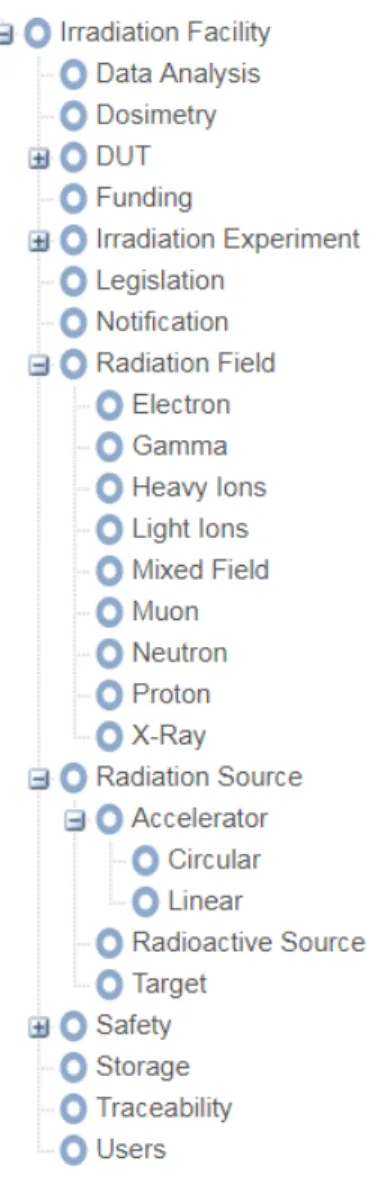
An ontology is an assembly of definitions, properties and interrelations among entities of a specific domain. In the case under study, our domain is the one of irradiation facilities. Such an ontology (see Fig. 15 for an excerpt of one in the domain of irradiation facilities) can represent the overall model, relevant components and subcomponents, but also describe the interrelations and intricacies therein. However, the most powerful characteristic of ontologies is the inference process they can support, where, through the described entities and relations, the ontology system can automatically reach further conclusions.
Fig. 15. Excerpt of irradiation facility ontology.
Even though references to several ontologies related to our domain do exist (e.g., accelerators [24] or control systems [25]), no pre-existing ontology describing the model shown above, or even a similar one, seems to have been reported in the literature. We intend to integrate these prior works, or at least gain inspiration from them, to devise a truly unified irradiation facility ontology that would, in particular, include all the parts still missing from previous works.
Even though such a systemic domain ontology would be to serve as a common knowledge base for the whole irradiation facilities community (thus representing a significant contribution to the field), we intend to study how we can also use it to build a software framework that would automatically generate user interfaces for the overall operation control, monitoring and data management of an irradiation facility. To be successful in the field and suited to more than one facility, such a generic platform system would have to be:
• adaptive, to cater to the various requirements of each irradiation facility;
• multi-profile, to generate interfaces specific to each user’s responsibilities and roles;
• platform-independent, to be independent from the operating systems.
This framework must integrate the needs and particularities of most irradiation facilities, while being, hopefully, easily maintainable. This development would lead to more straightforward and painless operational modalities for irradiation experiments, while increasing the overall performance of the irradiation facilities. The minimization of errors during experiments is also an important goal of such streamlined processes.
This framework, under current development at CERN, will be first evaluated in-house, using the IRRAD facility systems, and will later be made available to external irradiation facilities.
VIII. CONCLUSION AND FUTURE WORK
In HEP, CERN IRRAD is a reference facility for radiation effects testing that collects a significant amount of data derived from its control systems, the environmental and beam monitoring as well as the samples and users data. The first part of this paper describes the systems used for conducting irradiation experiments in IRRAD, as well as the software application developed to store, process, and display them. This diversity of data calls for an integrated data management system, which is currently under development. Currently, this system is dedicated only to the IRRAD facility experiments and processes. However, this system aims to integrate a unified operational model of all irradiation facilities (samples and user’s information, irradiation experiment parameters, etc.) to be used as a general framework easily customizable to the needs of other irradiation facilities, as the ones used by the radiation effects communities.
REFERENCES
[1] W. R. Leo, Techniques for nuclear and particle physics experiments: a
how-to approach. Springer Science & Business Media, 2012.
[2] S. Kayali, W. McAlpine, H. Becker, and L. Scheick, “Juno radiation design and implementation,” 2012 IEEE Aerospace Conference, pp. 1-7. [3] K. Yu, Vukolov, et al., "Main challenges for ITER optical diagnostics,"
in Proc. AIP Conf., Vol. 1612. No. 1. , 2014.
[4] S. Buchner, P. Marshall, S. Kniffin, and K. LaBel, “Proton Test Guideline Development - Lessons Learned,” [Online] Available: https://radhome.gsfc.nasa.gov/radhome/learned.htm.
[5] F. Gianotti, “The CERN Safety Policy,” Jul. 2016 [Online]. Available: https://edms.cern.ch/ui/file/1416908/LAST_RELEASED/SafetyPolicyE N.pdf
[6] F. Ravotti, B. Gkotse, M.Moll, M. Glaser, “IRRAD: The New 24GeV/c Proton Irradiation Facility at CERN,” In Proc.AccApp’15, Washington,
DC, pp. 182-187, 2015 [Online]. Available: http://accapp15.org/wp-content/data/index.html.
[7] M. Glaser, F. Ravotti and M. Moll, “Dosimetry Assessments in the Irradiation Facilities at the CERN-PS Accelerator,”IEEE Trans. Nucl. Sci. vol. 53, pp. 2016-2022, Aug. 2006.
[8] M. Glaser, M. Moll, F. Ravotti, “Installation of new equipment: Movable irradiation tables operational,” AIDA-MS31, CERN, 2013 [Online]. Available: https://cds.cern.ch/record/1594787.
[9] Windows Forms documentation [Online]. Available: https://docs.microsoft.com/en-us/dotnet/framework/winforms/ [10] TMCM-300 V 2.3 Trinamic [Online]. Available: www.trinamic.com [11] F. Ravotti, M. Glaser, M. Moll, “Upgrade scenarios for irradiation lines:
Upgrade of the Proton Irradiation Facility in the CERN PS EAST AREA,” AIDA-D8.4, 2014, [Online]. Available:
https://cds.cern.ch/record/1951308.
[12] Automess webpage. [Online]. Available:http://www.automess.de/. [13] B. Gkotse, M. Glaser, E. Matli, F. Ravotti, “System architecture and data
processing capabilities of the Beam Profile Monitor for the CERN
Proton IRRADiation Facility,” in Proc. NSS, Strasbourg, 2016, to be published.
[14] V. Pugatch, K.T. Knöpfle, Yu. Vassiliyev, “Beam profile imaging target,” Nuclear Physics A 701 (2002), p. 204c–208c, 2002.
[15] SciPy documentation [Online]. Available:
https://docs.scipy.org/doc/scipy/reference/generated/scipy.optimize.curv e_fit.html
[16] M. Paerg, “Measuring relative humidity in the radioactive environment of the IRRAD proton facility,” CERN-STUDENTS-Note-2017-227, CERN, 2017 [Online]. Available: http://cds.cern.ch
[17] M. Bjerke Vik, “Upgrade of the CERN OP Webtools IRRAD page,” CERN-STUDENTS-Note-2017-088, CERN, 2017, [Online]. Available: https://cds.cern.ch
[18] Irradiation Faciliries database website [Online]. Available: https://irradiation-facilities.web.cern.ch/
[19] B. Gkotse, G. Gorine, “Specifications for IRRAD sample & user management system and online database fixed,” AIDA-2020-MS16, CERN, 2016 [Online]. Available: https://cds.cern.ch/record/2159521. [20] Balsamiq webpage [Online]. Available: https://balsamiq.com/
[21] B. Gkotse, G. Gorine, G. Pezzullo, J. Vaitkus, “CERN proton facility upgrade,” AIDA-2020-D15.6, CERN, 2017 [Online]. Available: https://cds.cern.ch/record/2263611/files/AIDA-2020-D15_6.6.pdf [22] M. Glaser, F. Ravotti, M. Moll, “Dosimetry Assessments in the
Irradiation Facilities at the CERN-PS Accelerator,” IEEE Transactions
on Nuclear Science, vol. 53, no.4, Aug. 2006.
[23] N. F. Noy, and D. L. McGuinness, “Ontology development 101: A guide to creating your first ontology,” 2001 [Online]. Available:
http://liris.cnrs.fr/amille/enseignements/Ecole_Centrale/What%20is%20 an%20ontology%20and%20why%20we%20need%20it.htm
[24] J.Szota-Pachowicz, “Building Synchrotron ontology: the analysis of synchrotron control system in collaborative environment,” Computer
Science, vol 18 (1), pp. 53, 2017.
[25] L. Yang, K. Cormican, and M. Yu, “An Ontology Model for Systems Engineering Derived from ISO/IEC/IEEE 15288: 2015: Systems and Software Engineering-System Life Cycle Processes,” in World Academy
of Science, Engineering and Technology, International Journal of Computer, Electrical, Automation, Control and Information Engineering