Université de Montréal
Microcalorimetric Study of the Temperature-Induced Phase
Separation in Aqueous Solutions of Thermosensitive Polymers
Par
Charbel Diab
Département de Chimie
Faculté des Arts et Sciences
Mémoire présenté à la Faculté des études supérieures
en
vue
de l’obtention du grade de
Maître
ès Sciences (M.Sc.)
en chimie
Septembre 2004
( îNfl-)
14h
de Montréal
Direction des bibliothèques
AVIS
L’auteur a autorisé l’Université de Montréal à reproduire et diffuser, en totalité ou en partie, par quelque moyen que ce soit et sur quelque support que ce soit, et exclusivement à des fins non lucratives d’enseignement et de recherche, des copies de ce mémoire ou de celle thèse.
L’auteur et les coauteurs le cas échéant conservent la propriété du droit d’auteur et des droits moraux qui protègent ce document. Ni la thèse ou le mémoire, ni des extraits substantiels de ce document, ne doivent être imprimés ou autrement reproduits sans l’autorisation de l’auteur.
Afin de se conformer à la Loi canadienne sut la protection des renseignements personnels, quelques formulaires secondaires, coordonnées ou signatures intégrées au texte ont pu être enlevés de ce document. Bien que cela ait pu affecter la pagination, il n’y e aucun contenu manquant.
NOTICE
The author of this thesis or dissertation has granted a nonexclusive license allowing Université de Montréal to reproduce and publish the document, in part or in whole, and in any format, solely for noncommercial educational and research purposes.
The author and co-authors if applicable retain copyright ownership and moral rights in this document. Neither the whole thesis or dissertation, nor substantial extracts from it, may be printed or otherwise reproduced without the author’s permission.
In compliance with the Canadian Privacy Act some supporting forms, contact information or signatures may have been removed from the document. While this may affect the document page count, it does not represent any loss of content from the document.
1
Université de Montréal
faculté des études supérieures
Ce mémoire intitulé:
Microcalorimetric Study of the Temperature-Induced Phase
Separation in Aqueous Solutions of Thermosensitive Polymers
Présenté par:
Charbel Diab
a été évalué par un jury composé des personnes suivantes:
Président-rapporteur
: Prof. Julian Zhu
Directrice de recherche : Prof. Françoise M. Winnik
Membre du
jury
: Prof. Suzanne Giasson
Résumé:
Certains polymères, tels que le poly(vinylméthylether), l’hydroxypropylcellulose, le poly(N-isopropylacrylamide) (PNIPAM) et bien d’autres sont solubles dans l’eau froide mais précipitent lorsque leurs solutions sont chauffées. Cette propriété est utilisée dans des applications industrielles et présente également un très grand intérêt scientifique. Dans ce projet. les solutions aqueuses de deux polymères thermosensibles, la poly(2-isopropyÏ-2-oxazoline) et le poly(N-vinylisobutyramide), ont été étudiées par microcalorimétrie et turbidimétrie dans le but de connaître les paramètres thermodynamiques contrôlant leur transition de phase. L’influence de la masse molaire des polymères sur leur solubilité dans l’eau a été examinée en fonction de la temperature. En plus, les propriétés de ces polymères ont été comparées à celles de PNIPAM dont la structure est très proche de celles de poly(2-isopropyl-2-oxazoline) et de poiy(N vinylisobutyramide).
Dans ce but, trois techniques ont été utilisées 1- La calorimétrie thermique différentielle (DSC). 2- La calorimétrie par perturbation de pression (PPC). 3- La turbidimétrie (UV-visible).
La DSC nous a permis de déterminer la température de séparation de phase, l’enthalpie de la transition de phase ainsi que d’autres paramètres thermodynamiques; d’autres part la PPC a été utilisée pour mesurer le coefficient d’expansion thermique du polymère et le changement du volume d’hydratation du polymère durant la transition de phase. En outre, la turbidimétrie a servi pour la détermination du point de trouble des solutions de polymères. Cette étude révèle que ces polymères possèdent différentes
propriétés physiques malgré qu’ils ont des structures similaires, ceci est du au fait que leur interaction moléculaire avec l’eau diffère.
Mots- clés: Solubilité, interactions moléculaires, point de trouble, température de transition, volume d’hydratation, calorimétrie, poly(N-vinylisobutyramide), poly(2-isopropyl-2-oxazolines).
Abstract
Polymers, such as poly(vinylmethylether), hydroxypropylcellulose, poly(N isopropylacrylamide) (PNIPAM) and others are soluble in cold water, but they precipitate when the solution is heated. This property is used in industrial applications and it becomes a topic of major scientific interest. km this project, two thermosensitive polymers, the poly(2-isopropyl-2-oxazolines) and the polyN-vinylisobutyramide) have been studied by microcalorimetry in order to determine the thermodynamic parameters that control the solubility of these polymers in water. The effect of the molecular weight of the polymer on their solubility was also examined. The properties of polymers were compared with those ofPNWAM since their chemical structures are closely related.
To do so, three techniques were used: 1- Differential scanning calorimetry (DSC). 2- Pressure perturbation calorimetry (PPC). 3- Turbidity measurment (UV-Visible).
DSC allowed us to determine the phase separation temperature, the enthalpy of the phase transition as well as other thermodynamic parameters. PPC was used to measure the thermal expansion coefficient of polymers and the changes in the volume of the hydration layer of the polymers. Moreover, the UV-visible was utilised for the determination of the turbidity points of the polymer solutions. Our studies reveal that these p olymers h ave different physical properties whereas they have similar structures, this could be due to their different molecular interactions with water.
Keywords: Solubility, molecular interactions, cloud point, transition temperature, hydration volume, calorimetry, poly(N-vinylisobutyramide), poly(2-isopropyl-2-oxazolines).
Table of contents
Résumé iii
Mots clés iv
Abstract y
Keywords vi
Table of contents vii
List ofabbreviations x
Listoffigures xii
Listoftables xvi
Acknowledgrnents xvii
CHAPTER 1 1
1. The interactions propertïes of aqueous polymer solutions 2
1.1 Introduction 2
1.2 Hydrogen bonding 2
1.3 Hydrophobic interactions 4
1.4 Cloud point of aqueous polymer solutions 4
1.5 f actors affecting the cloud point 5
1.5.1 Polymerproperties 5
1.5.1.1 Polymer structure 5
1.5.1.2 Polymermolecularweight 6
1.5.2 Solventproperties 6
1.5.2.1 Effectofthesolvent 7
1.5.2.2 Effect of added sait 8
2. The polymers studied 10
2.1 Introduction 10
2.2 Poly(2-isopropyi-2-oxazoline) (PIPOZ) 12
2.3 Poly(N-vinylisobutyramide) (PNVffiA) 13
3. The microcalorimetry techniques 14
3.1 Introduction 14
3.2 Differential scanning calorimetry (DSC) 14
3.2.1 Theexperiment 14
3.2.2 Information obtained from DSC measurements 16
3.2.3 Domains of application 16
3.3.1 Introduction 17
3.3.2 Theexperiment 17
3.3.3 Information obtained from PPC measurements 19
3.3.4 Domains of application 19
4. The scope of the thesis 20
5. References 22
CHAPTER2 26
Presentation ofthe article 26
Microcalorimetric Study ofthe Ternperature-Induced Phase Separation inAqueous
Solutions ofPoly(2-isopropyl-2-oxazolines) 26 1. Abstract 27 2. Introduction 28 3. Experimental Section 32 3.1 Materials 32 3.2 Instrumentation 33
4. Synthesis and measurements 33
4.1 Preparation of 2-Isopropyl-2-oxazoline 33
4.2 Polymerizations 34
4.3 Cloud point determinations 34
4.4 Differential scanning calorimetry (DSC) 35
4.5 Pressure perturbation calorimetry (PPC) 35
5. Resuits 37
5.1 Preparation and Characterization of the Polymers 37
5.2 Phase transition ofthe oligomers in water 40
5.2.1 Turbidity measurements 40
5.2.2 High sensitivity differential calorimetry 42
5.2.3 Pressure perturbation calorimetry 46
6. Conclusions 48
7. Acknowledgments 50
8. References 51
CHAPTER 3 55
A Study by Dfferential Scanning Calorimetiy and Pressure Perturbation
Calorimetry of the Thermal Properties ofpoly(N-vinylisobutyramide in water..55
1. Introduction 56
2.1 Materials .58
2.2 Synthesis and characterization of PNVfflA 59
2.3 Instrumentation 60
2.3.1 Differential scanning calorimetry (DSC) 60
2.3.2 Pressure perturbation calorimetry (PPC) 60
3. Results and discussion 61
3.1 High-Sensitivity differential scanning calorimetry 61
3.2 Pressure perturbation calorimetry 66
4. Conclusion 71 5. References 73 CHAPTER 4 75 Conclusion 75 1. Conclusion 76 2. Referen ces 78 Appendix A 79
Abbreviations list
DSC Differential scanning calorimetry
PPC Pressure perturbation calorimetry
HS DSC High-sensitivity differential scanning microcalorimetiy
PIPOZ Poly(2-isopropyl-2-oxazolines)
NaC1 Sodium chloride
D20 Deuterium oxide
H20 Water
PNIPAM Poly(N-isopropylacrylamide)
PNVIBA Poly(N-vinylisobutyramide)
PEG Poly(ethylene glycol)
PEOZ Poly(2-ethyl-2-oxazolines)
PMOZ Poly(2-methyl-2-oxazolines)
M Number average molecular weight
M Average molecular weight
PDI Polydispersity indice
NMR Nuclear magnetic resonance
MALDI-TOF Matrix assisted laser desorption ionization time of light
GPC Gel permeation chromatography
RAFT Radical addition fragmentation transfer
UV-Vis Ultraviolet-visible
LiC1 Lithium chloride THF Tetrahydrofuran CDC13 Chloroform-d t Triplet m Multiplet d Doublet
ppm Part per million
h Hour
Chemical shifi in NMR Wavelength
Thermal expansion coefficient
n Number of repeat unit
mlz Mass over charge in MALDI-TOF
C, Heat capacity
Tonset Temperature of the onset of the transition
Tmax Maximum temperature of transitions
AH The enthalpy of the transition
AV The change in the solvation layer of the polymer
List of figures
Chapter 1
figure 1 2
Example ofhydrogen bond between a hydrogen atom and nitrogen or oxygen atoms.
Figure 2 3
Hydrogen bonds forrned in ammonia (lefi) and water (right).
Figure 3 11
Chemical structure of the repeat units of polyN-isopropy1aciylarnide) (PNIPAM),
poly(N-vinylisobutyrarnide) (PNVIBA), and poly(2-isopropyl-2-oxazoline) (PIPOZ).
Figure 4 12
Temperature dependence of the turbidity of PIPOZ50-OH in II2O Polyrner
concentration: 1 g L’.
Figure 5 13
Microcalorimetric endotherms for a solution of PNVIBA82 in F120. Polyrner
concentration 1 g L1. Heating rate: 60°C h’.
Figure 6 15
(Lefi) Raw data expressed in cal/min generated from a microcalorimetry scan. (Right) the
output converted into heat capacity (cal moF’ °C).
Figure 7 18
Schematic diagram of the pressure perturbation calorirnetry (PPC) experimental setup.
ceil, which counterbalances the volume occupied by the solute molecules in the sample
celi.
Figure 8 19
Experimental PPC trace registered for a solution poly(N-isopropylacrylarnide) in II2O.
Polymer concentration: 5g L, temperature 20
oc.
Chapter 2
Figure 1 30
chenical structure of the repeat units of poly(2-ethyl-2-oxazoline) (PEOZ), polyÇN,N
dimethylacrylarnide), poly(2-isopropyl-2-oxazoline) (PIPOZ), and poly(N
isopropylacrylamide) (PNIPAM).
Figure 2 37
Reaction scheme for the preparation of poly(2-isopropyl-2-oxazolines) and structure of
the polymer.
Figure 3 39
MALDI-TOF mass spectrum of PIPOZ50-OH obtained after 168 h polymerization. An
expanded view ofthe spectrum ranging from 6100 to 6400 amu is given in the inset.
Figure 4 40
‘H NMR spectrum of PIPOZ21-OH in DC13.
Figure 5 43
Microcalorimetric endotherms for aqueous solutions of PIPOZ-OH samples in water.
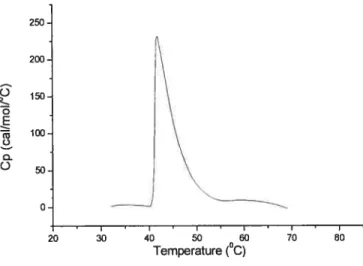
Figure 6.45
(top) Plots of the changes as a function of polymer concentration of the transition temperature, Trn (full circle), and of the cloud point, CP (full triangle), for aqueous solutions of PIPOZ41-OH. (bottom) Plots of the changes as a function of polymer molecular weight of the enthalpy of the transition, AH (open circle), the temperature corresponding to the maximum in D$C enthalpograms, Tm (full circle), and the cloud point, CP (full triangle), for aqueous solutions of poly(2-isopropyl-2-oxazolines). Polymer concentration: 1.0 g L1. Heating rate: 60 oc min1.
figure 7 47
(top) Microcalorimetric endotherms for a solution of PIPOZ50-OH in H20 and in D20. Polymer concentration 1 g L’. (bottom) Temperature dependence of the coefficient of thermal expansion (a01) of PIPOZ50-OH in H20 (full circle) and in D20 (open circle). Polyrner concentration: 5 g L’. The doted line corresponds to the progress baseline.
Chapter 3
Figure 1 57
cheinicay structure of the repeat units of poly(N-isopropylacrylamide) (PNIPAM) and poly(N-vinylisobutyramide) (PNVIBA).
Figure 2 61
Microcalorimetric endotherms for aqueous solutions of PNVIBA44 (solid line) and PNVIBA82 (dashed line) samples in water. Polymer concentration: 1.0 g L* Heating rate: 60°c h*
Figure
3.63
Microcalorirnetric endotherms for aqueous solutions of PNVIBA44 with two different concentrations: Polymer concentrations: 1g L (solid une) and 5g L’ (dashed une) in water. 1.0 g L1. Heating rate: 60 °C h1.Figure
4
64
Microcalorimetric endotherms for aqueous solutions of PNVIBA44 in the presence of different concentrations of salts. Polymer concentration 5g/l. Heating rate: 60 oc lï’.
figure 5
65
Microcalorirnetric endotherms for a solution of PNVIBA82 in H20
(
solid line) and in D20 (dashed line). Polymer concentration 1 g L’. Heating rate: 60°c
W’.Figure 6
67
Temperature dependence of the coefficient of thermal expansion (Œ0,) of PNVIBA44
(Top) and of PNVIBA82 (bottom). Polymer concentration: 5 g L1 The doted une corresponds to the progress baseline.
Figure 7
69
Temperature dependence of the coefficient of thermal expansion (OEpol) of PNVIBA82 in
H20 (Top) and in D20 (bottom). Polymer concentration: 5 g L’ The doted line corresponds to the progress baseline.
Figure$
70
Temperature dependence of the coefficient of thermal expansion (Œ0i) of PNVIBA44 in
List of tables
Chapter 1
Table 1 7
Physical properties ofD2O and F120.
Chapter 2
Table 1 3$
Polymerization conditions and characteristics of the poly(2-isopropyl-2-oxazolines) sttidied.
Table 2 41
Thermodynamic parameters of the poly(2-isopropyl-oxazolines) studied.
Chapter 3
Table 1 59
Characteristics of the poly(N-vinylisobutyramide) studied.
Table 2 62
Acknowtedgments
First of ail I would like to express my thankfui gratitude for my supervisor Prof. françoise M. Wiimik. She has been aiways extremely generous and aiiowed me great freedom in this research. Her enthousiastic and exciternent for polyrner chemistry have made this work enjoyabie and I am greatly appreciative.
Special thanks to ail my colleagues in the group. In detail, I wouid like to thank: Mariana Criesta, Roger Liu, Maria-Victoria Valencia-Grayeb, Mara Piredda, Mira Francis, Julie Murray, Suzanna Holoppa, Doriane Richad-Viart, Cui E Yan, San Jin Park, Yong Kuang Gong, Antti Laukkanen, Hassan Bazzi, Siwar Chayed, f iorence seg, frederic friscourt and Yali Yang. Ail of them have become valuabie and close friends. They have helped me in several occasions.
I wouid like to thank Dr. Piotr Kujawa for many heipful and ftuitfui discussions for the interpretation of PPC data.
Last, but certainiy flot least, I am grateful to rny parents for their permanent support, prayers and encouragement. Without you, this would flot have been possible.
CHAPTER 1
1. The interactions properties of aqueous polymer solutions:
1.1. Introduction
The dissolution of polymers in water is a complex phenomenon that involves a
number of weak interactions, such as the hydrogen bond formation between water and
functional groups linked to the polymer, van der Waals interactions, and in the case of
polyelectrolytes, ionic interaction between the charged units of the polymer, their counter
ions, and additional saits under some situations. These interactions act together to
facilitate, or prevent, the dissolution of a polymer. The physicochemical characteristics of
these interactions are reviewed in the next section.
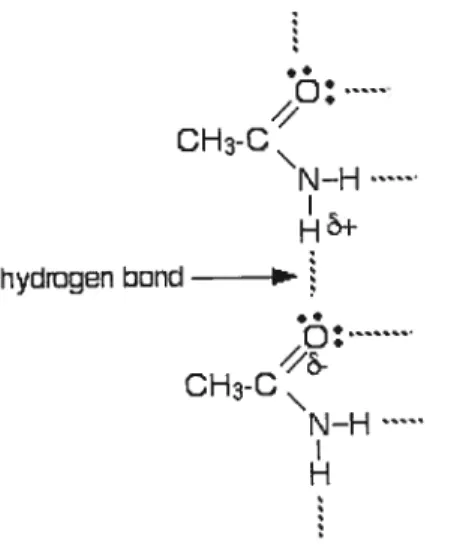
1.2 Hydrogen bonding
Hydrogen bond occurs when two electronegative atoms, such as nitrogen and
oxygen, interact with the same hydrogen atom as shown in this figure below.
r—’. CH3-C\ N-H hydingen bond (_.l• CH3-C N-H
Figure 1: Example of hydrogen bond between a hydrogen atom and nitrogen or oxygen
The hydrogen atom is normally covalently attached to one atom, the donor, but interacts electrostatically with the other, the acceptor. This interaction takes place between the dipoles of the electronegative atoms and the proton. One useful picture of a hydrogen bond is electrostatic, an attraction between the positive end of a dipole on one molecule and the negative end of a dipole on another. The more polar the molecule involved, the greater the degree of positive and negative charge associated with the dipoles, and the stronger the hydrogen bond, as depicted in figure 2 in the case of water and ammonia. Hydrogen bond (2O kJmoF’) is a weak [compared to covalent bonds Q465 kJmoF1)] attraction between the unshared electron pairs on nitrogen or oxygen in one molecule and on hydrogen (covalently bonded to nitrogen or oxygen) on another.
Hydrogen bond H H
I
H/
HH hydrogenbond H’/
Ho
H Ammonia Water1.3 Hydrophobic interactions
Another very important interaction, which takes place when amphiphilic polymers are placed in contact with water, is the interaction between nonpolar substituents of the arnphiphile that cannot form H-bonds with H20. These groups are hydrophobic (water hating), as opposed to “water loving”, hydrophilic. Hydrophobie molecules or groups tend to aggregate to avoid H20 molecules. Hydrophobie interactions are clearly demonstrated when one puts an ou drop in water. In fact, when a nonpolar molecule is placed in water the hydrogen bonding network of water us disrupted, the water molecules therefore reorganize around the solute in order to gain back free energy loss due to the loss of hydrogen bonds. This reorganization resuits in a considerable loss in the entropy
ofwater.
1.4 Cloud point of aqueous polymer solutions
A large number of aqueous polymer solutions exhibit a heat-induced phase separation in water. This can be visualized readily in rnost cases: a clear polymer solution suddenly becomes milky when it is heated to a specific temperature. This temperature is known as the lower critical solution temperature (LCST) or sornetimes clouds point (CP). This property has been investigated by several research groups with various polymers
[1,2]. They reported that aqueous solutions of polymers exhibit a cloud point temperature
that depends on the structure of the polyrner, its molecular weight [3] and the concentration of the solution [4].
AGO, so that the free energy of the solution is lower than the Gibbs energy of the
mixture of water and the polymer. The relationship between the free energy, the enthaÏpy
and the entropy is given by the thermodynamic equation below:
A G AH
—TAS
where G isthe Gibbsfree energy, H the enthalpy, T the temperature,and S the entropy.
Below the LCST, the dissolution of the polymer in water is favoured as a resuit of
hydrogen bonding between water molecules and the polymer chains. The formation of
hydrogen bonds lowers the free energy AG of the solution; however, the specific
molecular orientations required by these bonds lead to negative entropy changes AS and
consequently positive contributions to the free energy leading to phase separation above
the LCST when the enthalpic contribution AH to the free energy is dominated by the
growing entropic component [5].
1.5 Factors affecting the cloud point
1.5.1 Polymer properties
1.5.1.1 Polymer structure
The LCST of a polymer in aqueous solution can be controlled by varying its
chernical composition, namely changing the fraction of the hydrophilic groups and
hydrophobie groups, by changing the polymer concentrations or molecular weight. for
which include hydrophilic ethylene oxide units and hydrophobic ethylene units.
Controlling the fractions of the hydrophilic monomer and hydrophobic monomer in the
polyrner, the LCST of the polymer in solution may be controlled over a wide temperature
range[6]. The phase separation temperature of the aqueous solution can be controlled,
also, by varying flot only the ratio of hydrophilic- hydrophobie components, but also their
distribution along the chain.
1.5.1.2 Polymer molecular weight
Many researchers have reported the molecular weight influence; depending on the
polymer, there exists an inverse dependence of the LCST on the molar masses [3, 7], but
the opposite may take place as weÏÏ [8]. Moreover, studies reported that the molecular
weight had no influence on the LCST [9, 10]. In the study presented in this thesis, it will
be dernonstrated that the molecular weight affects enormously the LCST of the polymers
studied.
1.5.2 Solvent properties
A number of parameters have been reported to influence the hydrogen bonding and
the hydrophobie interactions in aqueous solution of polymers, thereby influencing the
LCST of aqueous polymer solutions. Presented in this section, are die effeet of solvent
and of added salt.
1.5.2.1 Effect of the solvent
The LCST of aqueous polyrner solutions changes when one replaces II2O by D20
[7]. Reavy water is known to have sirnilar properties as light water, but there are some
various theories. Some of the physical properties of D20 and H20 are listed in Table 1.
Briefly, D20 is denser and more viscous than H20 and has highei- melting and boiling
points. Differences in other physical properties are less rnarked. Deuterium bonds in D20
are stronger than the analogous hydrogen bonds in H20.
Property D20 H20
Melting point (°C) 3.82 0
Boiling point (°C) 101.72 100.0
Density (20°C, g/mL) 1.1056 0.9982
Temp. of maximum density (°C) 11.6 4.0
Viscosity (20°C, centipoise) 1.25 1.005
Surface tension (25°C, dyncm) 71.93 7 1.97
Heat of fusion (cal/mol) 1.515 1.436
Heat of vaporization (cal/mol) 10,864 10,515
Table 1: Physical properties ofD2O and H20.
Note: Surface tensions and dielecfric constants ofl-120 and D20 are essentiaÏÏy identicat.
J poise = 0.] Foes; 1 dyn = 10 mN J cal 4.18581
In general, D20 has two effects on polymer solutions. One is a “solvent effect,”
because of the properties of D20 itse1f and especially its effects on the structure of water
moiecuies. The first effect, which is mostly the effect ofhydrogen bonding, was studied for the poly(N-isopropylacrylamide) (PNIPAM) in D20 and H20 [2]. The LCST of PNIPAM was found to be higher in D20 compared to F120. The underlying reasons for this increase are flot precisely known but it lias been observed that polymer chain in D20 solutions take on more extended conformations than with H20[1 1]. Furthermore, the amide bond of the PNIPAM is more exposed to water below the LCST. Moreover, the hydrogen bond is 5% stronger in D20 than F120 [12] . so that breaking the hydrogen bonds between water molecules and amide moieties will be more costly enthalpically in D20, thus the LCST will occur at higher temperature.
1.5.2.2 Effect of added satt
The presence of salts in the solutions may decrease or increase the LCST [4, 7, 13, 14, 15]. The sait effect on the LCST of thermosensitive polyrners is due to sait induced changes of the water structure. Some saits increase the LCST of the polymers, a phenornenon called “salting-in” effect, while other saits decrease it, the “salting-out effect”. Most of the inorganic saits have shown to trigger a salting out (water structure maker) effect on the solution of the polymers [10]. Salting-out is believed to be due to the removal of water associated with the polymer by the sait. Salting-out has been expÏained also by the fact that work is required for an organic moiecule of low dielectric constant to corne between such ions as Na and CF. which have no specific interaction with the molecule [16]. This effect was dependent on both cations and anions, von Hippel and coworkers [17] have reported that cations and anions are effective in altering the cloud point of a solution of poly(ethylene oxide) substituted
with methoxypoly(ethylene glycol) and glycine ethyl ester in the order of salting-in to salting-out effect:
Li>NH4>K, Na and C104>Br>Cf>F>C032>S042’
Similarly, Home and coworkers [18] have investigated the salt effect on the cloud point of the PEO system, and they found that the order of the salting-in and salting-out effect of the cations and anions was almost the same as the above resuits. In fact, an increase in the concentration of a water structure breaker salt, such as NaI, induces an increase in hydrogen bonding between molecules of water and the polymer, resulting in an increase of the LCST. On the contrary, water structure makers such as NaC1, decrease the interaction of water with polymers, resulting in a decrease ofthe LCST.
The effect of organic saits on the LCST depends on both cations and anions. The larger cations have a more pronounced salting-in effect; they enhance the hydrogen-bonded structure because of their very hydrophobic nature. Such cations can bind to the hydrophobic part of the polymer, resulting in an increase in the hydrophilicity of the polymer molecules [19]. for example, in the case of tetraalkylamrnonium halides, the chain length of their aikyl groups plays an important role: an increase in the chain length of the alkyl group leads to an increase in the LCST of the polymer solutions [19]. In contrast, the ability of a given halide to lower the LCST decreases with its size. Since fluoride has the strongest tendency to form hydrogen bonds with water molecules, less water is available to solvate the macromolecules. These cations and anions follow the classical series demonstrated by Hofmeister for the salting out and salting in. According to von Hippel’s analysis, this should effectively decrease the
number of soïvent molecuÏes available to solvate the polymer thereby making h easier for moiecuies to aggregate or sait out of solution [17].
2. The polymers studied
2.1 Introduction
Poiymeric materiais that respond to externai stimuli such as temperature, pH, solvent quality, or light by changing their physical or chemical properties have been a topic of major interest in the iast few decades [20, 21, 22]. Among them, temperature responsive polymers were studied in great detail due to their possible applications in drug delivery systems (DDS) [23, 24], enzyme activity controi [25, 26], soiute separation through membrane [27], immunodiagnostic assays, purification and partitioning in biotechnology [23, 25]. However, their applications to DDS have been difficuit because most of the thermosensitive polymers are nonbiodegradabie and some are even toxic. Several polyacrylarnides such as poly(N-isopropyiacrylarnide) (PNIPAM) and their copolymers that respond to environmental changes, as a rule, they are not biocompatible. Poly(N-isopropyÏacrylamide) (PNIPAM) is a thermosensitive polymer that exhibits phase separation in aqueous solution around 31°C [2]. Its suitability as drug carrier is questioned by many because vinyl polymers are difficuit to degrade in the body. In contrast, water-soluble polymers like poly(2-substituted-oxazoline) with properties such as biocompatibility, functionality, nontoxicity, and sterilizability are potential biomedical materials [2$, 29]. from this point of view new functional materials are needed and consequently the temperature induced phase separation of these polymers aqueous solutions has attracted the
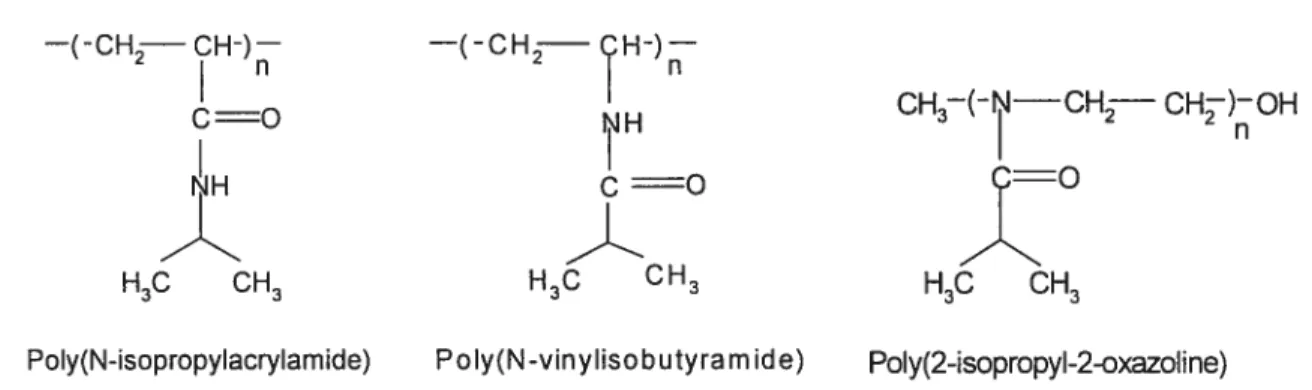
attention of many research groups [30, 31, 32]. This interest stems from the potential applications in various devices, in biomaterials and in drug delivery systems. For example poly(2-ethyl-2-oxazolines)(PEOZ), a water soluble polymer, was shown to have a lower toxicity than poly(ethylene glycol) [31]. Polymer complexes composed of PEOZ and poly(methacrylic acid) have been designed for uses in on-off insulin released matrices [32]. PEOZ-based hydrogels also show swelling/deswelling behaviours in response to temperature and pH changes [33]. Amphiphilic block copolymers based on hydrophilic PEOZ and hydrophobic poly(L-lactide)(PLLA) have been designed as intelligent drug carriers [34]. Therefore, the synthesis and the study of novel poly(oxazolines) that possess a combination of these enabling properties is important, as it will help to develop new drug delivery systems thereby extending their field of applications. This thesis describes a study of two thermosensitive polymers, poly(2-isopropyl-2-oxazoline) and poly(N vinylisobutylacrylamide), which are similar in structure to PNIPAM (shown in figure 3) but exhibit different properties in solutions.
—(-CH——CH-)— —(-CH——cH-)—
NH CH3HJ—CHj-— CHOH
=0
À
H3C 0H3 H3C 0H3 H3C CH3
PoIy(N-isopropylacrylamide) Pc Iy(N -vinyliso bu tyra m ide) PoIy(2-isopropyl-2-oxazoline)
Figure 3 Chemical structure of the repeat units of poly(N-isopropylacrylamide) (PNIPAM), poly(N-vinylisobutyramide) (PNVIBA), and poly(2-isopropyl-2-oxazoline) (PIPOZ).
2.2 PoIy(2-isopropyl-2-oxazoline) (PIPOZ)
Poly(2-isopropyl-2-oxazoline) (PIPOZ) is prepared by cationic ring-opening polymerization of isopropyl oxazoline using a tosylate derivative as initiator, followed by termination with a NaOH/methanol solution yielding hydroxyl-terminated chains [35, 36]. Interestingly, PIPOZ aqueous solutions are temperature sensitive [37]: PIPOZ is soluble in cold water but separates from solution above a critical temperature (45-63°C).
2.5 -2.0 1.5 -> -t, -e 1.0-D I— 0.5 -0.0 -38
Figure 4 Temperature dependence of the turbidity of PIPOZ50-OH in F120 . Polymer
concentration: 1 g
The cloud point of the solution of PIPOZ depends on molecular weight, the solvent (T12O
or D20), the concentration ofthe solution, and added salts.
As PIPOZ can 5e prepared by living polymerization, it can be obtained with low polydispersity and functional groups can be introduced at each chain end, thus enabling further modification [35, 36]. More importantly, it has been shown to be non cytotoxic and biocompatible [3$]. These properties render PIPOZ derivatives useful as drug carriers, and as coatings ofmedical devices to improve their surface biocornpatibility.
-l I I • I •
40 42 44 46 48 50 52 54 56
2.3 PoIy(N-vinylisobutyramide) (PNVIBA)
Poly(N-vinylisobutyramide) has been prepared by free radical polymerization of N-vinylisobutyramide in a variety of solvent and initiators at 60°C. The initiators used are potassium persulfate (KP$), 2,2-azobis(N,N-dirnethyleneisobutylamidine) dihydrochioride (VA-044), benzoylperoxide (BPO), 2,2’ -azobi sisobutyronitrile (AIBN).
Poly(N-vinylisobutyramide) (PNVIBA) is a thermoresponsive, water-soluble polymer. Its solubility responds sharply to temperature changes
(
Figure 5).250 200 150 o E 100 o o 50 0 20
Figure 5 : Microcalorimetric endotherm for a solution of PNVIBA82 in H20. Polymer concentration 1 g L1. Heating rate: 60°C h’.
It shows an LCST that depends on the molecular weight of the polymer, the concentration of the solution, and the amount of added salt [39], this LCST can be increased or decreased by copolymerisation with hydrophilic or hydrophobic monomers [40]. Since it is possible to produce copolyrners with wide variety of functions, PNVIBA derivatives are starting materials for various water soluble functional polymers [41]. Hydrogels based on PNVIBA with thermal and pH responsiveness have been prepared
1•1’1•1’j r
30 40 50 60 70 80
using suitable cross-linkers [42, 43]. The solution properties of PNVIBA show rnany similarities to those of PNIPAM, but also exhibit subtle in several features of the phase transition process, such as transition sharpness, higher transition temperature for PNVIBA.
3. The microcalorimetry techniques: 3.1 Introduction
Most physico-chemical processes have an associated heat effect, therefore rnicrocalorimetry can be used both for analytical applications and for fundarnental studies of thermodynamic principles. The thermodynamic parameters that control macromolecular interactions in solution can be measured directly using microcalorimetric methods, and a large set of data is now available for protein folding, protein-ligand and protein-protein interactions [44]. Examples will be given here of the use of high sensitivity differential scanning calorimetry (DSC) [45, 46, 47], and the recently introduced technique of pressure perturbation calorimetry (PPC) [46, 47, 48, 49] which gives new information about hydration changes in temperature dependent molecular processes.
3.2 Differential scanning calorimetry (DSC): 3.2.1 The experïment
A differential scanning calorirneter measures the heat absorption or release in a sample as a function of temperature. A pair of matched celis is placed in a thermostated chamber. The sample celi is filled with a polyrner solution. The reference celI is filled with an identical volume of solvent. The two celis are heated with a constant power input to their heaters during a scan. Any temperature difference
between the two ceils is monitored with a feedback system so as to increase (Or
decrease) the sample celi power input. $ince the masses and volumes of the two ceils are matched, the power added or subtracted by the celi feedback system is a direct measure of the difference between the heat capacity of the sample and reference solutions. The celi feedback power is the raw data, usually expressed in units of cal/min, generated by a microcalorimetry scan. By knowing the scan rate (typically 1 °C/rnin) and the sample concentration, the output is converted into heat capacity (cal.moF1. °C)) (Shown in figure 4) using the formula:
dQp
1-c
t)
where
Q,
is the heat absorbed at constant pressure; t is the time; G is the scan ratedT!dt; T is the temperature; M is the number of moles of sample in the sample cell and turne is converted to temperature using the formula t.G.
A
B
-AH= M3 % E G Temperature (°C) Temperature (°C)Fïgure 6 : (A) Raw data expressed in cal/min generated from a microcalorimetry scan. (B) the output converted into heat capacity (cal moF’ °C).
Raw Data D.04 03 z. 01 s— T
3.2.2 Information obtained from DSC measurements
Differential scanning calorimetry (DSC) is used to obtain the thermodynamic
parameters associated with heat-induced macromolecular transitions. The apparent molar
heat capacity of a macromolecule in solution is measured as a function of temperature,
subsequently yielding: the partial heat capacity, including changes in the enthalpy (AH),
entropy (AS), heat capacity (ACe) during a transition, and the temperature of the
transition T1. Simply, the temperature dependencies of AH and AS are the consequences
of the significant heat capacity change AC associated with such interactions. and the
relationship is given by the equations below:
7.>’;» AH ÇACp.dT
ACp(
TT>Tm TT<Tm) (2) 1<7; r>; AC —J-dT AC ln (TT>Tm/ TT<Tm) (3)where TTm is the temperature range above the phase transition temperature and T<Tm
is the temperature range beÏow the phase transition temperature.
3.2.3 Domains of application
DSC techniques have been used to evaluate the thermal stabi!ity of solute and to
detect phase transitions associated with macromolecules in solutions. It has become a
widely used tool for studying conformational transitions of proteins, lipid assemblies and
polymers [50, 51]. In the last decade, the applications of this technique have grown
rapidly due the availability of highly sensitives instrument which are easy to use, and
yield highly reproducible resuits.
3.3.1 Introduction
Pressure perturbation calorimetry is a technique that measures the heat change in
a solution that resuits when the pressure above the solution is changed. When used in a differential calorimeter containing a dilute solution of solute in the sample ce!! and the solvent in the reference ce!!, the differential heat measured can be used to calculate the coefficient of thermal expansion of the solute UL, cL 1/V(ÔV/aT) r’. for proteins and
polymers in dilute aqueous solution, cLmacr is dominated by a temperature-dependent
contribution arising from the interaction of the macromolecule with water functiona! groups. This arises due to the effect of macromolecule groups on the hydrogen-bonded structure of water molecules surrounding the polymer chain, and thereby clearly differentiates between structure-making hydrophobic groups and structure-breaking hydrophilic groups. The technique can be extended to calculate the changes in the volume of the solvation layer around a po!ymer chain before and after a phase transition.
3.3.2 The experiment
The PPC measurernent can be performed in a DSC instrument fitted with a special accessory that applies a pressure increase fo!lowed by pressure release to a sample kept at constant temperature. The maximum pressure applied is 500 kPa. The calorimetric baseline is equilibrated at constant temperature and pressure Pi. The pressure is then changed to P2 causing heat to be absorbed in both ce!!s. The compensation heat (Qrev) required to maintain the sample temperature constant due to
temperature and is obtained by integrating the area under each peak. The temperature is then changed, the baseline is allowed to equilibrate and the compression /decompression is repeated. A number of such pressure jumps are performed automatically at different temperatures yielding the expansivity as a function of temperature, Œ 1/V(8v/ÔT)1. using the relationship:
(4 dFdT
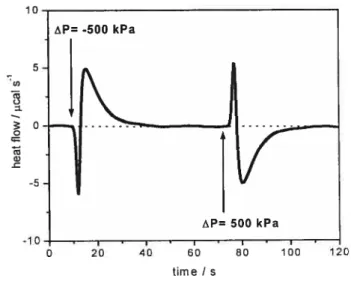
and taking into account blank data for solvent (sample celi) versus water (reference celi), solvent versus solvent, and water versus water. The equations involved inthe PPC data analysis are presented in details in appendix A. The PPC experimental setup and the experimental PPC trace registered for a solution of polymer [21 are shown in figure 5 and figure 6.
Figure 7 : Schematic diagram of the pressure perturbation calorirnetiy (PPC) experimental setup. The open circles in the reference cell represent the volume occupied by solvent in this ceil, which counterbalances the volume occupied by the solute molecules in the sample celi.
Pressure chamber Reference celi 4
AQ
4 Solute — molecule Sample cello
cl)
Figure 8 : Experimental PPC trace registered for a solution poly(N-isopropylacrylamide)
in H20. Polymer concentration: 5g L’, temperature = 20
oc.
3.3.3 Information obtained from PPC measurements
The data obtained from consecutive pressure increase and decrease cycles at
the same temperature are averaged, to construct for the PPC curve. The area under the
curve gives the volume change experienced by a solute in a given temperature range
accompanying the transition. In the case of a phase transition, the PPC experiment
measures the thermal expansion coefficient Umacf, the phase transition temperature T1, and the effect of pressure on this phase transition temperature.
3.3.4 Domains of application
PPC is able to measure extremely small temperature changes (0.05 °C) induced
by weak pressure jumps. It has been used to study protein folding and unfolding [52], time Is
it also offers interesting perspectives in the study of lipids and membranes and allows the characterization of the kinetics of the lipid gel-to-liquid ciystal transition [53]. Kujawa and Wiimik [2] have demonstrated that PPC can be used to measure the thermal expansion coefficient, u., of thermosensitive polymers as function of the temperature. the effect of the pressure on the phase transition temperature and the volume changes, AV, associated with different types ofpolymers phase transitions.
4. The scope of the thesis:
The main objective of this thesis is to study of the solution properties of two new water-soluble thermosensitive polymers using high sensitivity differential scanning calorirnetry, pressure perturbation calorirnetiy. and turbidity measurements. These techniques yield the thermodynamic parameter controlling the heat-induced phase transitions and their influence on the solubility ofthese materials.
Chapter two pertains to the study of the temperature-induced phase separation of aqueous solutions of poly(2-isopropyl-2-oxazolines) obtained by cationic ring opening polymerization. The synthesis and the physicochemical properties of the polymers are reported.
In chapter three, a micocalorimetric study of poly(N-vinylisobutyramide) (PNVIBA) [54, 55, 56] is presented. Effects of polymer concentration, polymer molecular weight, and concentration of added salts are examined. Also, the properties ofPNVIBA aqueous solutions are compared to those ofPNIPAM.
f inalÏy, chapter four is a conclusion, which summarizes rny study in this thesis,
also, sorne examples of future applications of the polymers studied in this work will be shown and discussed.
5. References:
1. Tiktopulo, E. I.; Bychkova, V. E.; Ricka, J.; Ptitsyn, O. B. Macromolecules 1994, 27,
2879-2882.
2. Kujawa, P.; Wiimik, F. M. MacromoÏecuÏes 2001, 34, 4 130-4135.
3. Tong, Z.; Zeng, F.; Zheng, X. Mctcromolecules 1999, 32, 4488-4490.
4. Lin, P.; Clash, C.; Pearce, E.; Kwei, T. K. I FoÏym. Sci. Fart B. Fotym. Phys 1988, 26, 603-619.
5. Schafersoenen, H.; Moerkerke, R.; Berghrnans, H.; Koningsveld, R.; Dusek, K.; Soic,
K. iVlacromoÏecuÏes 1997, 30, 410-416.
6. Salamova, U. U.; Rzaev, Z. M. O.; Altindal, S.; Masirnov. A. A. Polymer 1996, 37,
2415.
7. Schild, H. G.; Tirreli, D. A. I Phys. Chem. 1990, 94, 4352-4356.
8. Saito, S.; Otsuka, T. I Colloid. Inter. Sci. 1967. 25, 531.
9. Zheng, X.; Tong, Z.; Xie, X.; Zeng, F. Folym. I (Tokyo) 1998, 30, 284. 10. Fujishigi. S.; Kubota, K.; Ando. 1.1 Fhys. Chem. 1989, 93, 3311.
11. Wang, X.; Wu, C. Macromotecutes 1999, 32, 4299-4301.
12. Nemethely, G.; Scheraga, H.A. I Chem. Phys. 1964, 41, 680-689. 13. EIiassaf J. I Appt. FoÏym. Sel 1978, 22, 873.
14. Lee L.T.; Cabane 3. MacromoÏecules 1997, 30, 6559. 15. Staikos, G. Macromol. Rapid Commun. 1995, 16, 913.
16. Lee, S. B.; Song, S. C.; Jin, J. I.; Sohn, Y. S. Macromolecules 1999, 32, 7820-7827. 17. Von Hippel, P. H.; Schleich, T. Acc Chem. Res. 1969, 2, 257.
18. Morne, R. A; Almeida, J. P.; Day, A.F.; Yu, N.T. I CoÏÏoid. Inter. Sci. 1967, 25, 531.
19. Harned, H. S.; Owen, B. B. Physical Chernistty of Electrolytic Solutions, Reinhold,
New York, 195$, p.$O.
20. Tiktopoulo, E.I.; Uversky, V.N.; Lushchick,V.B: Kienin, S.I.; Bychkova,V.E. Ptitsyn,
O.B. Macrornotecutes 1995, 28, 7519.
21. Okano, T. Bioretated Polyrners and Gels. New York: Academic Press 1998.
22. Dusek, K. Responsive gels: volume transitions II. Advances in Polyrner Science, vol.
110. Berlin: Springer; 1993.
23. Hoffman, A.$. Macrornol Symp 1995, 98, 645-664.
24. Okano, T.; Bae, Y.H.; Jacobs, H.; Kim, S. W. I ControlÏed Release 1990, 11,
255-265.
25. Valuev, L.; Zefirova, O. N.; Obydennova, I. V.; Plate, N. A. J Bioact Compat Polym
1994, 9, 55-65.
26. Dong, L.; Hoffrnan. H. I ControlÏed Release 1990, 13, 21-3 1.
27. Yasui, M.; Shiroya, T.; Fudjimoto, K.; Kawaguchi, H. CoÏÏoid Surf B-Biointerfaces
1999,8,311-319.
2$. Feu, H.; Bae, Y. H.; Feijen, J.; Kim S. W. I Mernbr. Sci. 1991, 64, 283-294.
29. Kronenthai, R. L.; Oser, Z.; Martin, E. Polymer Science and TechnoÏogy. Folyiner in
Medicine andsurgery, Plenum Press: New York and London, 1975; Vol.$.
30. Heskins, M.; Guillet, J. E. Macromol. Sci. Chem. A2 1963, 1441.
31. Zalipsky, S. ; Hansen, C. B. ; Oaks, J. M.. Allen. T. M. I Pharrn. $ci 1996. 85. 133.
32. Kwon, I. C.; Bae,Y.H.; Kim, S. W. Nature 1991, 354, 291.
33. Wang, C. H.; Hsiue, G. H. I Polym.. Sci. PctrtA: Polym. Chem. 2002, 40, 1112.
35. Kobayashi, S. Frog. Folym. Sci. 1987, 15, 751-823.
36. Kobayashi, S.; Kahu, M.; Sawada, S.; Saegusa, T. Foly. Buil. 1985, 13, 447-45 1. 37. Uyama, H.; Kobayashi, S. ChemistiyLett. 1992, 1643-1646.
38. Woodle, M. C.; Engbers, C. M.; Zahpsky, S. Bioconjugate Chem. 1994, 5, 493-496. 39. Park, T.G.; Hoffman, A. S. Macromolecules 1993, 26, 5045.
40. Home, R. A.; Almedia, J. P.; Day, A. F.; Yu, N.-T. I Colloid. Inter. Sci. 1971, 35, 77.
41. Kazuo, S.; Keitaro, M.; Akio, K.; MitSum, A. I Folym. Sci: Fart A. Folymer Chemistry 1997, 35, 3087-3094.
42. Kazuya, Y.; Takeshi, S.; Yoichiro, M.; Mitsum, A. Macromolecules 2001, 34, 8014-8020.
43. Kazuya, Y.; Takeshi, S.; Yoichiro, M.; Mitsum, A. I Folym. Sci. Fart A. Folymer Chemistiy 2000, 38, 3674-3681.
44. Shalaby, W. S. Folyrners of Biological and Biornedical Signficance; American Chemical Society: Washington, DC, 1994.
45. Ladbury, J. E.; Chowdhry, B. Z. Wiley 1998, Biocaïorimetry: Applications of calorimetry in the biological Sciences.
46. Cooper, A.; Johnson, C. M.; Lakey, J. H.; Nilmann, M.; Biophysical Chernistiy 2001, 93, 215-230.
47. Heerklotz, H. Biophys. 1 2002, 93, 2693-2701.
4$. Privalov, G.; Kavina, V.; Freire, E.; Privalov, P.L. Anal. Biocheni 1995, 232, 79. 49. Plotnikov, V. V.; Brandts, J. M.; Lin, L.- N.; Brandts J. F. Anal. Biochem. 1997, 250,
50. Heerklotz, H.; Seelig, J. Biophys. J 2002, 82, 1445-1452.
51. Ravindra, R.; Winter, R. Departrnent of chernistry, Physical chemistry I, University of Dortmund, Otto-Hahn, Germany: On the Pressure- Temperature Free Energy Landscape of proteins.
52. Lin, L.-N.; Brandts, J. f.; Brandts, J. M.; Plotnikov, V. Anal. Biochem. 2002, 302, 144-160.
53. Heimburg, T.; Grabitz, P.; Ivanova, V.; Biophys. 1 2001, 80, 502.
54. Akashi, M.; Nakano, S.; Kishida, A. I FoÏym. Se., Fart A: Folym. Chem. Ed 1996, 34, 301.
55. Suwa, K.; Wada, Y.; Kikunaga, Y. ; Morishita, K.; Kishida, A.; Akashi, M. I Folym. Se., Fart A: PoÏym. Chem. Ed. 1997, 35, 1763.
CHAPTER 2
Presentation ofthe article
liicrocalorimetric Study of the Temperature-Induced Phase
Separation
in
Aqueous
Solutions
of
Poly(2-isopropyl-2-oxazolin es)
Charbel Diab,’ Yoshitsugu Akiyama,2 Kazunori Kataoka,2 and Françoise M. Winnikl* ‘Faculty of Pharrnacy and Department of Chemistry, Université de Montréal, CP 612$
Succursale Centre Ville, Montréal, QC Canada H3C 3J7
2
Department ofMaterials Science, Graduate School of Engineering, The University of Tokyo, 7-3-1 Hongo, Tokyo 113 8656 Japan
Macromolecutes 2004, 37, 2556-2562
Received December 10, 2003; Revised Manuscript Received February 6, 2004 Publïshed on web 03/13/2004
1. Abstract
The effect of temperature on aqueous solutions of poly(2-isopropyl-2-oxazoline) (PIPOZ) samples of molecular weights ranging from 1,900 to 5,700 g moF’ was monitored by turbidimetry, high sensitivity microcalorimetry (HS DSC), and pressure perturbation calorimetiy (PPC) from
io
oc to $0°c.
The polymers were soluble in coldwater and underwent phase separation at 45 - 63°C, depending on their molecular
weight. The phase transition was endothermic, with an enthalpy change ranging from 0.36 ± 0.01 to 1.16 ± 0.01 kcal mol’. The coefficient of thermal expansion of PIPOZ in water (Œ,), deterrnined by PPC, underwent a sharp increase at the temperature
corresponding to the onset of phase transition, reaching a maximum value at T - Tcp.
Microcalorimetric measurements were carried out with solutions of PIPOZ samples in D20 and in aqueous NaC1 solutions. The thermodynamic and volumetric changes associated with the phase transition of aqueous PIPOZ solutions are compared to those of aqueous solutions of two related polymers, poly(vinylcapiolactam) and poly(N isopropylacrylamide) (PNIPAM), a polyrner structurally related to PIPOZ that undergoes a phase transition in water at 31°C.
2. Introduction
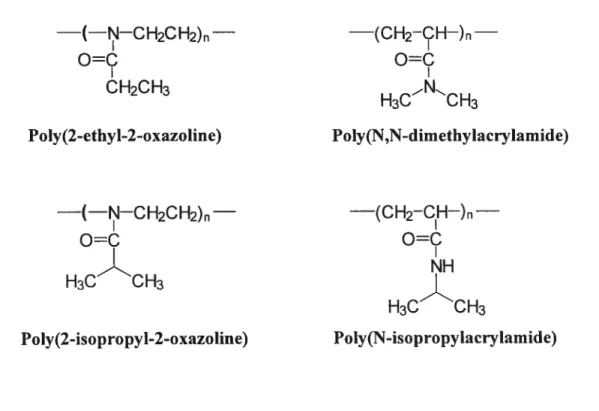
A large body of work has been devoted over the past decades toward the development of drug delivery systems based on polymeric micelles featuring longevity in blood circulation.’6. In most studies, these drug vehicles consist of a hydrophilic poly(ethylene glycol) (PEG) outer corona, since this polymer prevents non-specific adsorption of the polymeric micelle to proteins and cells, thus allowing the micelles to evade recognition by the reticuloendothelial system.3’ ‘, There bas been little investigation into the use of hydrophilic corona forming polymers other than PEG to create micellar drug delivery systems. Charged hydrophilic polyrners have been used for delivery to mucosal surfaces, such as the respiratory, gastrointestinal, and urogenitary tracts.9 Polymeric micelles with a corona made up of natural or serni-synthetic polysaccharides are investigated as well as vehicles in the oral administration of poorly water soluble drugs.’°’ Recently, polymeric micelles based on block copolymers of 2-ethyl-2-oxazoline (PEOZ) and E-caprolactone 12 were evaluated as drug carriers and shown to have low cytotoxicity and hemolytic activity.13
In contrast to PEG or polysaccharide systems, poly(2-alkyl-2-oxazolines), synthesized by living cationic polymerization, can be tailored through the choice of not only the end groups but also the side chains.14-16 The length of the aikyl substituents controls to a large extent the relative hydrophilicity ofthe poly(2-alkyl-2-oxazolines), and only few oxazolines, such as the 2-methyl-, 2-ethyl-, and 2-isopropyl-2-oxazolines, lead to polymers soluble in water at room temperature.’7 The biocompatibility and interfacial characteristics of poly(2-methyl-2-oxazolines) (PMOZ) and PEOZ have been assessed in various biotechnological applications.’82° Lipid vesicles doped with
poly(2-ethyl-2-oxazoline) lipopolymers exhibited enhanced blood circulation times compared to ordinary phospholipid vesicles.21 The ability of the PMOZ and PEOZ chains to elicit beneficial properties when grafied onto the surface of liposomes has been explained by the conformational mobility of the polymers and the tendency of their repeat units to forrn hydrogen bonds with water.21 However, quantitative information on the interactions of poly(2-alkyl-2-oxazolines) with water is scarce cornpared to the wealth of data dealing with the behavior of PEG in water.22
Among the various poly(2-alkyl-2-oxazolines), PEOZ has attracted the most attention, by far. Aqueous solutions of PEOZ exhibit a cloud point around 62-65 oc depending on molecular weight and concentration.23 The cloud point temperature is affected by the presence of cosolvents, such as dioxane, and of salts, decreasing in the presence of sodium chloride, but increasing upon addition of tetrabutylammonium bromide.24 Studies of PMOZ and PEOZ in water by light scattering revealed that their second vinai coefficients decrease with increasing solution temperature, an indication of the involvernent of water/polymer hydrogen bonds in the mechanism of temperature induced phase separafion.25’ 26 The phase transition of aqueous PEOZ solutions was investigated over the entire water/polymer composition domain. Concentrated PEOZ solutions obey the “classical” F lory-Huggins miscibility behavior: the cloud point shifts
to lower polymer concentration as the molecular weight of the polymer increases (M1 22,000 - 170,000 g moF’).25’
27
As pointed out by Lin et aï.,24 the repeat unit of PEOZ is isomeric to that of poly(A’ N-dimethylacrylamide) (Figure 1), and, as such, there are similarities in the solubility and miscibility characteristics of the two polymers; yet, there are also important differences. Although both polyrners are soluble in water. only PEOZ
— —(CH2-H—)— o=
o=c
CH2CH3 H3CCH3 Poly(2-ethyl-2-oxazoline) PoIy(N,N-dimethylacrylamide) —(—FJ—CH2CH2)— —(CH2-CH—)— H3CCH3 H3C CH3 PoIy(2-isopropyl-2-oxazoline) PoIy(N-isopropylacrylamide)Figure 1 : Chemical structure of the repeat units of poly(2-ethyl-2-oxazoline) (PEOZ),
poly(N,N-dimethylacrylarnide), poly(2-isopropyl-2-oxazoline) (PIPOZ), and poly(N
isopropylacrylamide) (PNIPAM).
aqueous solutions exhibit a cloud point below 100 °C, when the polymer molecular
weight exceeds a threshold value of 10,000 g moF1.27 In this respect, one may note that
the repeat unit of poly(2-isopropyl-2-oxazoline) (PIPOZ) is isomeric to that of poly(N
isopropylacrylarnide) (PNIPAM) (Figure Ï), a water-soluble polymer that exhibits a
cloud point in water at 31
oc2s
Indeed, PIPOZ in water presents a cloud point, asrevealed by turbidity studies.29 The cloud point of a solution of PIPOZ (M1 16,700)
ranges from 39 °C to 36 °C, depending on polymer concentration. Addition of NaC1
depresses the solution cloud point, while surfactants such as sodium dodecyl sulfate and
detects similarities in the solution properties of PIPOZ and PNIPAM. Nonetheless, cloud
point values give littie indication on the differences in the state of hydration of the two
polymers.
As part of a project aimed at the development of novel PIPOZ-based thermoresponsive polyrneric micelles, we prepared recently a series of PIPOZ oligomers terminated with a hydroxyl group. b understand the solution properties of the ultimate polyrneric micelles, we set about to study the properties of aqueous solutions of PIPOZ as they undergo phase transition. Two techniques, high-sensitivity differential scanning calorimetry (DSC) and pressure perturbation calorimetry (PPC) were employed. from the DSC measurements, we retrieve the temperature and the enthalpy of the phase transition of solutions of oligomers of various molecular weights and polydispersities. From the PPC results, we derive the volurnetric properties of PIPOZ solutions as they undergo a phase transition. Pressure perturbation calorimetry measures the heat absorbed or released by a solution due to a sudden pressure change at constant temperature.3° The heat can be used to calculate the coefficient of thermal expansion of the solute and its temperature dependence. The technique has been exploited to obtain the changes in the volume of the solvation layer around proteins before and afier unfolding,31 to monitor the volume changes accompanying the pretransition and transition of phospholipid bilayers,32 and to evaluate the volume changes ofthe solvation layer during the coil/globule collapse in water of PNIPAM hydrophobically-modified PNIPAM samples,33’34 and
0Iy(vinylcaprolactam).
Solutions of PIPOZ in T{2O, D20, and aqueous NaCl solutions were examined by the two calorimetry techniques, in order to assess the relative importance of
water/polymer hydrogen bond formation and polymer/polyrner hydrophobic interactions.
Light and heavy water are chemically identical, yet their physical properties differ
significantly.36 The dissimilarities between H20 and D20 are believed to stem from
differences in the intermolecular hydrogen bonds energies. The lengths of hydrogen
bonds in the two liquids are about the same, but a “hydrogen” bond in D20 is about 5 ¾
stronger than a hydrogen bond in H20. Overail, D20 is a more “structured” solvent than
light water.37
In a flrst section, we present the preparation of the oligorners and describe their
chemical characteristics obtained from 1H NMR spectroscopy, MALDI-TOF mass
spectrometry, and gel permeation chromatography (GPC). Then, we report the results of
the microcalorimetry study of PIPOZ samples, placing particular emphasis on the effect
of the polymer chain length on its behavior during the solution phase transition. Taken
together, the results suggest a description of the PIPOZ/water interactions, which will be
compared to the currently accepted view of the phenornena taking place in aqueous
solutions ofPNIPAM, the chernical isomer ofPIPOZ.
3. Experimental Section:
3.1 Materials:
Water was deionized with a Millipore Milli-Q water purification system. Isobutyric
acid, 2-aminoethanol, and methyl p-tosylate were purchased from Wako Pure Chemical
Industries. Deuterium oxide (99.8 %) was purchased from Aldrich-Sigma Chemicals.
3.2 Instrumentation:
NMR spectra were recorded on a Bruker ARX-400 400 MHz spectrometer. UV/Visible spectra were measured with a Hewlett Packard 8452A photodiode array spectrometer equipped with a Hewlett Packard 89090 temperature controller. Gel permeation chromatography (GPC) measurements were performed with a TO$OH HLC 8220 system equipped with a TOSOH differential refractometer, two TOSOH Super HHZ columns (4000 and 3000) eluted with DMF containing triethylamine (3OrnM) and LiC1 (10 mM) (flow rate 0.8 mL min1, 40 °C) and caiibrated with poly(ethyleneglycol) standards used to determine the molecular weights. MALDI-TOF mass spectra were recorded with a Reflex ifi (Bniker). Ah spectra were obtained in positive ion mode and ionization was performed with a 337 puised (3ns pulse width, 106 to i0 W cm2) nitrogen laser. An extemal cahibration was performed using poly(ethylene glycol) (MeO-PEG OH) ofMw 5,000 (NOF Corporation). To prepare the matrix, a solution ofthe polier in THF (20 j.iL, 6 mg mL’) was mixed with a solution of 8,9-trihydroxyanthracene in THF (20 j.iL, 10 mg mL1) by sonication for a few minutes. A solution of lithium trifluoroacetate in THF (2 pi, 2 mg mL’) was added to the matrix. The resulting mixture was shaken briefly and applied to the probe (2 pL)
4 Synthesis and measurements:
4.1 Preparation of 2-Isopropyl-2-oxazoline.39
Isobutyric acid (132g, 1.5 mol) was added to 2-aminoethanol (92 g, 1.5 mol) under stirring. The resulting sait was heated slowly to 230 °C, a temperature higher than its melting point. The liquid was refluxed for 48 h, followed by azeotropic distillation at 110
°C. The distillate was diluted in dichloromethane (350 mL) to separate water from 2-isopropyl-2-oxazoline. The aqueous layer was extracted repeatedly with dichioromethane. The combined organic layers were concentrated in vacuo. The residue was purified by repeated distillations in the presence of CaR2, yielding dry 2-isopropyl-2-oxazoline (72 g, b.p. 138 °C). ‘H NMR (CDC13,
)
1.11 (d, 6 H, (CH3)2CH-), 2.49 (m, 1 H, (CH3)2CH-), 3.79 (t, 2 H, NCH2CH2O), 4.1$ ppm (t, 2H, NCH2CH2O).4.2 Polymerizations:
Hydroxy-Terminated Poty(2-isopropyl-2-oxazotines)
A solution of 2-isopropyl-2-oxazoline (9.74 g, 86 mmol) and methyl p-tosyïate (0.30 g, 1,0 mmol) in nitromethane (30 mL) was stirred at 40 °C under argon. Aliquots of the polymerization solution (1.0 mL) were taken at various time intervals (48 , 72, 120,
and 168 hr). They were cooled to room temperature and poured into a mixture ofaqueous NaOH (1.5 mL, 1.0 M) and methanol (1.5 mL). The resulting solution was dialyzed against water for 2 days. The polymer was isolated by freeze-drying. ‘H NMR (CDC13,
)
1.1 (br , [(CH3)2CH-], 2.66 and 2.89 (br m, [(CH3)2CH-], 3.0$ (s, terminal CH3), 3.54(br s, -(cH2-cH2-N)-).
4.3- Cloud point determïnations:
Cloud points were determined by spectrophotometric detection of the changes in turbidity (X 600 nm) of aqueous polymer solutions (1.0 g L’) heated at a constant rate (1 °C min’) in a magnetically stirred 13V cdl. The value reported is the temperature corresponding to a decrease of 20 % ofthe solution transmittance.
4.4 Differential scanning calorïmetry (DSC):
DSC measurements were performed on a VP-DSC microcalorimeter (MicroCal lic.) at an external pressure of ca. 180 kPa. The ccli volume was 0.52 mL. The heating rate was 1.0 oc min1, and the instrument response time was set at 5.6 s. Data were corrected for instrument response time and analyzed using the software supplied by the manufacturer. The polymer concentration ranged from 0.5 to 2.0 g L’.
4.5 Pressure perturbation calorimetry (PPC):
PPc measurements were pcrformed on a VP-DSC microcalorimeter equipped with a pressure perturbation accessory (MicroCal Inc.). The pressure applied during the compression cycle was 500 kPa. The reference ceil and sample celi volumes were identical (0.52 mL). The polymer concentration was 5 .0 g L. Control experiments were performed, namely water (sample celi)vswater (reference celi), H20 vs D20, D20vs D20, NaC1 in watervs NaC1 in water, and watervsNaC1 in water. The PPC accessory has been described in detail elsewhere.3° Briefly, it applies a pressure of 500 kPa, then a pressure release to ambient pressure, to the sample, which is kept at constant temperature. The temperature of the sample ccli is kept constant by compensation of the heat change caused by the pressure jump. Afier equilibration, an upward pressure jump (500 kPa) is performed. The heat peaks caused by the compression and decompression areopposite in sign but agree in absolute value. A large number of compressionldecompression cycles are performed at each temperature.
The coefficient of thermal expansion of a polymer solute in a solvent is obtained from Equation i33,
apot = asotv
—
rev
(1) TAPm01 V01
where a01and asolv are the thermal expansion coefficients ofthe polymer and the solvent,
respectively, AQrevcorresponds to the heat consumed or released upon the small pressure
changes, AP is the change in pressure, T is the temperature,
V01
is the partial specific volume of the polymer, and is the mass of polymer in solution. The partial specific volumes of the polymers were determined by an increment method based on the group contribution theory developed to estimateV
of aqueous systems and estimated to be accurate within 2 %40 Thus, forPIPOZ,V
= 0.888 cm3 g1 and for PNWAIvI,V
= 0.894cm3 g’.
The change in volume of the solvation layer of the polymer (AV) during a phase transition is obtained by integration of the curve of the changes in the coefficient of thermal expansion with temperature (eq 2), assuming that A V is small compared to
V,
the intrinsic volume of the polymer. A complete deviation of the equations has been reported previously.30’33 Data were analyzed using the software supplied by the manufacturer.
5. Resuits:
5.1 Preparation and Cliaracterization of the Polymers:
The oligomers were synthesized by living cationic polymerization, initiated with methyl p-tosylate, of 2-isopropyl-2-oxazoline, followed by termination with a NaOH/methanol solution yielding hydroxyl-tenninated chains (figure 2).
H3CÇ H3C-(NCH2CH2
I
O= H3C OH3 + CH3CN H3CCH3 H3 CH3O—CH3 NaOH/MeOH H3C—(N—CH2CH2YW-O H H3CCH3Figure 2 : Reaction scheme for the preparation of poly(2-isopropyl-2-oxazolines) and structure of the polymer.
Polymerization conditions were selected to achieve the narrow molecular weight polydispersity and low polymer molecular weight required by the ultimate application of the PIPOZ chains in drug delivery vehicles. One set of samples (PIPOZ-OH, n =
at various tirne intervals. This method provided oligo(2-isopropyl-2-oxazolines) of
narrow polydispersity index, as determined by GPC (Table 1) and MALDI-TOF mass
spectrometiy (figure 3).
Polymer tM0]/[IO]a Time Mb M/Mb Mc DPC
(h) (gmof1) (gmoF’) PIPOZ17-OH 86 48 1,700 1.05 1,900 17 PIPOZ21-OH $6 72 2,400 1.04 2,400 21 PIPOZ41-OH $6 120 4,300 1.03 4,600 41 PIPOZ50-OH $6 16$ 5,700 1.03 5.650 50 PNIPAM ---- 13,000 1.16
a initial monomer/initiator feed ratio
b
from GPC measurements from 1H NMR spectra in CDC13
Table 1 Polymerization conditions and characteristics of the
poly(2-isopropyl-2-oxazolines).
The mass spectrum of PIPOZ-OH (M 6,190) presented in figure 3 is also
dorninated by one main ion population. The spacings ofthe Am/z signais, 113.192, are in
good agreement with the expected mass of one monomer unit. The major population of
signais was attributed to the Li adduct and the minor population of signais to the Na
39
desired end-functionalities, namely a methyl group at one chain end and either a hydroxyl
or a prirnary amine group at the other chain end.
6’6 7 63765 6149 YI’ -+ Na l)
II
II
I I I lI 6100 6200 6300 6100 m/z II
LLL-4000
5000
6000
7000
8000
9000
10000
11000 12000
rn/z
Figure 3 : MALDI-TOF mass spectrum of PIPOZ50-OH obtained afier 16$ h
polymerization. An expanded view of the spectrum ranging from 6100 to 6400 amu is
given in the inset.
The degree of polyrnerization of the oligorners was calculated from the ‘H NMR
spectra of the samples in chloroforrn-D, using the broad singlet at 1 .11 pprn, ascribed to
the resonance of the methyl protons of the isopropyl group of the repeat unit, together
with the singÏet at 3.0$ ppm, attributed to the resonance of the terminal methyl protons
NMR signais are in excellent agreement with the molecular weights determined by GPC
(Table 1) and MALDI-TOF mass spectra (Figure 3).
H
t) \
312O2.82
(pprn)
Figure 4: 1H NMR spectrum of PIPOZ21-OH in CDC13.
5.2 Phase transition of the oligomers in water
5.2.1 Turbidity measurements:
The fastest method to determine the cloud point of a polymer solution consists of
measuring the changes in turbidity as the solution is heated at a constant rate.
H3C—(——CH 20H 2)-1j—OH
H—C—CH3
2.4 2.2 2.0 1.8
•----.-—-•--- .
Solvent Tcp (0Cv’ Tonset (0C) Tmax (0C)b AH (kcal rno1’)’ Tmax (OC)c AVIV (%)C (DSC) (DSC) (DSC) (PPC) H20 72.5 ± 0.2 73.1 ± 0.2 76.5 ± 0.3 0.36 ± 0.01 65.0 ± 0.3 0.43 D20 68.9 ± 0.2 75.2 ± 0.3 0.39 ± 0.01 63.0 ± 0.3 0.70 H20 62.8 ± 0.2 61.4 ± 0.2 64.0 ± 0.3 0.72 ± 0.01 52.5 ± 0.3 0.64 D20 60.3 ± 0.2 58.9 ± 0.2 62.1 ± 0.3 0.85 ± 0.01 53.0 ± 0.3 1.00 H20 51.3±0.2 51.3±0.2 54.0±0.3 0.90±0.01 45.2±0.3 0.84 D20 45.2 ± 0.2 51.3 ± 0.3 1.16 ± 0.01 47.5 ± 0.3 1.30 H20 48.1 ± 0.2 46.5 ± 0.2 48.0 ± 0.3 1.35 ± 0.01 45.0 ± 0.3 1.10 D20 46.9±0.2 47.0±0.3 1.43±0.01 43.0±0.3 1.80 NaC1 (0.5 M) 37.1 ± 0.2 40.6 ± 0.3 1.61 ± 0.01 37.0 ± 0.3 1.30 NaC1 (1.0 M) 33.5 ± 0.2 35.0 ± 0.3 1.76 ± 0.01 32.0 ± 0.3 1.40 H20 24.5 ± 0.2 32.6 ± 0.3 0.80 ± 0.01 32.0 ± 0.3 0.90 D20 NaCÏ (0.5 M) 18.4± 0.2 25.6 ± 0.3 1.20 ± 0.01 26.0 ± 0.3 1.00 NaC1 (1.0 M) 13.6 ± 0.2 20.1 ± 0.3 1.37 ± 0.01 21.0 ± 0.3 1.20 H20 32.7u 317d turbidity measurements (polymer concentration: 1 .0 g L1) DSC measurements (polyrner concentration: 1.0 g L1) PPC measurements (polyrner concentration: 5.0 g L1) 2 Thermodynamic parameters ofthe poly(2-isopropyl-oxazolines).
C
C
41C
The temperature of turbidity onset, defined here as the cloud point temperature, Top, decreases with increasing PIPOZ molecular weight (Table 2). The turbidity increased sharply as the temperature exceeded this onset value. To ascertain the reversibiiity of the phase transition, polymer solutions heated to 70 oc were kept at this temperature for 30 min and then cooÏed to room temperature at constant cooling rate. The solutions became ciear in ail cases, but the temperature for which $0 % transmission was recovered was lower by 2 °c, than Tp recorded during a heating scan. The cloud point temperature of a solution of PIPOZ21-OH (1.0 g L1) was determined in light and heavy water: it was lower by 1.5 oc in D20 compared to H20 (Table 2). Note that this trend is in agreement with an observation made by Chen et al. in their study of a polydisperse sample of PEOZ (M1 116,000). They reported that use of D20 in place of F120 yielded a cloud point some 3 °c lower.25
5.2.2 High sensitivity differeutial calorimetry:
The changes with temperature of the partial excess heat capacity C of aqueous solutions of several P1POZ-OH sampies (1 g L’) are presented in Figure 5. The thenuograms are endothermic, broad, and markedly asymmetric, with a sharp increase in heat capacity on the low-temperature side (onset of the transition, Tojiset) and a graduai decrease of the heat capacity for temperatures higher than a maximum temperature Tmax. For ail polymers the values qf C were the same, within experimental error, before and afler the transition. Neither changing the concentration of the solution, from 0.5 to 5 g L’ nor varying the scanning rate, from 10 to 90 °C/h, affected the shape ofthe thermograms.