Science Arts & Métiers (SAM)
is an open access repository that collects the work of Arts et Métiers Institute of Technology researchers and makes it freely available over the web where possible.
This is an author-deposited version published in: https://sam.ensam.eu Handle ID: .http://hdl.handle.net/10985/6795
To cite this version :
Etienne PESSARD, Franck MOREL, Daniel BELLETT, Anne MOREL - A new approach to model the fatigue anisotropy due to non-metallic inclusions in forged steels - INTERNATIONAL
A new approach to model the fatigue anisotropy due to non-metallic
inclusions in forged steels
Etienne Pessard, Franck Morel, Daniel Bellett and Anne Morel
Arts et Métiers ParisTech, Angers, France
Abstract:
The objective of this work is to propose an anisotropic fatigue criterion for the sizing of industrial forged components. The results from different experimental campaigns using three different rolled steels are first presented. The effect of inclusions and the microstructure on the fatigue behaviour are investigated. For the two ferrite-pearlitic steels tested, the presence of a microstructure consisting of elongated grains has no observable effects on the fatigue behaviour. For two of the three steels studied the presence of non-metallic inclusions, elongated in the rolling direction, form the origin of the anisotropic fatigue behaviour.
The proposed probabilistic model is based on the competition between two possible fatigue crack initiation mechanisms. The anisotropic character of the fatigue resistance of forged components is taken into account by the definition of the geometry and the orientation of the non-metallic inclusion. This criterion results in the establishment of a probabilistic Kitagawa type diagram.
Keywords: anisotropic, forging, manganese sulphide inclusions, high cycle fatigue, linear elastic fracture mechanics, elastic shakedown
NOMENCLATURE
) (t
H
: hydrostatic stress as a function of time )
(t
: shear stress as a function of time
a H ,
: hydrostatic stress amplitude
a
T : shear stress amplitude
, : material parameter for the Dang Van criterion
1
T : fatigue strength at 2x10⁶ cycles in purely reversed torsion
1
S : push-pull fatigue strength at 2x10⁶ cycles
K
: stress intensity factor range
th
K
: crack propagation threshold range
: stress range
D
: fatigue strength range
a: average crack size
: geometric correction factor
b C, : Basquin parameters D: Damage N : number of cycles a : stress amplitude
m: exponent of the Weibull law
0
: scale factor of the Weibull law
k : material parameter that takes into account the hydrostatic stress effect F
P : failure probability
a
, 11
: normal stress amplitude
a
, 12
1 INTRODUCTION
Rolled or forged materials are recognised as having good mechanical and fatigue resistance. These characteristics are linked to the fact that the material is more compact and has a microstructure which is finer due to the forming operation. The term Fibering is commonly used to define a preferential orientation of the microstructure or the defects present in the material due to the forming operation.
The fibering is responsible for the anisotropic fatigue behaviour. The variation in the fatigue resistance can be up to 35% for a 42CrMo4 steel [1] and 15% for stainless steel [2]. Certain forging simulation software is now capable of predicting the fibering orientation.
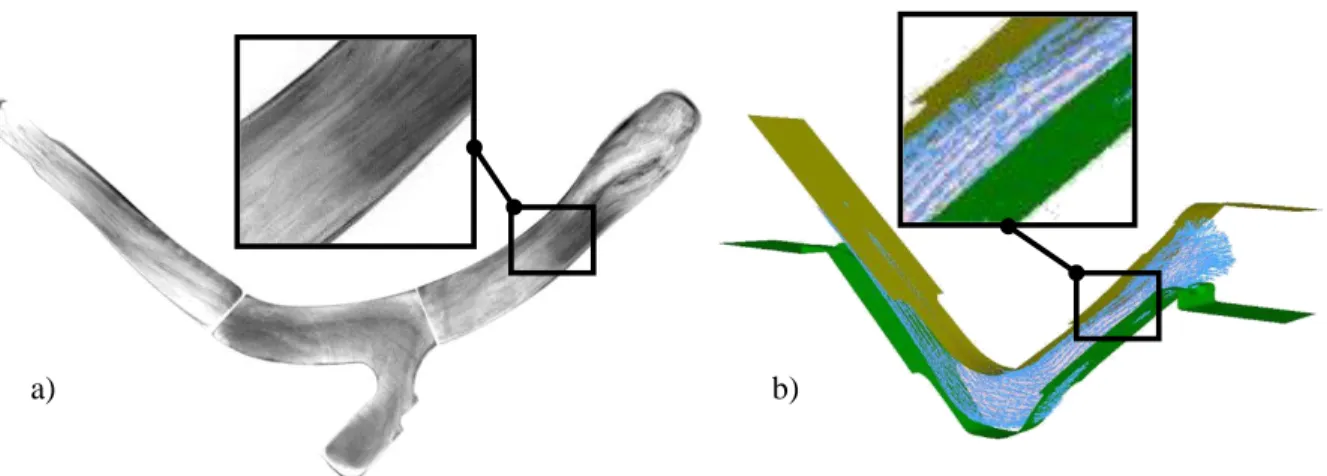
Fig. 1 b) presents the forging simulation results of a suspension arm with the commercial finite element package, Forge2007. It can be seen that the fibering orientation (Fig 1 a)) [3] of the final part can be predicted.
The objective of this work is to propose a fatigue criterion which takes into account the anisotropy of the material by consideration of the fibering created by the forming operation. The work presented in this paper is the continuation of that presented in reference [4].
However, the focus of the present article is on the application of the criterion for a large range of steels and different loading conditions.
b) a)
In terms of high cycle fatigue, it is often observed that fatigue crack initiation may occur in one of two ways:
crack initiation within the material matrix, or
crack initiation occurring at material “defects”
The term defect is used here to include all sources of stress concentration which are intrinsic to the material (i.e. surface roughness, non-metallic inclusions, porosity, etc). As a function of the forming process and the material considered, the type of defects that can be created, differ in nature. For cast alloys, micro shrinkage voids and porosity due to degassing control the fatigue behaviour [5-7]. For rolled or forged alloys, porosity is not an issue, however non-metallic inclusion are the type of defect which is the most detrimental [8-10]. The term “matrix”, which is more commonly used when referring to composite materials, is used here as a general term to describe the material that surrounds the defects.
The fact that the microstructure affects the fatigue behaviour is well known. The effect of the grain size and orientation [11-12] and the effect of the crystallographic texture [13] have been the object of numerous studies. Stainless steels [2], rolled aluminium and titanium alloys [11] have been the closely studied in order to establish the links between the microstructural orientation and the anisotropic fatigue resistance.
Associated with the two fatigue crack initiation mechanisms (matrix and defect) two broad categories or approaches to the fatigue problem have been developed.
To predict the appearance of fatigue cracks within the matrix, criteria based on local plasticity have been developed [14-16]. For example, for polycrystalline materials, the Dang Van [14] criterion uses a multi-scale approach in conjunction with the concept of elastic shakedown to model the effect of the local plasticity on the fatigue resistance. Elastic shakedown is
t H t
max (1)
Where
t is the mesoscopic shear stress in the elastic shakedown state and H
t is the hydrostatic stress.The criterion requires the identification of two material constants α and
3 2 1 1 1 S S T et
T1 (2)Where T1is the fatigue strength in purely reversed torsion and S1is the push-pull fatigue strength .
To take into account the presence of defects on the fatigue resistance, many authors use Linear Elastic Fracture Mechanics, LEFM [17-22]. The defects are therefore considered to be cracks and the crack propagation threshold Kth is used as a rupture criterion. If the applied stress does not generate at the crack tip a stress intensity factor range which is superior to the crack propagation threshold, the crack does not grow and the material will never rupture. The fatigue strength can be expressed by the following relation:
a Kth D (3)
where is a correction factor used to take into account different cracked geometries and loading conditions. For elliptical cracks, is referred to as the complete elliptical integral of the second kind and it depends on the crack aspect ratio.
However, care must be taken when applying this method because for cracks smaller than a certain size, LEFM is not applicable. This is because the hypothesis of confined plasticity is not verified and the hypothesis that the material is continuous breaks down when the crack
shown that short cracks propagate faster than long cracks for the same stress intensity factor range K which can be inferior to the long crack propagation threshold Kth [20]. The use of data determined from long cracks can result in an over estimation of the fatigue life.
Kitagawa and Takahashi [21] have shown that there exists an intrinsic defect size, a , below 0
which the predictions from LEFM become non-conservative. For cracks smaller than a , the 0
fatigue strength of the cracked body is controlled by the plain specimen fatigue strength of the material. The Kitagawa diagram is presented in the log
a versus log
space (see Fig. 2). The domain is defined by two straight line segments. The first has the equation Dand is obtained by the plain specimen fatigue strength of the material without defects. The second line is determined via Linear Elastic Fracture Mechanics (Eq. (3)).Since the appearance of this approach numerous evolutions have been proposed and models based on LEFM have been extended to include the small crack problem [18, 21]. These evolutions have for example taken into account the elasto-plastic behaviour of the material, the possibility of crack closure [18] and the first non-singular term of the asymptotic development of the elastic stress field close to the crack tip: the T-stress [18]. These
approaches lead to, among other things, the reconstruction of Kitagawa type diagrams, but do not explicitly introduce the change in crack initiation mechanism experimentally observed.
α
LEFM prediction using The long crack propagation threshold
Threshold stress for local plasticity, elastic shakedown at the mesoscopic scale
Defect size F at igu e L im it Unified criterion ao
Fig. 2: Schematic Kitagawa-Takahashi’s diagram [18, 21]
The initial aim of this work is to experimentally determine the different crack initiation mechanisms that pilot the fatigue behaviour of three rolled steels commonly used in industry. Particular attention is given to determining the underlying mechanisms and the origin of the anisotropic fatigue behaviour.
The second objective is to propose a unified approach with allows for the possibility of two coexisting fatigue crack initiation mechanisms (i.e. initiation in the matrix and at defects) in order to model the anisotropic fatigue behaviour of steels.
2 DETERMINING THE ANISOTROPIC FATIGUE BEHAVIOUR OF ROLLED STEELS
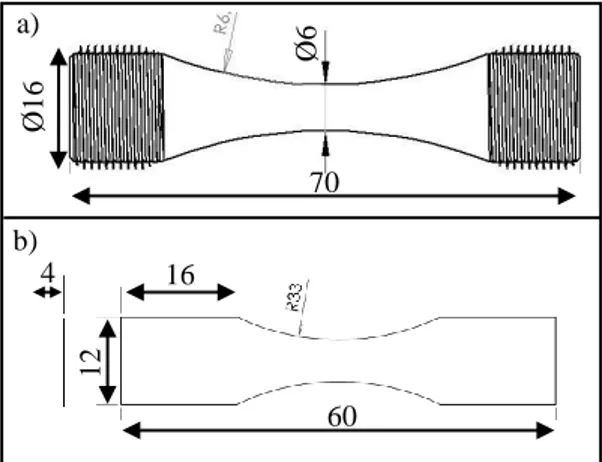
In order to propose a fatigue criterion adapted to a large range of steels, three different steels have been chosen for investigation. For each material, specimens have been extracted in three different directions (i.e. 0°, 45° and 90°) relative to the direction of rolling (see Fig. 3), and the push-pull fatigue strength at N=2x10⁶ cycles has been determined.
Fig. 3: Extraction of the specimens
The first steel investigated is a bainitic steel, commercially referred to as Metasco MC (Table 1-2). The anisotropic fatigue behaviour of this material is studied in detail. The experimental work, detailed below, highlights the role of the non-metallic inclusions on the anisotropic fatigue behaviour of rolled steels in which the microstructure is composed of equiaxed grains.
Θ=90° Θ=45° °
Θ=0°
The objective in the second part of this experimental section is to determine if the presence of a banded microstructure characterized by elongated grains in the rolling direction, results in anisotropic fatigue behaviour. In order to answer this question, two rolled steels are tested, both of which have similar two phase microstructures (i.e. ferrite and pearlite) however, they have different mechanical strength. The first of these two steels is referred to as Splitasco and the second is a C35 steel (see Table 1-2).
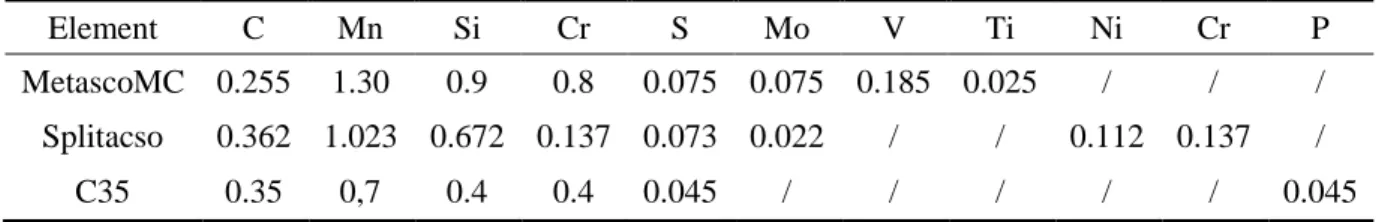
Element C Mn Si Cr S Mo V Ti Ni Cr P MetascoMC 0.255 1.30 0.9 0.8 0.075 0.075 0.185 0.025 / / / Splitacso 0.362 1.023 0.672 0.137 0.073 0.022 / / 0.112 0.137 /
C35 0.35 0,7 0.4 0.4 0.045 / / / / / 0.045
Table 1: Chemical composition of the 3 steels investigated (% mass)
Material Microstructure Ultimate Tensile Strength (MPa) Yield Strength (MPa) Metasco MC Bainitic equiaxed grains 1150 750 Splitasco ferrite-pearlite elongated grains 1050 750 C35 ferrite-pearlite elongated grains 580 350
Table 2: Mechanical properties of the 3 steels investigated
2.1 The anisotropic fatigue behaviour of the Metasco MC steel
The first material studied is a bainitic steel referred to as the Metasco MC. This material has been rolled with a reduction ratio of approximately 15 and contains manganese sulphide inclusions that have been elongated in the rolling direction (Fig. 4). These inclusions are typically grouped into bands or clusters. The average size of these inclusion bands has been determined via micrographic observation and via the observation of the failure surfaces for the 90° fibering orientation (Fig. 5). The average width or diameter of the bands is
approximately 30 m and the length can be up to several hundred micrometers (Table 3). Optical observations as well as an x-ray diffraction analysis of the texture (or crystallographic orientations) of the material have shown that the microstructure of the material is isotropic
(Fig. 4). Hence, if the Metasco MC steel possesses anisotropic fatigue behaviour it can only be due to the presence of the elongated inclusions or inclusion bands.
rolling direction
rolling direction
20µm
50µm
a)
b)
Fig. 4: Bainitic microstructure of the Metasco MC. The zones outlined in red are former
grains of austenite
30µm
a)
b)
a
a
20µm
a
rolling
direction
rolling
direction
.
Fig. 5: Inclusion band in the Metasco MC measured a) on a polished surface b) on a failure
surface for a fibering orientated of 90°
Method Average (µm) Standard deviation (µm) Measurements on a polished surface for
an orientation of 90° 32 15
Measurements on rupture surfaces 32 22
Table 3: Size of the MnS inclusion bands in the Metasco MC (based on 300 measurements
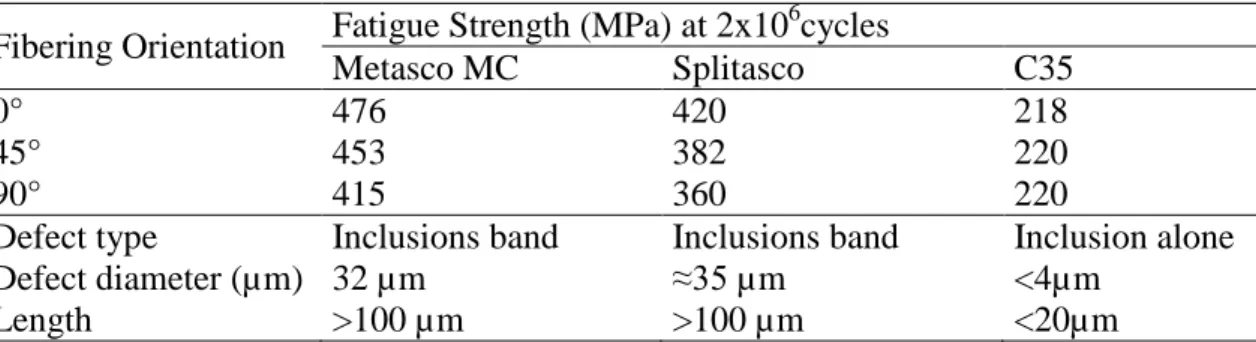
The push-pull fatigue strength at 2x10⁶ cycles has been determined for each orientation using the staircase method with 15 specimens (Table 5 and Fig.6 a)).
Fig. 6:Geometry of push-pull fatigue specimens used: a) for tests on the Metasco MC and on the C35 steels, b) for tests on the Splitasco steel, all manually polished using 1µm diamond paste
The evolution of the fatigue strength at 2x10⁶ cycles as a function of the fibering orientation is shown in Fig. 13. It can be seen that the fatigue strength decreases between 0° and 90°.
Surface crack propagation observations have shown that for a fibering orientation of 0° all cracks initiate within the material matrix and are orientated at an angle of 45° to the applied loading direction.
For a fibering orientation of 90°, two different types of crack initiation are observed. Some cracks initiate within the matrix, while others initiate at inclusion bands and are orientated at 90° to the applied loading direction (Fig. 7 a), b)). These conclusions, established from surface observations have been validated by observation of the failure surfaces, which for the 90° orientation also show crack initiation from inclusion bands (Fig. 5 b)). Greater details of these analyses are available in reference [4].
a) 12 70 Ø1 6 Ø6 60 16 4 b)
2 200µµmm σ σ σσ 2 200µµmm σ σ σσ a) b)
Fig. 7: Surface observations for the 90° orientation: a) Crack initiating in the material matrix
at 45° to the loading direction b) Crack initiating from an inclusion cluster, oriented at 90° to the loading direction
2.2 The anisotropic fatigue behaviour of the Splitasco steel
The second material investigated is a ferrite-pearlitic steel referred to as Splitasco. This rolled material has been developed for use in “split connection rods”. It possesses mechanical characteristics which are slightly inferior to the Metasco MC (see Table 2) but it also has a microstructure characterised by bands of ferrite and pearlite (Fig. 8). This steel also contains MnS inclusions which are elongated in the rolling direction that are arranged in bands, similar to the Metasco MC.
rolling direction
rolling direction
20µm
400µm
Fig. 8: a) The ferrite-pearlitic microstructure of the Splitasco b) MnS inclusion bands
elongated parallel to the rolling direction
With the objective of characterising the anisotropic fatigue behaviour of the Splitasco steel, specimens have been extracted at 0°, 45° and 90° to the rolling direction from a 70mm diameter bar (Fig. 6 b)). The staircase method was used to determine the push-pull fatigue strength at 2x10⁶ cycles for each direction. It can be seen from Table 5 and Fig. 13 that the fatigue behaviour of the Splitasco is anisotropic and that there is a continuous drop in the fatigue strength at 2x10⁶ cycles as a function of the fibering angle.
For a fibering orientation of 0°, the failure surfaces do not show the presence of inclusions in the initiation zone (Fig. 9). This indicates that crack initiation occurs in the material matrix, for this fibering orientation.
laminage
20µm 200µm
a) b)
Fig. 9: Failure surfaces of the Splitasco for a fibering orientation of 0°
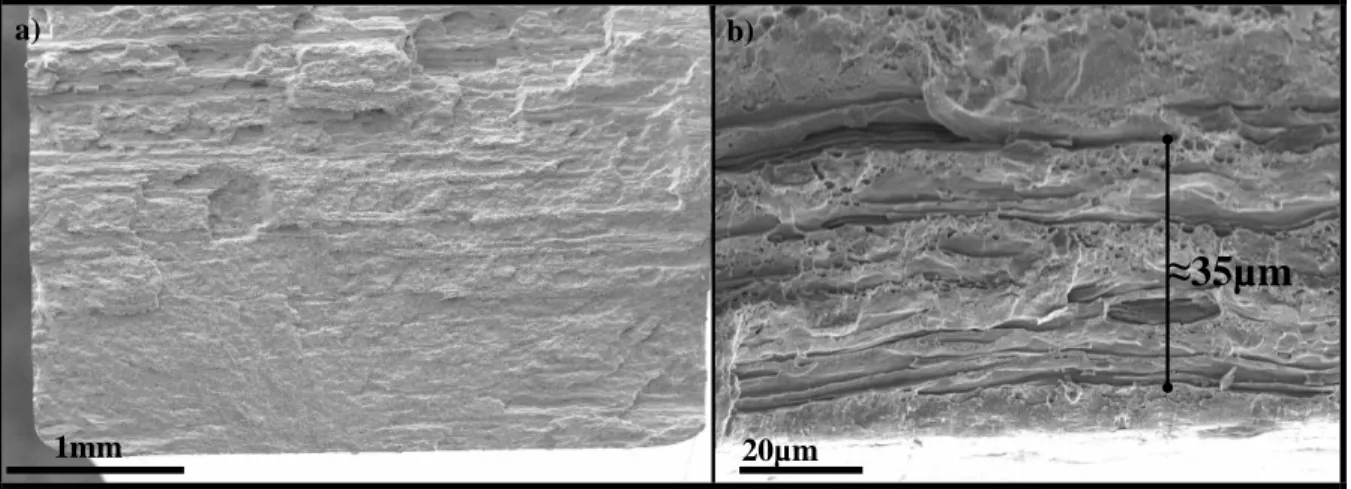
For a fibering orientation of 90°, the crack initiation zone is not clearly localised however, like the Metasco MC, multiple initiation sites can be found within the inclusion bands (Fig. 10).
laminage
20µm 1mm
≈35µm
a) b)
Fig. 10: Failure surfaces of the Splitasco for a fibering orientation of 90°
2.3 The anisotropic fatigue behaviour of the steel C35
The third steel investigated is the mid-carbon steel C35. This material possesses, like the Splitasco, a banded ferrite-pearlitic microstructure (Fig. 11) however its mechanical
characteristics are largely inferior to the two previously discussed steels (Table 5). This steel also contains small manganese sulfide inclusions, of several micrometers (Fig. 11 b)).
200µm
a)
b)
10µm
rolling direction
rolling direction
Fig. 11: The ferrite-pearlitic microstructure of the C35 steel
In order to rapidly determine the push-pull fatigue strength at 2x10⁶ cycles, the “Locati method” or the method of “successive levels” has been used, for 2 specimens per orientation, extracted from a 70mm diameter bar.
Each specimen (Fig. 6 a)) was cyclically loaded starting at a given stress amplitude, assumed to be below the expected fatigue strength at 2x10⁶ cycles. If the specimen did not fail after 2x10⁵ cycles the stress amplitude was increased. This was repeated until the specimen ruptured after less than 2x10⁵ cycles. The fatigue strength at 2x10⁶ cycles is then calculated, taking into account the accumulation of fatigue damage over all of the tested stress levels using the Miner linear (equation (4)) damage accumulation rule on each step and the Basquin curve (equation (5)).
To identify the inverse slope of the Basquin curve, b, the experimentally determined value for C35 steel is used. This value was taken from reference [23] and is equal tob25. Equations (4-6) are then used to estimate the fatigue strength at 2x10⁶ cycles of each specimen.
1
1 1
j i i i n i iN
n
D
D
(4) b aCN
1
(5)1
1 1
j i b a i n i iC
n
D
D
(6)In terms of the classical definition of a fatigue strength, there should be no damage
accumulation below the fatigue strength at 2x10⁶ cycles. In the following, equation (6) is first used to estimate the fatigue strength at 2x10⁶ cycles considering all of the loading steps, regardless of whether or not they are below the fatigue strength. The result is shown in Table 4. The estimated fatigue strength is 217.96 MPa. A second calculation is then done
considering only the load steps greater than the initially estimated fatigue strength at 2x10⁶ cycles. Table 4 shows that the damage accumulated in the lowest load steps is very small and does not significantly affect the final result.
stress amplitude
(MPa) 200 210 220 230 240
estimated fatigue strength at 2x10⁶ cycles (MPa) ni cycles 2x10⁵ 2x10⁵ 2x10⁵ 2x10⁵ 79 005 217.96
Damage Di 0.01 0.04 0.13 0.38 0.44 1 ni cycles - - 2x10⁵ 2x10⁵ 79 005 217.50
Damage Di - - 0.13 0.40 0.47 1
Table 4: Estimated fatigue strength at 2x10⁶ cycles using the “Locati method”
1mm
a)
b)
50µm
Fig. 12: Failure surface of the C35 steel, for a fibering orientation of 90°
The results indicate that the fatigue strengths at 2x10⁶ cyclesfor the 3 fibering orientations are very similar (Table 5 and Fig. 13) and closed to the literature results for this steel [23]. Observation of the failure surfaces for the 90° fibering orientation (Fig. 12) do not show the presence of inclusions, hence it appears that crack initiation occurs within the material matrix.
2.4 Fatigue test summary
Based on the fatigue tests undertaken using the C35 ferrite-pearlitic steel it can be concluded that for this material, the push-pull fatigue strength at 2x10⁶ cyclesis isotropic. Despite the presence of manganese sulphide inclusions that are elongated in the rolling direction, crack initiation always occurs in the material matrix independently of the fibering direction. The fact that crack initiation is not associated with inclusions is not surprising and is in agreement
intrinsic defect size (a ). However, it is surprising that the banded microstructure, which 0
results in a privileged orientation of microstructural barriers, does not create an anisotropic effect in terms of fatigue. It is possible that the orientation of the microstructural barriers present in the ferrite-pearlitic microstructure have a limited effect on the crack initiation phase, or that the scale is too big with respect to the size of the cracks that initiate in a ferrite grain (with an average grain size of approximately 75µm).
Fibering Orientation Fatigue Strength (MPa) at 2x10 6 cycles Metasco MC Splitasco C35 0° 476 420 218 45° 453 382 220 90° 415 360 220
Defect type Inclusions band Inclusions band Inclusion alone Defect diameter (µm) 32 µm ≈35 µm <4µm
Length >100 µm >100 µm <20µm
Table 5: Fatigue tests results for each materials and fibering orientations
The push-pull fatigue behaviour of the Splitaco steel is anisotropic and is very similar to that observed for the Metasco MC steel. For these two materials, which have fatigue strengths at 2x10⁶ cycles that are higher than that of the C35 steel, it is coherent to observe, for a fibering orientation of 90°, crack initiation that is located at the inclusion bands, as the critical defect size is smaller than for the C35. As per the C35 steel, the Splitasco also has a banded
microstructure (resulting in a privileged orientation for microstructural barriers). This banded microstructure does not appear to affect the fatigue behaviour or cause fatigue anisotropy.
0,8 0,85 0,9 0,95 1 0° 45° 90° σ( θ° )/ σ( 0 °) Fibering angle Metasco MC C35 Splitasco
10μm
10μm
n Inclusions band on failure surface Initiation in material matrixFig. 13: Evolution of the fatigue strength at 2x10⁶ cycles (Normalized by the fatigue strength at 0°) as a function of the fibering angle
3 CRITERION
The fatigue tests outlined above lead to the conclusion that two of the three steels investigated demonstrate fatigue anisotropy (i.e. the Metasco MC and the Splitasco) and that the elongated inclusions in the rolling direction are responsible of the anisotropic behaviour. The anisotropy is therefore due to the change in defect sensitivity as a function of the fibering orientation.
In the domain of fatigue of metallic materials, two large families of fatigue criteria coexist. The first considers that crack initiation is related to local plasticity within an isolated, badly orientated grain. The second family uses Fracture Mechanics concepts to describe the propagation of a pre-existing crack. The choice made in this work is to combine these two approaches using a probabilistic framework.
The probability of rupture PF1 associated with crack initiation within the material matrix is taken into account via the Morel [4] approach. This approach is based on the hypotheses of elastic shakedown at the mesoscopic scale and the weakest link theory applied to all material
planes of a Representative Elementary Volume. The random character of the fatigue resistance is introduced via a Weibull distribution. The probability of rupture due to the apparition of mesoplasticity in the matrix can be expressed by this model using equation (7).
V m a H a F d d d k T V P 2 0 0 2 0 01 , 01 01 sin , , 1 exp 1 1 (7)Where Ta
,
,
is the shear stress amplitude on the material plane defined by
,
,
, m1 and 01 are respectively the scale factor and the Weibull exponent related to the scatter associated with the first fatigue initiation mechanism. The integration in equation (7) is used to take into account the crack initiation potential on each of the planes within the element of volume.The probability that a crack will propagate from an inclusion PF2 is taken into account using concepts from Linear Elastic Fracture Mechanics. The inclusions are assumed to be pre-existing cracks. It is assumed that for long cracks, mode I propagation is dominate. By considering the defects as elliptical cracks, the range of the stress intensity factor Kcan be estimated as a function of the applied stress range, a correction factor for the shape of the crack and the size of the crack. The propagation condition is defined by comparing the stress intensity factor K to the crack propagation threshold of the materialKth. It is therefore assumed that failure occurs if:
K Kth
(8)
The random nature of the crack propagation threshold is introduced using a Weibull distribution. The originality of this approach resides in the fact that a local stress intensity factor K
, on a plane defined by the two angles
,
is considered and that theprobability of exceeding the crack propagation threshold can be written as the probability of finding a critical value of Kthwhich is inferior to the applied valueK
, :
C K th thK
f
K
d
K
P
,
0 02 02,
(9)If m2 governs the scatter and the factor Kth02is the scale factor of the distribution of the crack propagation threshold, the probability of rupture on a plane is:
,
1 exp
,
2 02 02 m th K K P
(10)Considering crack propagation from a defect only in the plane where the normal stress is a maximum (i.e. the critical plane) is relatively restrictive. Even if a “critical plane” type approach appears to give good results for simple uniaxial loading conditions, it can be
expected that for more complicated multiaxial loads it will become rapidly limited. In order to better take into account complex loading conditions it is proposed here to estimate the
possibility of crack propagation on each possible plane by summing the probabilities of propagation over all of the planes in a Representative Elementary Volume. By apply the theory of the weakest link over all planes of a reference volume V0, the probability of crack propagation within the volume can be written as:
2 0 0 02 02 02sin
,
1
exp
1
,
2d
d
K
K
D
K
K
P
P
m th th F (11)The probability of total rupture of the structure can be obtained by applying a second time the theory of the weakest link. The sum of the probabilities of rupture of each of the elementary volumes can be written as:
V m th Fd
d
dV
K
K
V
P
2 0 0 02 02 2sin
,
1
exp
1
2 (12)
)
(
)
,
(
,
K
a
(13)Where (,) is the intensity range of the applied stress normal to the plane defined by
,
. Note that the geometry of the defect in each of the planes is introduced via the definition of the correction factor ().By using expression (13), the probability of rupture of the structure becomes:
V m th Fd
d
dV
K
a
V
P
2 0 0 02 02 2sin
)
,
(
1
exp
1
2 (14)The total probability of survival on the component is defined by again applying the hypothesis of the weakest link. It is obtained by multiplying the two survival probabilities from the two different observed mechanisms:
1
1
1
2
1
P
F
P
F
P
F (15)The entire process is represented in Fig. 14. If this criterion is plotted as a function of the defect size it results in a probabilistic Kitagawa type diagram and describes the competition between the two observed mechanisms. Thanks to this framework the scatter associated with each mechanism is explicitly taken into account.
Matrix behaviour
Elastic Shakedown on a plane
Effect of defects
Propagation threshold on a plane
accumulated meso-strain threshold c Propagation threshold Kth Microstructural
parameter
Stress Tensor
Stress intensity factor on a plane Accumulated meso-strain on a plane
Integration over all planes
2 0 0 02 02 02 sin , 1 exp 1 2 d d K K D P m th F 2 0 0 2 0 01 01 01 sin , , 1 exp 1 1 d d d D P m FIntegration over the component volume
V m th F d d dV K K V P 2 0 0 02 02 2 sin , 1 exp 1 2 V m F d dd dV V P 2 0 0 2 0 01 01 1 sin , , 1 exp 1 1 Mechanism competition σD=f(a),m1=m2 Competition
Average crack size
Fat ig u e l im it Failure probability Pf=0,9 Pf=0,5 Pf=0,1
1
1
1
2
1
P
F
P
F
P
F defect size FPD c th K
) ( , , K a
,,
02 th K 2 m 01 1 m 1 m 01 F P D F P D F P DFig. 14: Summary of the proposed fatigue criterion that results in a probabilistic Kitagawa
type diagram
4 APPLICATION
4.1. Fatigue anisotropy predictions for uniaxial loads for different steels
To determine the parameters of the model it is necessary to know the fatigue strength of the material without defects as well as its crack propagation behaviour. For the 3 materials tested, when the fibering orientation is 0° crack initiation occurs in the matrix, hence the fatigue strength at 0° will be used to determine the parameters defining PF1.
For the Metasco MC and the Splitasco steels, when the fibering orientation is 90°, crack initiation is localized at the inclusion bands. For these two steels, the fatigue strength at 90° will be used to determine the parameters defining PF2. Note that for the Metasco MC and the Splitasco the values of the crack propagation threshold have been estimated from the fatigue strength at 2x10⁶ cycles at 90° and are ΔKth,R=-1=8MPa m1/2 and ΔKth,R=-1=7.2MPa m1/2
respectively, without counting for crack closure. This is coherent with the values obtained via classical testing methods for high strength steels.
For the C35 steel, the alternating and effective threshold stress intensity factor range has been identified by Billaudeau [24] ΔKeff th=3MPa m1/2 using a load ratio of R=0.88. For the
purposes of this work, the following approximate value has been assumed ΔK th, R=-1 =6MPa m1/2.
Fig. 15 shows the Kitagawa diagram for the 3 materials studied and the 0° and 90° fibering orientation have been plotted. The experimental data are also shown on the diagram.
100 1000 1 10 100 1000 F ati g u e L imi t (M Pa)
Average crack size (µm)
Fibering orientated at 0° Fibering orientated at 90° Experimentals points
C35 Steel
Splitasco
Metasco MC
Fati
gue
li
m
it
(MP
a)
32µm 4µm 35µmFig. 15: A Kitagawa type diagram for the 3 materials studied for 0° and 90° fibering
orientations
4.2. Anisotropic fatigue predictions for multiaxial loads
As previously discussed, the proposed criterion is constructed to take into account any type of loading mode or path. To illustrate this, an example of combined in-phase tension / torsion loads with a load ratio of -1 is presented below.
The multiaxial stress state is defined by:
t t a a sin sin , 12 12 , 11 11 (16)Where 11,a and 12,a are the normal and shear stress amplitudes. All other components of the stress tensor are zero.
Firstly, consider a fibering orientation parallel to direction 1, so that the inclusions are aligned in the tensile direction. For this configuration, the predictions of the model are shown in a
and the vertical axis is a purely reversed shear loading mode. In this example the material parameters used for the predictions are those of the Metasco MC bainitic steel.
Different defect sizes are considered, ranging from 0 to 100 m.
For the 0° fibering orientation, Fig. 16 shows that the amplitude of the normal stress has the same influence on the fatigue strength at 2x10⁶ cycles for defect sizes up to 50 m. For larger defect sizes (i.e. > 100m) the effect of the defect becomes more pronounced when the normal stress dominates. However when the shear stress dominates the defects do not greatly affect the fatigue response.
This same data and predictions are presented in another form in Fig. 17, with the maximum hydrostatic stress on the horizontal axis and the mesoscopic shear stress on the vertical axis. This diagram is none other than the Dang Van diagram discussed in the introduction. For the sake of clarity, the complete loading paths are not drawn, only the most critical points are shown. A comparison is also made with the Dang Van criterion, which is represented by the solid, straight line on the diagram.
Firstly, it can be observed that the proposed model and the Dang Van criterion lead to very similar predictions when the defect size is very small. However, when the defect size is increased to 100 m the sensitivity to the hydrostatic stress is much greater (i.e. the slope of the line is greater) and when the defect size is further increase to 200 m, the endurance line has the same slope but it is shifted vertically downwards. This new position is due to the fact that the torsional fatigue strength at 2x10⁶ cycles is affected when the defect size is 200 m.
A second fibering orientation is now investigated for the same tension-torsion loading mode. In this case the inclusions are perpendicular to the tensile load axis, direction 1. In the
11,a,12,a
plane, the predicted endurance curves for the four defect sizes are shown in Fig.fibering orientation. Unlike the 0° orientation, the sensitivity to the defect size is higher, as a 32 m defect affects the fatigue strength at 2x10⁶ cycles. Again, loading modes with a predominant shear stress component are less sensitive to the defect size.
The 50 m defect size reflects reasonably well the fibering orientation effect since it leads to very different behaviours for a 0° and 90° inclusion orientations. The endurance curve remains unchanged for the 0° case while it is strongly affected for the 90° orientation. This is particularly true when the normal stress component is predominant but this is more
pronounced for a 50 m defect than a 100 m defect and a fibering orientation of 0°.
Finally, the 100 m defect induces, at 90°, a drop of the pure shear fatigue strengthat 2x10⁶ cycles and hence a downward shift of the entire curve.
The purpose of this section was to demonstrate the improvement of the fatigue strength predictions under multiaxial loading compared to the well-known Dang Van criterion. It is shown that the predictions are very close when the fatigue damage mechanisms due the inclusions are not active and are coherent with a fatigue strength drop when the defect size increases. But the most important feature of this original approach is that it reflects the macroscopically observed fatigue anisotropy by taking into account the detrimental effect of defects depending on their orientations.
Fig. 16: Predictions of the model and experimental results represented in a
11,a,12,a
plane (When the inclusions are parallel to the tensile load axis, direction 1)Fig. 17: Predictions of the model and experimental results represented in a Dang-Van Diagram (when the inclusions are parallel to the tensile load axis, direction 1)
0 50 100 150 200 250 300 350 0 100 200 300 400 500 600 Σ12,a (M P a) Σ11,a(MPa) a=0 µm a=32 µm a=50 µm a=100 µm Experimental Result 100 150 200 250 300 350 0 50 100 150 Ta (M P a ) ΣH,a(MPa) a=0 µm a=32 µm a=100 µm a=200 µm
Fig. 18: Predictions of the model and experimental results represented in a
11,a,12,a
plane (when the inclusions are perpendicular to the tensile load axis, direction 1)5 CONCLUSION
Fatigue tests on different steels have highlighted the role of non-metallic inclusions, which have been elongated in the rolling direction, on the anisotropic fatigue behaviour.
The banded ferrite-pearlitic microstructure, orientated in the direction of rolling, for the C35 and Splitasco steels does not result in fatigue anisotropy.
Push-pull fatigue tests (R=-1) using specimens extracted at different orientations have shown that for the two high strength steels (UTS≈1000MPa) investigated, the coexistence of two crack initiation mechanisms, and the resulting competition between these mechanisms can explain the origin of the fatigue anisotropy. For these 2 steels the fatigue strength at 2x10⁶ cycles is a maximum for a fibering orientation of 0° and is a minimum at 90°.
A probabilistic analysis combining two criterion types, describing the two different
mechanisms is used to take into account this competition and to predict the fatigue strength at 2x10⁶ cycles as a function of the defect orientation and the size. The resulting unified criterion
0 50 100 150 200 250 300 350 0 100 200 300 400 500 600 Σ12 ,a (MP a) Σ11,a (MPa) a=0 µm a=32 µm a=50 µm a=100 µm Experimental Result
naturally results in a Kitagawa type diagram. The criterion results in prediction very similar to the Dang Van criterion when the defect size is small.
6 ACKNOWLEGEMENTS
This work was undertaken with the framework of the Optiforge project which was supported by the French “Agence National de la Recherche”. These results are the product of
cooperation between industry partners (Ascoforge, Ascometal, Cetim, PSA, Setforge and Transvalor) and academic partners (INSA Lyon-MATEIS, ENSMP-CEMEF, Arts et Métiers PARISTECH Angers-LAMPA).
7 REFERENCES
[1] J.Y. Berard, K. Dang Van, G. Baudry, influence de l’anisotropie sur le comportement en fatigue multiaxiale d’un acier de construction mécanique, IRSID, Technical Note No RI 93 062, 1993.
[2] A.Mateo, L. Llanes, N. Akdut, J Stolarz, M. Abglada, Anisotropy effects on the fatigue behaviour of rolled duplex stainless steels, Int. J. Fatigue 25 (2003) 481-488.
[3] M. Milesi, Y. Chastel, M. Bernacki, R.E. Logé, P.O. Bouchard, Explicit microscopic fatigue analysis of forged components, Comput. Methods Mater. Sci. 7 (2007) 383-388. [4] E. Pessard, F. Morel, A. Morel, D. Bellett, Modelling the role of non metallic inclusions on the anisotropic fatigue behaviour of forged steel, Int. J. Fatigue, 33 (2011) 568-577. [5] M.J. Roy, Y. Nadot, C.Nadot-Martin, P.-G Bardin, D.M. Maijer, Multiaxial Kitagawa analysis of A356-T6, Int. J. Fatigue, 33 (2011) 823-832.
[6] D.L. McDowell, K. Gall, M.F. Horstemeyer, J. Fan, Microstructure-based fatigue modeling of cast A356-T6 alloy, Eng. Frac. Mech. 70 (2003) 49-80.
[7] M. Brochu, Y. Verreman, F. Ajersch, D. Bouchard, High Cycle Fatigue Strength of Permanent Mold and Rheocast Aluminum 357 Alloy, Int. J. Fatigue 32 8 (2010) 1233-1242.
[8] C. Temmel, B. Karlsson, N.G. Ingesten, Fatigue isotropy in cross-Rolled, hardened isotropic-quality steel, Metall. Mater. Trans. A 39 A (5) (2008) 1132-1144.
[9] N.S. Cyril, A. Fatemi, Experimental evaluation and modeling of sulfur content and anisotropy of sulfide inclusions on fatigue behavior of steels, Int. J. Fatigue 31(3) (2008) 526-537.
[10] T. Makino, The effect of inclusion geometry according to forging ratio and metal flow direction on very high-cycle fatigue properties of steel bars, Int. J. Fatigue 30 (2007) 1409-1418.
[11] G. Lütjering, J. Albrecht, C. Sauer,T. Krull, The influence of soft, precipitate-free zones at grain boundaries in Ti and Al alloys on their fatigue and fracture behavior, Mater. Sci. Eng.A 468-470 (2007) 201-209.
[12] U. Krupp, I. Roth, H.-J. Christ, M. Kübbeler, C.-P Fritzen, M. Scharnweber, C.-G. Oertel, W. Skrotzki, The Role of Grain Orientation and Martensitic Transformation during Propagation of Short Fatigue Cracks in Austenitic Stainless Steel, Key Engineering Materials 465 (2011) 55-60.
[13] J. R. Mayeur, D. L. McDowell, R. W. Neu, Crystal plasticity simulations of fretting of Ti-6Al-4V in partial slip regime considering effects of texture, Comput. Mater. Sci., 41:3 (2008) 356-365.
[14] K. Dang van, Macro–micro approach in high-cycle multiaxial fatigue, In: McDowell DL, R. Ellis, editors. Proceedings of advances in multiaxial fatigue, ASTM STP 1191 (1993) 120– 130.
[15] I.V. Papadopoulos, Fatigue limit of metals under multiaxial stress conditions: the microscopic approach, Commission of the European Communities, Joint Research Center, Note N° I.93.101, joint Research Center, ISEI/IE 2495/93, 1993.
[16] F. Morel, N. Huyen, Plasticity and damage heterogeneity in fatigue, Theor. Appl. Fract. Mech. 49 (2008) 98-127.
[17] Y. Murakami, S. Beretta, Small defects and inhomogeneities in fatigue stregnth: experiments, model and statistical implications, Kluwer Academic Publishers (1999) [18] E. Thieulot-Laure, S. Pommier, S. Fréchinet, A multiaxial fatigue failure criterion considering the effects of defects, Int. J. Fatigue 29 (2007) 1996-2004.
[19] N.S. Cyril, A. Fatemi, Experimental evaluation and modeling of sulfur content and anisotropy of sulfide inclusions on fatigue behavior of steels, Int. J. Fatigue 31(3) (2008) 526-537.
[20] S. Pearson, Initiation of fatigue cracks in commercial aluminium alloys and the subsequent propagation of very short cracks , Engng. Fract. Mech., 7, (1975). 235-247. [21] H. Kitagawa, S. Takahashi, Applicability of fracture mechanics to very small cracks. In: ASM Proceedings of 2nd International Conference on Mechanical Behaviour of Materials, Metalspark, Ohio. (1976), 627–631.
[22] A.J. Mc Evily, M. Endo, M. Ishihara. The influence of biaxial stress on the fatigue behavior of defect-containing steels, Proceedings of the 11 international Conference on Fracture (2005).
[23] F. Morel, L. Flacelière, Data scatter in multiaxial fatigue: from the infinite to the finite fatigue life regime, Int. J. Fatigue 27 (2005) 1089–1101.
[24] T. Billaudeau, Y. Nadot, G. Bezine, Multiaxial fatigue limit for defective materials: mechanisms and experiments, Acta Materialia 52 (2004) 3911–3920.
![Fig. 2: Schematic Kitagawa-Takahashi’s diagram [18, 21]](https://thumb-eu.123doks.com/thumbv2/123doknet/7408453.218046/8.893.127.473.741.909/fig-schematic-kitagawa-takahashi-s-diagram.webp)