Science Arts & Métiers (SAM)
is an open access repository that collects the work of Arts et Métiers Institute of
Technology researchers and makes it freely available over the web where possible.
This is an author-deposited version published in:
https://sam.ensam.eu
Handle ID: .
http://hdl.handle.net/10985/13736
To cite this version :
Nicolas AUBIN, Benoit AUGIER, Julien DEPARDAY, Matthieu SACHER, Patrick BOT
-Performance enhancement of downwind sails due to leading edge flapping: A wind tunnel
investigation - Ocean Engineering - Vol. 169, p.370-378 - 2018
Any correspondence concerning this service should be sent to the repository
Administrator :
archiveouverte@ensam.eu
Contents lists available atScienceDirect
Ocean Engineering
journal homepage:www.elsevier.com/locate/oceaneng
Performance enhancement of downwind sails due to leading edge flapping:
A wind tunnel investigation
N. Aubin
a,∗, B. Augier
b, J. Deparday
c, M. Sacher
a, P. Bot
a aNaval Academy Research Institute, IRENav CC600, 29240, Brest Cedex 9, FrancebIFREMER, Marine Structures Laboratory, Z.I. Pointe du Diable, CS 10070, 29280, Plouzané, France cInstitute of Mechanical Engineering, Ecole Polytechnique Fédérale de Lausanne, Switzerland
A R T I C L E I N F O
Keywords:
Leading edge flapping Fluid-structure interaction Unsteady Sails Wind tunnel Downwind A B S T R A C T
This work presents a wind tunnel experimental study on the effect of the leading edge flapping on the aero-dynamic performance of a spinnaker. Four J80-class spinnaker models, combining two different assembling structures (panel layout) and two different sail materials are tested at various wind speeds and wind angles in a wind tunnel. Results show that, for the wind angle range the spinnaker is designed for, the sustained periodic flapping of the sail leading edge has a significant benefit on performance, with 10% increase in drive force. In these model-scale tests, the sail structural properties did not show significant differences in performance, but affect the point where flapping sets in: a model with a stiffer material and a cross-cut panel layout starts flapping for a longer sheet length, compared to a lighter cloth and a tri-radial layout. Finally, it is shown that the non-dimensional flapping frequency is rather constant 0.4in the design range of wind angle, but it varies with the wind speed and sail structural properties on a smaller wind angle where the spinnaker is more stretched.
1. Introduction
When sailing downwind, sailors usually trim their spinnakers on the verge of flapping. At a given trim, the leading edge—also called luff—spontaneously folds and unfolds periodically. This phenomenon is considered a good visual indicator that the sail is properly trimmed at the best efficiency. A common question among the sailing community for best performance is rather to trim the sail at sustained flapping or just before it appears. Downwind sails flapping—also known as cur-ling—has only been recently scientifically studied thanks to full-scale experiments (Motta et al., 2014; Motta, 2015; Deparday, 2016; Deparday et al., 2018). It has been shown that this phenomenon results from a complex three-dimensional Fluid-Structure Interaction. A high suction peak appears near the folded area during the unfolding stage producing a temporary significant increase of the aerodynamic load. Moreover the flapping is associated to a decrease of the aerodynamic load when the luff starts folding. Nevertheless it has not been possible to ascertain from these full-scale experiments if the sail trim is more efficient when the luff is flapping or when the sail is slightly more trimmed in.
To better assess the aerodynamic performance of downwind sails, Viola (2009)has numerically provided insights into the flow behavior, in particular in the luff area. Numerical simulations in Viola et al.
(2014)have also been performed on a fixed sail shape validated with wind tunnel experiments on flexible (Viola and Flay (2009, 2011, 2010)) and semi-rigid sails (Bot et al. (2013,2014)). Recent projects focused on the leading edge vortex flow pattern observed on downwind sail shape show promising results in the possible use of this phenom-enon in other applications (Arredondo and Viola, 2016;Viola and Muir, 2017).
Nonetheless, the realistic fluid-structure interaction simulations of downwind sails represent a significant step forward. High difficulties are due to the need to consider the great influence of the added mass and simulating the flapping of the luff which is challenging mostly due to very large deformations of the sail, requiring specific and complex mesh deformation methods. Moreover, stability and convergence of the coupling scheme are challenged by the large displacements near the leading edge, associated to large variations of pressures and flow ve-locity. As a first approach, a finite element method has been coupled to a fluid solver byRenzsch and Graf (2010);Trimarchi et al. (2013)in order to predict the sail flying shape in static simulations. Results could be compared to wind tunnel validation cases like Renzsch and Graf (2013). Lombardi et al. (2012) and Durand et al. (2010); Durand (2012); Durand et al. (2014) successfully achieved unsteady fluid-structure interaction simulations, but so far such simulations have not been compared to full-scale or wind tunnel experimental unsteady data,
https://doi.org/10.1016/j.oceaneng.2018.08.037
Received 4 October 2017; Received in revised form 2 July 2018; Accepted 23 August 2018 ∗Corresponding author.
E-mail address:nicolas.research.aubin@gmail.com(N. Aubin).
0029-8018/ © 2018 Elsevier Ltd. All rights reserved.
with time-resolved measurements as presented in Deparday et al. (2016a).
Unlike the full-scale tests, wind tunnel experiments are conducted in a controlled environment (Flay (1996)). Loads are usually measured onto the boat frame (Viola and Flay (2009);Campbell (2014)) and the sails flying shape detection is facilitated by the large workplace around the model. In wind tunnels, downwind sail tests are performed at a fixed “optimal trim” which is usually defined as the trim configuration where the propulsive force is maximal and when the sail shape is steady in time, i.e. when there is no flapping of the luff. Following is a review of the closely related literature with a focus on the flapping of the sail leading edge.
1.1. Closely related previous works
•
Richards et al. (2001) analyse the boat speed polar for an IACC sailing downwind, reviewing the effects of the speed triangle on the mutual contributions of lift and drag. It is noted that the maximum lift coefficient is obtained when the flow is tangent to the luff, which is when the sail is on the verge of collapsing, and that a solid sail is able to generate a slightly greater lift force, but this occurs in con-ditions where the cloth sail would collapse. The usual rule for trimming is given: ease the sheet until the windward edge starts to collapse and pull it back in a little. This corresponds to maximum lift. No results on variations of performance with sheet trim are given.•
Lasher et al. (2005)investigate rigid spinnaker models in order to avoid a complex fluid structure interaction, and note that a soft sail might collapse before reaching the point of maximum lift used on a beam reach. They highlight that testing soft sails is necessary to determine how this would impact their results.•
Viola and Flay (2009), report results of forces and pressures mea-sured in the Twisted Flow Wind Tunnel of the University of Auck-land on three soft sail models of asymmetric spinnakers at= 40
AW , AW= 55, AW= 70. The sail models, namely A1, A2, A3 have different design shapes, designed for increasing wind angles with increasing area and depth. The sail trim was adjusted in order to maximize the drive force, which was obtained for a steady, non-flapping sail for A1 and A2 and with a non-flapping luff for the deeper sail A3. For the latter sail, a tighter trim required to stabilize the luff and stop it flapping was also tested, and showed a reduction of drive force of the order of 10%. Unfortunately, the variations of forces for varying trims are not given for this A3 sail, and the published dis-cussion from the reviewers of this paper highlights that the very aspect of luff flapping needed further investigation.
Hence, results on downwind sails with a flapping luff are very scarce in the literature, whereas this situation is very common in real-life yacht racing, particularly for deep downwind sails used on moderate-speed yachts. According to the authors’ knowledge, no refined study has been published to show the variations of spinnaker performance with sheet trim with emphasis on the effect of flapping.
This paper presents a wind tunnel experimental study on the effect of the flapping occurrence on the aerodynamic performance of a
Nomenclature CF
x Drive force coefficient (−) AW Apparent wind angle (°) ρ Density of air (kg m−3)
CFy Side force coefficient (−) CFsheet Sheet load coefficient (−)
Fx Drive force (N)
Fy Side force (N)
fc Natural flapping frequency (Hz)
frc Reduced natural flapping frequency frc =fc S U (−)
Fsheet Sheet load (N) Lsheet Sheet length (mm)
q Dynamic pressureq=12 U2 (Pa) S Sail area (m2)
U Upwind reference wind speed m s−2
Fig. 1. Spinnaker model on the testing rig in the wind tunnel.
Fig. 2. Spinnaker flapping representation and wind velocity triangle, adapted
fromDeparday et al. (2018). (a) Downwind sail description. Flapping corre-sponds to luff oscillations. (b) Velocity triangle in downwind configuration view from top of the boat. The apparent wind velocity vector is the combination of the true wind velocity vector and of the opposite of the boat speed vector.
N. Aubin et al. Ocean Engineering 169 (2018) 370–378
spinnaker as shown inFig. 1. Propulsive force, side force and sheet load are measured for a wide range of trim settings, from largely over-trimmed sail—spinnaker not flapping—to completely eased out where the spinnaker luff is curled with a permanent fold. The investigation is repeated for four spinnaker models with different structural properties (see 2.2) but identical design shape. These time-resolved measurements for a large range of trim settings, for different values of wind speed and angle contribute to build a rich database to characterize the dynamic spinnaker behavior, which can be compared to full-scale results (Deparday et al. (2018)) and remains essential for unsteady numerical/ experimental comparisons. The experimental set-up and the sails used for this study are firstly described. Then the results for the different sails and conditions tested are presented and highlight the effect of the oc-currence of flapping on the sail performance. Eventually specific dy-namic aspects of the flapping phenomenon are characterised (see Fig. 2).
2. Experimental apparatus 2.1. Wind tunnel
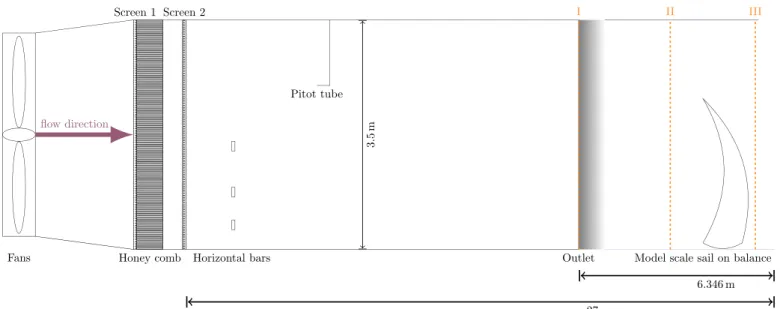
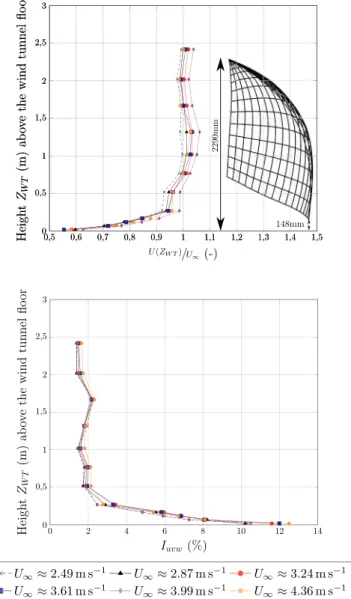
The experimental campaign was carried out in a wind tunnel of the University of Auckland, New Zealand (Flay (1996)), illustrated in Fig. 3, thanks to the Sailing Fluids collaboration program (https:// www.sailingfluids.org/). The twisting vanes were not used in this work in order to better control the flow. Experimental flow measurements are provided inFig. 4a. The model was set up onto a balance (described in Aubin et al. (2016)) which can measure the different aerodynamic forces. The open-jet testing section is 7 m wide by 3.5 m high. This paper focuses on the drive forceFx(aligned with the boat centreline),
the side force Fy(perpendicular to the boat centreline) and the sheet loadFsheetprovided by a load sensor attached to the clew point of the spinnaker. An upstream Pitot tube measured the reference wind speed
U providing the averaged reference dynamic pressure q used to define
the dynamic force coefficientCF( )t = F t
qS ( ) i
i where i stands for x, y or sheet. The dynamic results are averaged over 30 s long runs at a sam-pling frequency of 200 Hz to define the coefficient mean value:
= = C C t F t qS ( ) ( ) F F i i i (1)
A remote control stepper motor was used to control the sheet length. In the presented cases, the sheet length was kept constant during each
run. The 20 mm diameter carbon fibre mast was cantilevered at the step and fully rigged with stays.
2.2. Spinnaker models
A yacht sail and particularly a spinnaker is a non developable sur-face where the volume is partly obtained by assembling patches (pa-nels) of cloth on curved edges along seams, in order to match the de-sired design shape. Four 1:4.6 model-scale J80 spinnakers with identical design shape and an areaS=3.187 m2 were designed and manufactured by Incidence Sails (seeFig. 5). The differences between the spinnakers are about the material and the panel layout. Two dif-ferent fabrics are used: either the AirX 500, which is the lighter material (35 g m−2) of the study illustrated by the symbol or the SuperKote
0.75 material, a bit heavier (40 g m−2) but also 40% stiffer, illustrated
by the symbols . Two panel layouts are used: a triradial one or a cross-cut one as illustrated inFig. 5. The cross-cut structure is the most simple and cheapest to manufacture, whereas the triradial structure enables the high modulus direction of the fabric to be aligned along the expected stresses.
It should be noted that the similitude of material properties with the full-scale situation is not respected as this is nearly impossible to achieve in wind tunnel testing. Consequently, extrapolation to full scale of the present model-scale results concerning the structural behavior will be made with care (see Section 4). Finally, a sail with a given design shape will fly with very different flying shapes according to the trim and the flow it is subjected to. For more details on spinnaker flying shapes, the reader is referred toDeparday et al. (2016a)where a de-tailed analysis of a similar spinnaker is made with sail shape mea-surements at full scale.
3. Wind tunnel results
This section presents the results from the force measurements in the wind tunnel. The time-averaged forces are analysed first, and then, the evolution in time is presented.
3.1. Time-averaged force coefficients
The influence of the sheet length on the drive force is presented here for the four spinnaker models and for different apparent wind speeds and angles. Three different apparent wind angles (AW= 120;
; AW= 80) are tested with flow velocities from 2.49 m s
1to4.36 m s 1 corresponding to Reynolds numbers from3.4 105up to6 105. The evo-lution of the force coefficient is plotted for the different static sheet lengths tested. For each combination of a spinnaker model, a wind speed and angle - the sheet length is varied step by step between each run from an overtrimmed state corresponding to the shortest sheet
length value, to an overeased state with the longest sheet length (left to right onFigs. 6–8). The sheet is eased until luff flapping appears, re-presented by a vertical line with the symbol ; on the graphs. On the right hand side of this line, the leading edge is periodically curled and the sail is flapping. This vertical limit is associated to the state defined by sailors as “the verge of flapping”. Then, as the sheet length increases, flapping continues until the sail reaches an overeased state where the flapping is replaced by a permanent fold. This corresponds to the few last points on the right hand side in each graph.
As a first general comment onFigs. 6–8, it is worth noticing that the curves of force coefficients obtained for different values of the flow velocity gather reasonably well, which is a positive indication about the experimental results quality.
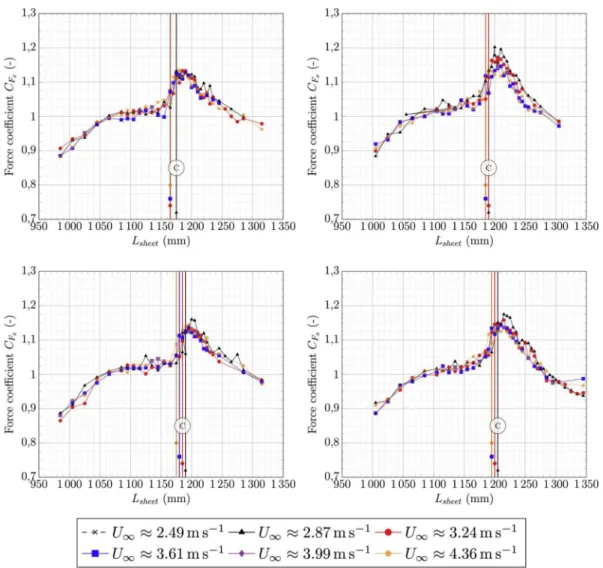
For , a characteristic behavior can be observed inFig. 6 for all spinnakers. When the sheet is eased from the most overtrimmed si-tuation, after a smooth increase followed by a 50 mm wide plateau at CFx 1, a sharp jump of the drive force occurs in a range of 10 mm–20 mm around the verge of flapping up to CFx 1.15. The maximum drive force is reached with a sheet eased 10 mm–20 mm after flapping appears and is more than 10% higher than with the steady shape just before flapping. When easing the sheet again from this point, the drive force decreases as the flapping area increases until a perma-nent fold is maintained for the few largest values of sheet length. The aerodynamic performances of the spinnaker with a permanent fold are always deteriorated compared to the over eased flapping state. This characteristic variations of driving force with the sheet trim is clear and independent of the structural details of the spinnaker model at this apparent wind angle the sail is designed for. Now we investigate how this finding holds for different apparent wind angles.
For AW= 120, shown inFig. 7, the same trend can be described but with a bit more scatter. At this apparent wind angle, the spinnaker is less stable and more subject to perturbations. The drive force peak is a bit less sharp and lower than in the previous case, but the maximum drive force is still observed with a sustained flapping of the leading edge, obtained when the sheet is eased 20–30 mm after the occurence of flapping.
For AW = 80, shown inFig. 8, two different trends can be observed for the evolution of drive force with the sheet length. Depending on the panelling method, the curves show either one or two local maxima. The global maximum drive force is located on different trims regarding the verge of flapping for the different spinnakers. The maximum drive force occurs before this limit for the triradial panel layout contrary to the cross-cut one where a second local maximum is identified just after the verge of flapping. In the AirX 500 case (Fig. 8b), the best performance is reached at the second local maximum, slightly eased after the verge of flapping. In the SuperKote 0.75 case (Fig. 8d), drive force seems iden-tical for the two maxima configurations, identified 100 mm before or slightly after the flapping occurrence. Overall, at this tight apparent wind angle, no clear benefit of flapping can be drawn in general for all tested models contrarily to higher apparent wind angles.
Moreover, to analyse the influence of the sheet length and the flapping on the whole yacht balance, side force and sheet load should also be considered. For the paper clarity, the side force and the sheet load are presented for one spinnaker and one angle only, as the de-scribed trend is identical for all studied cases. Fig. 9 presents re-presentative cases of the flapping occurrence effect on the side force and the sheet load coefficients. The side force coefficient monotonously decreases when the sheet is eased as the aerodynamic force becomes more oriented forward. The time-averaged side force is not strongly affected by the occurrence of flapping, except for a slightly steeper slope just after flapping starts. The related reduction of side force is an additional benefit of the flapping for the sailing performance, and an-other reason to ease the sheet more than the occurence of flapping even at tight wind angles.
The sheet load coefficient is affected by the flapping as illustrated in Fig. 9b where a local maximum is observed after the occurrence of Fig. 4. Experimental velocity flow description. (a) Velocity profile measured at
the outlet of the enclosed part of the wind tunnel (section I onFig. 3.) A spinnaker flying shape seen from the side is represented. Head and tack at-tachment points altitude values are indicated. (b) Turbulence intensity profile.
Fig. 5. Different assembling structures of spinnakers designed to match the
same design shape with SailPack from BSG Developments; Triradial panel layout (left), Cross Cut panel layout (right).
N. Aubin et al. Ocean Engineering 169 (2018) 370–378
flapping. This local maximum is associated to the maximum drive force previously observed, as aerodynamic forces are transmitted to the three points of the sail, thus to the sheet. The higher the apparent wind angle, the more significant this local maximum in the sheet load coefficient. The flapping effects on side force and sheet load coefficient remain significantly smaller than the ones observed on the drive force. This is consistent with what was found by Viola and Flay (2009) for the heeling moment.
3.2. Evolution in time of the force coefficients with flapping
In order to better understand the leading edge flapping, the force fluctuations are analysed and the flapping reduced frequency is de-termined.
The fluctuations of forces are of course affected by the leading edge flapping.Fig. 10shows the drive force coefficient time series in both non-flapping and flapping cases. It is clear that the leading edge flap-ping is responsible for a strong periodic oscillation of the drive force. Table 1gives the standard deviation of the drive force in both flapping and non-flapping states for the different spinnaker models. It shows that the fluctuation amplitude is more than doubled by the occurrence of flapping in cases and AW= 120, but only marginally increased in the case AW= 80. Indeed in the latter case of a tight apparent wind angle, the spinnaker is much more constrained due to less camber and a tighter sheet. It is then less free to move around and the flapping affects a smaller area around the leading edge. For and AW= 120,
fluctuations are dominated by the flapping, as shown onFig. 10. Ob-servation of the fluctuation amplitude in forces may be used for flap-ping detection with possible applications for an autonomous onboard trimming system.
3.3. Flapping reduced frequency
One parameter of interest is the natural frequency of flappingfc . This frequency has been determined both from the video footage of the spinnaker models and by spectral analysis on the force signals with identical results. Results are shown as a function of the flow velocity on Fig. 11, where the dimensionless reduced frequencyfrcis defined like in Deparday (2016);Deparday et al. (2017)as:
= frc fc S
U (2)
For AW = 120, and to a lesser extent for , the spinnaker luff flaps at a constant reduced frequency around 0.35–0.4 whatever the wind speed and structural features of the model. This means that the flapping fre-quency at these wind angles is probably driven by the dynamics of the flow itself, which forces flapping at this given reduced frequency. Indeed, the signature of this periodic oscillation is visible in the evo-lution of the drive force even in the absence of flapping (seeFig. 10), showing that the excitation from the vortex shedding already exists. The Strouhal number —non-dimensional frequency based on the sec-tion depth as the characteristic length instead of S — of these
oscil-lations is of the order of 0.2, suggesting that the osciloscil-lations are forced Fig. 6. Drive force coefficient CFxat AW= 100 for 4 different spinnakers. Vertical lines associated to ; represent the verge of flapping for each flow velocity tested. (a) Spi triradial AirX 500 . (b) Spi cross-cut AirX 500 . (c) Spi triradial SuperKote 0.75 . (d) Spi cross-cut SuperKote 0.75 .
by the vortex shedding from the large separation at the rear of the sail. Such large-scale vortex shedding has already been observed in pressure measurements on a semi-rigid spinnaker model by Bot et al. (2013, 2014)with a similar Strouhal number and associated to the oscillation of the trailing edge separation point.
For the tightest wind angle AW= 80, the reduced frequency de-creases with increasing flow velocity and depends on the structural properties of the spinnaker model. This reveals a more subtle fluid-structure coupling of the aeroelastic system in this case. Comparing these two cases, it may be considered that the spinnaker flying at a tight wind angle is more constrained (stretched) than when it is flying at a deeper wind angle where the forces on each corner are more oriented in the same direction and the spinnaker is rather free to move laterally. This consideration is supported by the observed global oscillations of the sail at AW = 120, which is not observed at AW= 80.
In the present experimental database, the flapping frequency may be used as a quantitative parameter to characterize the dynamics of this complex aeroelastic system, to compare different situations and to va-lidate the ability of an unsteady fluid-structure interaction simulation to resolve the leading edge flapping instability.
4. Discussion
In most of the previous wind tunnel studies about spinnaker per-formance, the spinnaker was usually trimmed “on the verge of flap-ping”, meaning that the sheet is eased until the leading edge starts
flapping and is trimmed back in order to suppress flapping and achieve a steady flying shape. This condition is usually considered as the op-timum performance trim. The present results show a strong increase in performance when the sheet is eased further after the occurence of curling in order to obtain a sustained periodic flapping of the leading edge. This observation is made in the wind angle range the spinnaker is designed for, 100
AW , but does not hold for a higher sailing course, 80
AW which is rather off-design for this sail. When the sheet is progressively eased, it is noticeable that the variation of forces is smooth, even with a plateau, while the spinnaker flying shape gently varies with the sheet length but remains steady, whereas the drive force shows a sharp jump as soon as the leading edge flaps. This suggests that a new dynamic mechanism enters into play to increase the aerodynamic forces when the flapping instability sets in.
This finding clearly highlights the interest of considering the un-steadiness in downwind sails aerodynamics and the strong fluid struc-ture interaction acting on these very compliant membranes. Moreover, this may lead to reconsider what was called the optimal performance trim of a spinnaker in previous wind tunnel studies.
The aerodynamic forces measured for the different spinnaker models are similar and no general trend emerges from this investigation to rank the different structural properties tested -triradial versus cross-cut panel layout, AirX 500 versus SuperKote 0.75 fabric-in terms of performance. However, the different structural properties are shown to affect the occurence of flapping. From the different results obtained, we can observe that flapping appears for a shorter sheet length for the Fig. 7. Drive force coefficient CFxat AW= 120. Vertical lines associated to ; represent the verge of curling for each flow velocity tested. (a) Spi triradial AirX 500
. (b) Spi cross-cut AirX 500 . (c) Spi triradial SuperKote 0.75 . (d) Spi cross-cut SuperKote 0.75 .
N. Aubin et al. Ocean Engineering 169 (2018) 370–378
triradial panel layouts. In the triradial structure, the first top radial seam close to the leading edge and nearly parallel to the luff (seeFig. 5) seems to facilitate the folding process. On the contrary for the cross-cut structure, the seam in the horizontal direction (see inFig. 5) makes a significantly stiffer luff to resist curling. Indeed, the seams are made of the superposition of two cloth layers, responsible for a locally higher bending stiffness which is not negligible at this model scale.
For a given panel layout and flow speed, the lighter material AirX 500 triggers the curling for a shorter sheet length. The spinnaker being lighter, its flying shape tends to be more elevated with a top luff more likely to go to the windward side closer to the curling situation. Moreover the lighter material also has lower stiffness and inertia, and then is more sensitive to flow fluctuations.
In general, the faster the flow, the shorter the sheet length where curling appears, as the sail can fly higher and closer to the curling si-tuation thanks to a higher flow dynamic pressure.
This study is to be connected to a full-scale study byDeparday et al. (2016b, 2017) where the dynamic effects of spinnaker flapping on forces and pressures are shown. A refined analysis of pressure variations associated to the luff flapping is given inDeparday et al. (2018). From the present wind tunnel study, extrapolation to full scale is not straightforward as there is no similitude particularly in terms of struc-tural properties. Indeed, the fabrics used to make the present models are also used to make full-scale spinnakers, but the flow dynamic pressure and aerodynamic loads are much lower. Hence, the present observations about the influence of the sail's structural properties may
not hold at full scale. Nevertheless, the main result —i.e. the optimal performance is obtained for a sustained periodic flapping of the leading edge for AW 100—looks very robust and independent from the structural properties. This finding is then very likely to hold at full scale.
4.1. Recommendations for sailors
Recommendations on the best practice to trim a spinnaker to its optimal performance can be inferred from this study, depending on the wind angle. Note that these conclusions are obtained for a J80-class type of spinnaker—deep asymmetric spinnaker with a very loose luff, designed for VMG downwind sailing on a moderate-speed yacht—and may not apply to a flatter tight-luffed sail designed to sail at hotter apparent wind angles.
Following the results observed in the wind tunnel: 1. On a running course, say 100
AW , the sheet should be eased slightly more than the limit of curling, in order to obtain a sustained flapping of the luff. Note that the optimal driving force obtained with a flapping luff is as high as 10% greater than for a slightly tighter trim resulting in a steady spinnaker luff which compare well with previous findings fromViola and Flay (2009). The refined and extended trim settings tested in the present paper nevertheless highlights that the optimal trim peak is narrow—a sheet length amplitude of order 20 cm on a full-scale J80—and performance Fig. 8. Drive force coefficient CFxat AW= 80 for 4 different spinnakers. Vertical lines associated to ; represent the verge of curling for each flow velocity tested. (a) Spi triradial AirX 500 . (b) Spi cross-cut AirX 500 . (c) Spi triradial SuperKote 0.75 . (d) Spi cross-cut SuperKote 0.75 .
deteriorates rapidly when the sheet is eased further towards a per-manently folded luff.
2. On a reaching course, say 80
AW the optimal trim may depend on the spinnaker assembling method, but in general, it seems preferable to maintain a non-flapping sail and the occasional curling of the luff should be sought only as an indicator that the sheet is not too much overtrimmed.
It was noted in this study that the permanent fold con-dition—overeased compared to the flapping occurence—was far from the optimum drive force.
5. Conclusions
The effects of leading edge flapping on a downwind sail are in-vestigated by analyzing aerodynamic forces as a function of sail trim on J80-class spinnaker models, for various wind speeds and angles. This type of spinnaker is rather deep and designed to sail at apparent wind angles around100 or120. The four tested spinnaker models combine
two different sail cloths—AirX 500 and SuperKote 0.75—and two
different panel layouts—cross-cut and triradial. The measured evolu-tion of force coefficients are not dependent on the wind speed. The results show that the occurence of flapping is associated to a significant increase in the drive force for all tested models, in the design range of wind angle. The maximum drive force is then obtained with a sustained periodic flapping of the leading edge, and is around 10% higher than with a steady sail shape at the limit of flapping, obtained with a slightly tighter sail trim. This highlights the necessity to consider the natural dynamic behavior of downwind sails and may lead to reconsider what was called the optimum spinnaker trim with a steady sail shape in some previous works. The effects of flapping on the side force and sheet load are much smaller than on the drive force.
For a smaller apparent wind angle, AW= 80 which is rather off-design for this sail, no clear benefit of flapping is shown in general and the accurate optimal spinnaker trim may depend on the sail's structural properties. In this model-scale study, no significant difference in per-formance is observed between the two sail cloths and panel layouts tested. However, stiffer and heavier cloth as well as cross-cut structure make the flapping appear at a slightly longer sheet length, compared to a lighter fabric and triradial panelling.
In the wind angle design range, the reduced frequency of the leading edge flapping is constant, indicating that the frequency is driven by the flow itself. As the Strouhal number of these oscillations is close to 0.2, it is suggested that the flapping might be mostly driven by the vortex shedding from the large separated area at the rear of the sail, but this would need further investigation, both about the fluid structure inter-action of soft sails, and also with rigid sails to better understand the excitation from the fluid itself in a more simple situation. In a more prospective view, it may be interesting to test a forced dynamic Fig. 9. Side force and sheet load coefficient on representative cases. Vertical
lines associated to ; represent the edge of flapping for each flow velocity tested. (a) Side force coefficient CFy for AW= 100 the spinnaker triradial SuperKote 0.75 . (b) Sheet load coefficient CFsheetfor AW= 100 for the spinnaker crosscut AirX 500 .
Fig. 10. Time series comparison between a flapping and a non flapping case for
the Spinnaker cross-cut SuperKote 0.75 , AW= 120, U 3.61 m s 2. Time series filtered using a Savitzky-GolaySchafer (2011)filter of order 2 of span 201 samples. Mean value levels over the represented 10 s are provided by the dash lines.
Table 1
Representative values of the standard deviation of the drive force coefficient CFx( )t; nf stands for non flapping case and f for flapping case.
Standard deviation given in %
AW 80 100 120
sail nf f nf f nf f
SPI TRI AirX 500 2 2.5 2.5 5 2.5 7 SPI TRI SuperKote 0.75 2 2.5 2.5 6 2.5 6.5 SPI CC SuperKote 0.75 1.75 2.5 1.5 4 3 6 SPI CC AirX 500 2 3 2.5 5 2.5 6.5
N. Aubin et al. Ocean Engineering 169 (2018) 370–378
trimming of the spinnaker—as was done on an upwind sail inAubin et al. (2016)—especially for trimming frequencies close to the natural flapping reduced frequency-to better analyse the dynamic effects and investigate if further performance gains are possible.
Acknowledgements
The authors are grateful to Incidence Sails and Ronan Floch who very carefully manufactured the spinnaker models and to the Yacht Research Unit, University of Auckland for providing the test facility. This work was supported by Brest Métropole Océane, and received funding from the European Union's Seventh Programme for research, technological development and demonstration [grant number noPIRSES-GA-2012-318924] (SAILING FLUIDS https://www.
sailingfluids.org/), from the Royal Society of New Zealand, from the “Laboratoire d’Excellence” LabexMER (ANR-10-LABX-19). One of the authors (BA) acknowledges support from Région Bretagne and from the European Union's Seventh Framework Programme (FP7/2007–2013) under REA (PRESTIGE-Campus France) [grant number no
PCOFUND-GA-2013-609102].
References
Arredondo, A., Viola, I.M., 2016. On the leading edge vortex of thin wings. In: 69th Annual Meeting of the APS Division of Fluid Dynamics Meeting Abstracts, vol. 61 Portland, Oregon, USA. https://meetings.aps.org/Meeting/DFD16/Session/R6.10.
Aubin, N., Augier, B., Bot, P., Hauville, F., Sacher, M., Flay, R.G.J., 2016. Wind tunnel investigation of dynamic trimming on upwind sail aerodynamics. In: The 22nd Chesapeake Sailing Yacht Symposium. Annapolis, Maryland, USA, pp. 111–121.
Bot, P., Viola, I.M., Flay, R.G.J., Brett, J.-s., 2013. Wind-Tunnel pressure measurements on model-scale semi-rigid downwind sails. In: The Third International Conference on Innovation in High Performance Sailing Yachts (Innovsail). Lorient, France, pp. 119–127.
Bot, P., Viola, I.M., Flay, R.G.J., Brett, J.-S., 2014. Wind-tunnel pressure measurements on model-scale rigid downwind sails. Ocean Eng. 90, 84–92.https://doi.org/10.1016/j. oceaneng.2014.07.024.
Campbell, I.M.C., 2014. A comparison of downwind sail coefficients from tests in different wind tunnels. Ocean Eng. 90, 62–71.https://doi.org/10.1016/j.oceaneng.2014.06. 036.
Deparday, J., 2016. Experimental Studies of Fluid-structure Interaction on Downwind Sails. Ph.D. thesis. Université de Bretagne Occidentale, Brest.
Deparday, J., Bot, P., Augier, B., 2018. Experimental analysis of a strong fluid structure interaction on a soft membrane - application to the flapping of a yacht downwind sail. J. Fluid Struct. 81, 547–564.
Deparday, J., Bot, P., Hauville, F., Augier, B., Rabaud, M., 2016a. Full-scale flying shape measurement of off wind yacht sails with photogrammetry. Ocean Eng. 127 (October 2016), 135–143.
Deparday, J., Bot, P., Hauville, F., Augier, B., Rabaud, M., Motta, D., Le Pelley, D., 2016b. Modal analysis of pressures on full-scale spinnaker. In: The 22nd Chesapeake Sailing Yacht Symposium. Annapolis, Maryland.
Deparday, J., Bot, P., Hauville, F., Augier, B., Rabaud, M., Motta, D., Le Pelley, D., 2017. Modal analysis of pressures on a full-scale spinnaker. Journal of Sailing Technology 2010–2011.
Durand, M., 2012. Interaction fluide-structure souple et légère, applications aux voiliers. Ph.D. thesis. Ecole Centrale de Nantes.
Durand, M., Hauville, F., Bot, P., Augier, B., Roux, Y., Leroyer, A., Visonneau, M., 2010. Unsteady numerical simulations of downwind sails. In: International Conference on Innovation in High Performance Sailing Yachts. Lorient, France.
Durand, M., Leroyer, A., Lothodé, C., Hauville, F., Visonneau, M., Floch, R., Guillaume, L., 2014. FSI investigation on stability of downwind sails with an automatic dynamic trimming. Ocean Eng. 90, 129–139.https://doi.org/10.1016/j.oceaneng.2014.09. 021.
Flay, R.G.J., 1996. A twisted flow wind tunnel for testing yacht sails. J. Wind Eng. Ind. Aerod. 63 (1–3), 171–182.
Lasher, W.C., Sonnenmeier, J.R., Forsman, D.R., Tomcho, J., 2005. The aerodynamics of symmetric spinnakers. J. Wind Eng. Ind. Aerod. 93 (4), 311–337.http://www. sciencedirect.com/science/article/pii/S0167610505000243.
Lombardi, M., Cremonesi, M., Giampieri, A., Parolini, N., Quarteroni, A., 2012. A strongly coupled fluid-structure interaction model for wind-sail simulation. In: 4th High Performance Yacht Design. Auckland, New Zealand, pp. 212–221.
Motta, D., 2015. An Experimental Investigation of Full-scale Sail Aerodynamics Using Pressures, Shapes and Forces. Ph.D. thesis. The University of Auckland. Motta, D., Flay, R.G.J., Richards, P.J., Le Pelley, D.J., Deparday, J., Bot, P., 2014.
Experimental investigation of asymmetric spinnaker aerodynamics using pressure and sail shape measurements. Ocean Eng. 90, 104–118.https://doi.org/10.1016/j. oceaneng.2014.07.023.
Renzsch, H., Graf, K., 2010. Fluid-structure interaction simulation of spinnakers - getting close to reality. In: The Second International Conference on Innovation in High Performance Sailing Yachts. Royal Institution of Naval Architects, Lorient, France.
Renzsch, H., Graf, K., 2013. An experimental validation case for fluid-structure-interac-tion simulafluid-structure-interac-tions of downwind sails. In: The 21st Chesapeake Sailing Yacht Symposium. Annapolis, Maryland, USA.
Richards, P., Johnson, A., Stanton, A., 2001. America's cup downwind sails — vertical wings or horizontal parachutes? J. Wind Eng. Ind. Aerod. 89 (14), 1565–1577. bluff Body Aerodynamics and Applications. http://www.sciencedirect.com/science/ article/pii/S0167610501001350.
Schafer, R.W., 2011. What is a savitzky-golay filter? IEEE Signal Process. Mag. 28 (4), 111–117.
Trimarchi, D., Vidrascu, M., Taunton, D., Turnock, S., Chapelle, D., 2013. Wrinkle de-velopment analysis in thin sail-like structures using MITC shell finite elements. Finite Elem. Anal. Des. 64, 48–64.https://doi.org/10.1016/j.finel.2012.09.005. Viola, I.M., 2009. Downwind sail aerodynamics: a CFD investigation with high grid
re-solution. Ocean Eng. 36 (12), 974–984.https://doi.org/10.1016/j.oceaneng.2009. 05.011.
Viola, I.M., Bartesaghi, S., Van-Renterghem, T., Ponzini, R., 2014. Detached eddy simu-lation of a sailing yacht. Ocean Eng. 90, 93–103.https://doi.org/10.1016/j. oceaneng.2014.07.019.
Viola, I.M., Flay, R.G.J., 2009. Force and pressure investigation of modern asymmetric spinnakers. Transactions of the Royal Institution of Naval Architects Part B: International Journal of Small Craft Technology 151 (2), 31–40.
Viola, I.M., Flay, R.G.J., 2010. Pressure distributions on modern asymmetric spinnakers. Transactions of the Royal Institution of Naval Architects Part B: International Journal of Small Craft Technology 152 (1), 41–48.
Viola, I.M., Flay, R.G.J., 2011. Sail pressures from full-scale, wind-tunnel and numerical investigations. Ocean Eng. 38 (16), 1733–1743.https://doi.org/10.1016/j.oceaneng. 2011.08.001.
Viola, I.M., Muir, R.E., 2017. The leading-edge vortex of swift wings. bioRxiv, the preprint server for biology.https://doi.org/10.1101/099713.
Fig. 11. Reduced natural frequency of the flapping vs. flow velocity. Error bars
represent the uncertainty on the measured frequency. (a) AW= 120. (b) = 100
AW . (c) AW= 80.