Technology researchers and makes it freely available over the web where possible.
This is an author-deposited version published in: https://sam.ensam.eu Handle ID: .http://hdl.handle.net/10985/7598
To cite this version :
Jaouher SELMI, Jean-Philippe COSTES, Philippe LORONG, Gérard POULACHON, Patrice CARRAS - Spindle position influence on milling operation stability - 2013
Spindle position influence on milling operation stability
J. SELMIa,c, J.P. COSTESa, P. LORONGb, G. POULACHONa, P. CARRASca. Arts et Métiers Paristech, LaBoMaP, Cluny, France b. Arts et Métiers Paristech, PIMM, Paris, France
c. RENAULT, Rueil Malmaison, France
Abstract:
Machine tool is the most used manufacturing means in automotive industry. This kind of manufacturing machine is very expensive and has immediate influence on produced workpiece quality. During machining process design, a tool machine specification sheet is written for each machining operation depending on workpiece required quality, material hardness and cutting conditions. In this way, in order to optimize investments, new machining center should be able to manufacture the quality set by workpiece specification sheet. The main aim of the work presented in this paper is to define and test a new method for spindle dynamic stiffness comparing.
The used approach is firstly based on dynamic criteria attained through FRF (Frequency Response Function) measured experimentally on machining center spindle. Secondly, stability limits are calculated and then obtained experimentally. In this case the criterion of steady state limit is used to compare different spindle configurations regarding the tool.
Keywords: Spindle, Dynamic stiffness, Chatter, Stability, Criteria, Milling
1 Introduction:
Besides of machining-center power and torque limits, self-excited vibrations occurrence (chatter) constitutes a real productivity limitation. Otherwise, Peklenik and Gartner [1] and Pruvot [2] have shown that stiffness lack in machining systems could have a negative effect on dimensional produced work piece accuracy.
Lobe stability diagram is a chart which represents stability and instability domains during machining and allows the choice of preferential cutting condition in order to increase productivity and avoid vibration. Tlusty [3] and Tobias [4] have invented the theory of regeneration; they demonstrated that the instability in milling is due to this phenomenon and appears when a depth of cut threshold is reached. They also pointed the theory of stability lobes and demonstrated that areas allowing big material removal rate are situated in high speed region. Usually working in those regions, especially for soft materials machining, activates mode related to the tool. However, hard material machining is associated to structural low frequency mode of machining center subset [5].
Many other studies have been carried on spindle characterization, Gurney [6], Sadek [7] and Yuce[8] have used the coefficient of Merit to compare spindles dynamic behavior by setting the structure into forced vibrations. In addition, Tobias [9] used stability chart as a comparative dynamic test certificate. Altintas [10] has set a model for stability chart prediction. However machining center reliability from avoiding chatter point of view depends on how machining center will be used.
Otherwise, Abele [11], and Pruvot [12] showed that spindle stiffness depends on its design, especially geometrical dimension, and ball bearing specifications and positions.
This paper presents a general approach for machining center qualification based on instability behavior. In the first section, a global approach of spindle qualification is shown using experimental and mathematical methods. In the second part some milling tests are made in order to confirm the proposed method.
2 Hammer tests:
2.1 Experimental method:
The aim of this section is to study the influence of spindle position in a three dimension space on its dynamical behavior in order to validate a method for spindle stiffness evaluation. All tests presented in this paper were made on the same machining center designed by DMG. The machine center used is three axes architecture, equipped with a spindle (KESSLER) and ball screw axis technology. The experimental setups are depicted in FIG.1. For each axis movement, spindle was positioned at the extreme positions, and then the spindle nose FRF
measurements were made in each one. However, the spindle shaft is not easily reachable to make hammer test because of spindle headstock protection. In order to get FRF on spindle shaft nose, the spindle was equipped with a tool holder, which was excited by hammer. Hammer tests were made following instructions and details described below:
- A low mass bandwidth accelerometer [Sensitivity: 100mV/g] was located on the tool holder and connected to computer through a high frequency data acquisition card.
- A modal hammer [Sensitivity: 2,27mV/N] was connected to the acquisition card.
- Impulse hammer shocks are conducted on the tool holder using soft and hard tips in order to enhance signal quality and get a larger signal representation for high and low frequencies.
2.2 Results and interpretation:
The different tests weremade for all positions described FIG.2. Spindle positions on (X, Y) map have no influence on spindle nose stiffness. The spindle Y axis positions FRF shown in FIG.2-a) are approximately
superposed.
However, FRFs show that the spindle stiffness is affected by its position on Z axis. The spindle modes amplitude are lower when the spindle is in the highest position, which means that spindle has a better dynamic behavior in this position. Otherwise, when the spindle is set in the lowest position, flexion modes amplitudes are often higher and could affect the machining process
quality. Then the spindle is more flexible in this position.
In order to show the difference between the spindle nose FRF and the spindle nose equipped by a rigid tool, one complimentary hammer test was then made in the tool tip following the same experimental previous description. Results depicted in FIG.3 shows that tool tip FRF magnitude is approximately three times higher than spindle FRF magnitude. As expected, the spindle with tool is more flexible than the spindle nose itself [13]. In addition, it shows that mode frequencies are the same for spindle noise itself and spindle nose
FIG.2 - Spindle nose FRF, a) Through Y axis, b) Through Z axis
FIG.3 - Tool point and spindle nose FRF
a) b)
equipped with a tool. The modes depicted in fig belong to the spindle. Then spindles can be compared
regarding one reference tool.
3 Machining tests:
3.1 Preliminary calculations:
This part of study will focus on spindle positions on Z axis. In order to compare two spindles or two machining center spindle positions regarding the tool, the stability axial depth limit was the chosen criterion. This limit “aplim” is defined as the maximal axial
depth of cut where chatter does not occur for any chosen spindle rotation speed [FIG.4].
In order to compare the two spindle configurations regarding the tool, an SDOF approximation was made, considering that the system dynamic behavior is led by the highest mode on FRF. A simplified chatter limit prediction model invented by Tlusty[3] was used to compare both tested spindle position ability to remove materials without chattering “aplim”. This is one dimensional model which considers that tool is
excited by one radial periodic force regarding teeth in contact with the work piece and gives an approximation of the limit of axial depth of cut:
aplim ( ) ( ) Equation 1
Where Kt (N/mm²) is the specific cutting force, Re [FRF]min (mm/N) is the minimum Real part of the tool
point FRF and m is the number of teeth cutting simultaneously. Then, results are shown in the table below:
Kt= 1200 MPa, m = 4 and Kr = 90°
High spindle position Low spindle position
Re[FRF]min(m/N) -2,58 10-8 -5,4 10-8
aplim(mm) 4,21 2,01
Table 1 - Stability limits
1.1. Experimental Method:
Stability lobe is a chart which makes distinction between two domains steady machining area and instable machining one. Around high frequencies when machining soft material like aluminum, stability lobes contain areas that allow increasing the depth of cut. However, when working around low frequencies, high productivity areas disappear. The stability limit becomes
somehow horizontal line [FIG.4] which chatter could not occur behind for any rotation speed [9], this line is often set by the mode with maximum amplitude. Otherwise, the spindle/tool system dynamic behavior depends largely on the tool flexibility. The spindle dynamic behavior could be completely hidden and dominated by the tool dynamic behavior when the later is flexible [14]. The experimental method described below is used to find a correlation with tapping test and validate spindle stiffness qualification criterion set above.
FIG.4 - Stability Chart
FIG.5 - Experimental setup a) Low spindle position b) High spindle position
In this experimental test, the used tool has been chosen very rigid “milling tool with 9 carbide inserts” in order to maintain spindle dynamic behavior during machining. Cast Iron workpieces especially designed to be very rigid when clamped were used for this machining trial. Moreover machining was made for the two defined spindle positions on z axis. Experimental setup is depicted in FIG.5-a) the work piece was mounted in a low position work holding device. The spindle goes up to make machining operation on it. In FIG.5-b) a work holding device raise the workpiece up 500 mm above the table reference plan, then the spindle remain in high position for face milling. Acceleration and sound acquisition are made during machining operation as described below:
- A low mass, wide bandwidth accelerometer was attached on spindle headstock perpendicular to the feed direction
- The acceleration signal was recorded using Daysilab software at 5 kHz sampling frequency.
- A microphone is used for sound frequency analyses and helps on vibration frequency detection
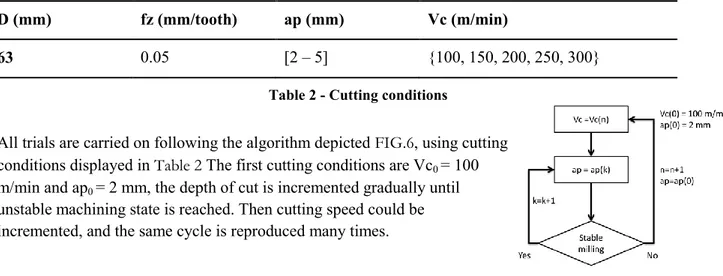
D (mm) fz (mm/tooth) ap (mm) Vc (m/min)
63 0.05 [2 – 5] {100, 150, 200, 250, 300}
Table 2 - Cutting conditions
All trials are carried on following the algorithm depicted FIG.6, using cutting conditions displayed in Table 2 The first cutting conditions are Vc0 = 100
m/min and ap0 = 2 mm, the depth of cut is incremented gradually until
unstable machining state is reached. Then cutting speed could be incremented, and the same cycle is reproduced many times.
3.2 Results and interpretation:
From the transfer function of both the spindle in high and low position on Z axis, the results depicted on the stability chart [FIG.7] were expected. Indeed machining stability and quality is better when the spindle is less flexible i.e. spindle in high position. Moreover the stability limits as defined in section 3.1, is a straight horizontal line passing by 2.5 mm. Besides of acoustic emissions which help on instable machining detection, the surface quality was also an important indicator which was always good after steady milling. However, when chatter occurs it was most of time inacceptable [FIG.8]; tool vibration print was left on it and was detected by seeing and touching. Otherwise, in the second machining position: spindle situated in the higher position, the system was very rigid; machining was steady all the time and surface quality was very good. For all tested machining, chatter did not occur. The maximum tested and reached axial depth of cut without chattering was 5 mm. Moreover, any strong acoustic emission or acceleration was detected respectively by the sound or acceleration FFT analysis. Otherwise roughness and surface visual state show a big difference between steady machining and instable ones. When milling is instable, produced surface is deteriorated and roughness level is inacceptable.
Given the fact that chatter did not occur for high spindle position configuration, chatter frequencies analysis concerns only the low machining spindle position.
Besides to acceleration analysis, acoustic emmissions was recorded during machining in order to analyze machining frequencies.
FIG.7 - Experimental stability chart of spindle milling a) in low position on Z axis b) in high position on Z axis Cutting conditions:
N= 500 rpm, ap = 4 mm, fz = 0.05 mm/tooth Instable milling: Deteriorated surface Rt = 26,8 µm and Ra = 2,52 µm
Cutting conditions:
N = 500 rpm, ap=2 mm, fz = 0.05 mm/tooth Steady milling: Good surface state Rt= 13,1 µm and Ra = 2,44 µm
FIG.8 - Surface state
The two cases depicted in FIG.9 show the machining transition from steady milling to chatter. In the FIG.9-a), the inserts passing frequency (75 Hz) is detected in the FFT signal: before chattering, peaks amplitude levels are very low, then when machining become instable a very high peak is detected around 139 Hz. In the
FIG.9-b), the second analyzed case is about an insert passing frequency of 187 Hz, then just when chatter occurs a very high peak around 139 Hz also appears. The 100 Hz peak
appearing in all depicted FFT charts corresponds to the electrical network frequency detected by the accelerometer. Otherwise, for almost, machining chatter occurred around 139 Hz.
4 Discussion:
FRF chart [FIG.2-b)] have shown that spindle when located in high position have a better dynamic behavior than when located in low position. Indeed, FRF low spindle position curve is often above on the analyzed frequency domain, which means that the spindle is more flexible. Firstly, this result was confirmed by calculation which has shown that stability limit was higher for the higher spindle position [FIG.1]. Secondly, it was confirmed by milling tests, since stability chattering limits shown in FIG.7 have been reached easily after 3mm of axial depth of cut in low spindle position configuration and have not been reached for tests when the spindle was in high position. Otherwise, acceleration values, sound intensity and surface visual and measured states was used like indicators to detect chatter occurrence. Moreover, machining frequencies analyses have shown that high level vibrations amplitude frequencies were around 139 Hz. In FIG.3 it is obvious that this frequency is very close to the spindle natural frequency at 133 Hz which is detected by a high amplitude peak and a phase change. This frequency corresponds to the minimum FRF real part Re[FRF]min[15].
0 1 2 3 4 5 6 250 750 1250 1750 A xi al d e p th o f c u t (m m ) N(RPM) unstable slightly unstable Stable 0 1 2 3 4 5 6 250 750 1250 1750 A xi al d e p th o f c u t (m m ) N(RPM) stable
FIG.9 - Machining frequencies a) Teeth passing frequency = 75 Hz b) Teeth passing frequency = 187 Hz
Otherwise, there was no chatter when machining was made in high spindle position configuration. The 139 Hz mode frequency which has the most influence on vibration has disappeared. This fact is demonstrated through FIG.2-b) which shows that there is no more mode around 139 Hz in this position.
Stability limit Horizontal line is set by the more critical mode (i.e.higher amplitude) in the FRF. This limit was found experimentally equal to 2,5 mm; it was also found by calculation equal to 2 mm, there is a small difference between the two results depending on model reliability and experimental parameters accuracy; however both methods could be used for setting stability limits to compare machining center spindles.
5 Conclusion:
The study presented in this paper was focused on comparing the dynamic behavior of machining center spindle, and the spindle regarding the tool from avoiding chatter point of view. The proposed criterion “aplim” was obtained by calculation and by experiment. It was tested on two spindle positions presenting two
different behaviors depending on spindle position in the machine workspace. Moreover, tests were carried on in low machining frequencies, which excited the structure modes. This fact was revealed during machining by chatter frequencies detection which was very close to the spindle natural frequency.
Finally, according to the mathematical model calculation presented before and milling results, dynamic machining center behavior could change on workspace. However, stability limit criterion gives a good representation of machining center behavior regarding the tool and could be generated and used in order to compare various spindles in different machining centers. This method is useful to estimate machining center structural limitation by only one hammer test and calculation.
References:
[1] J. Peklenik, J. R. Gartner, workpiece accuracy criterion for the dynamic machine tool acceptance test, International journal of machine tool design & research, Vol.7, p. 303-324, 1967
[2] F. Pruvot, Conception et calcul des machines-outils, Vol.3 : Les broches étude dynamique, Presse Polytechnique et universitaires romandes, ISBN: 2-88074-266-8, 1995
[3] J. Tlusty, L. Spacek, Self-excited vibrations on machine tools, Nakl.CSAV, Prague, Czech Republic 1954 [4] S.Tobias, Machine-Tool Vibration, Blackie, London, 1965.
[5] E. Ezugwu, Key improvements in the machining of difficult-to-cut aerospace super alloys, International Journal of Machine Tools and Manufacture, Vol.45, p.1353–1367, 2005
[6] J. P. Gurney, S. A. Tobias, A graphical method for the determination of the dynamic stability of machine tools, International journal of machine tool design & research, Vol.1, p.148-156, 1961
[7] M. M. Sadek, S. A. Tobias, Comparative dynamic acceptance tests for machine tools applied to
horizontal milling machines, Proceedings of the Institution of Mechanical Engineers, Vol.185, p319-33,1970 [8] M. Yuce, M. M. Sadek, S. A. Tobias, Pulse excitation technique for determining frequency response of machine tools using an-line minicomputer and a non-contacting electromagnetic exciter, International journal of machine tool design & research, Vol.23, p.39-51, 1983
[9] S. A. Tobias, Dynamic acceptance tests for machine tools, Vol.2, p.267-280, 1962
[10] Y. Altintas, M. Weck, Chatter stability of metal cutting and Grinding, CIRP Annals Manufacturing Technology, Vol.53, p.619-642, 2004
[11] E. abele. Creating stability lobe diagrams during milling, CIRP Annals, Vol.53, p.309-312, 2004 [12] F. Pruvot, Conception et calcul des machines-outils, Vol.2 : Les broches étude cinématique et statique, Presse Polytechnique et universitaires romandes, ISBN: 2-88074-262-5, 1993
[13] F. Koppka, Thesis: A contribution to maximization of productivity and workpiece quality of the reaming process by analyzing its static and dynamic behavior, Darmstadt, December 2008
[14] V. Gagnol, Thesis: Modélisation du comportement dynamique des électro-broches UGV,Clermont Ferrand, septembre 2006
[15] J. H. Wang, K. N. Lee, Suppression of chatter vibration on a CNC machine center-an example, Mechanical system and signal processing,Vol.10, p.551-560, 1995