This is an author-deposited version published in: https://sam.ensam.eu Handle ID: .http://hdl.handle.net/10985/15037
To cite this version :
Jade GEORIS CRESEVEAU, Christophe CLARAMUNT, Françoise GOURMELON - An integrated Methodology for the Study of Spatial Data Infrastructures Use: the Case of Coastal Stakeholders in France International Journal of Geographical Information Science Vol. 31, n°1, p.122138 -2018
For Peer Review Only
! " GEORIS CRESEVEAU Jade, CLARAMUNT Christophe, GOURMELON Françoise
For Peer Review Only
Nowadays the continuous development of Spatial Data Infrastructures provides a favorable context for environmental management. But in fact, the real
contribution of SDIs depends on the answers they provide to their users. To the best of our knowledge, few studies have addressed SDI uses at large. The research presented in this paper introduces a novel methodological approach for the study of SDI uses within the context of Integrated Coastal Zone Management (ICZM) in France. We develop a two)tier approach that combines a structural and data flow modeling analysis based on Social Network Analysis (SNA) and Data Flow Diagrams (DFD) applied to an online questionnaire and semi)structured interviews. The results reveal a multi)SDIs and multi)levels use which is structured around several key SDIs whose role is particularly significant, but complemented by a series of ‘minor’ SDIs. This use is also based on information flows between SDIs and other entities (e.g. institutional partners, working group) involved in the sharing of the geographical information within the framework of French coastal management.
Keywords: Spatial Data Infrastructures (SDI), coastal stakeholders, use, Social Network Analysis (SNA), Data Flow Diagram (DFD)
Since the mid)1990s, the development of Spatial Data Infrastructures (SDI) matches the urgent need expressed at the international level to facilitate access, exchange and sharing of geographical information held by different producers in order to maximize their use, management and production (Crompvoets et al., 2004). A SDI can be defined as a set of technological and non)technological components (Rajabifard et al., 2002) constituting an intra and inter)organizational network (Vandenbroucke et al., 2009) contributing to broader goals such as economic development, social stability, good governance and sustainable management of the environment (Williamson et al., 2003, Masser, 2010). The development and implementation of SDIs at multiple levels
2 3 4 5 6 7 8 9 10 11 12 13 14 15 16 17 18 19 20 21 22 23 24 25 26 27 28 29 30 31 32 33 34 35 36 37 38 39 40 41 42 43 44 45 46 47 48 49 50 51 52 53 54 55 56 57 58 59
For Peer Review Only
(Rajabifard et al., 2006) and the resulting geographical information flows should provide a favourable context for land management and planning. However, and as mentioned by many authors (Masser, 2005, Nedović)Budić et al., 2008, Hennig et al., 2013) the technological advances and operational frameworks behind theimplementation of SDIs are not sufficient to ensure the achievement of this objective. In fact, taking into account the users’ needs is a key factor for successful SDIs’
development. However, while substantial efforts have been devoted to the definition of standards and technology platforms, little attention is given to users’ expectations (Vandenbroucke, 2011). This can be explained by the fact that SDIs are complex and large information systems implemented on top of different data infrastructures from conventional to web)based architectures, developed at different local, regional and national levels. Therefore, the search for a comprehensive view of the information that flows through these decentralized platforms, and identification of users’ profiles, requests and expectations are far from being a straightforward task (Budhathoki et al., 2008, Nedović)Budić et al., 2008, Hennig et al., 2013).
The research developed in this paper introduces a methodological approach for the study and analysis of SDIs’ use. The objective is to study SDIs’ use through users’ appropriation in their professional environment, the information flows, and the
relationships that emerge, with a focus on the relationships between the different users’ levels and SDIs’ levels (e.g., from local to regional, regional to national). Our approach combines a structural and data flow modelling analysis based on Social Network Analysis (SNA) (Wasserman and Faust, 1994) and Data Flow Diagrams (DFD) (Mylopoulos, 1998). The objective is the identification of the SDI structural
characteristics on the one hand, and the information flows associated on the other hand. This should allow an exploration of SDIs uses and structural properties at the
2 3 4 5 6 7 8 9 10 11 12 13 14 15 16 17 18 19 20 21 22 23 24 25 26 27 28 29 30 31 32 33 34 35 36 37 38 39 40 41 42 43 44 45 46 47 48 49 50 51 52 53 54 55 56 57 58 59
For Peer Review Only
aggregated and local levels, as well as an exploration of users’ patterns at the individual level. The SNA approach is based on a bipartite graph, a method relatively untapped in the field of SNA (Borgatti and Everett, 1997) and where users as well as SDIs are modelled as nodes, and data flows between SDIs and users as arcs. We applied several graph)based operators that provide a series of structural analysis whose most significant patterns are explored by a visual exploratory framework as suggested by Tukey (1977) and Brandes et al. (2006). This SNA approach is complemented by a conceptual DFD representation that characterises the information flows between the SDIs and their users. The objective is to reveal the main patterns that emerge from the local to the global levels. Finally, a visual integration of the SNA and DFD approaches provide a global structural and conceptual representation of the SDIs studied, thus highlighting the multi) level dimension of public policies related to land management and planning as well as the multiple levels of SDIs implementations.
The remainder of the paper is organised as follows. Section 2 develops the main modelling principles behind the SNA and DFD approaches. Section 3 briefly introduces the main properties of the case of French stakeholders while Section 4 presents the experimental study. Finally Section 5 discusses the main findings while Section 6 draws the conclusions and outlines further work.
!
Inspired by network theory, SNA approaches study humans’ social networks to identify the structural properties and trends that emerge (Wasserman and Faust, 1994, Scott, 2000). The relations between the individuals of a given system, the local and global shapes are the focus of analysis (Hanneman and Riddle, 2005).
2 3 4 5 6 7 8 9 10 11 12 13 14 15 16 17 18 19 20 21 22 23 24 25 26 27 28 29 30 31 32 33 34 35 36 37 38 39 40 41 42 43 44 45 46 47 48 49 50 51 52 53 54 55 56 57 58 59
For Peer Review Only
The corpus is organized as a matrix that defines the relationships between the different individuals of the network and the analysis is based on a series of
mathematical measures and graphical exploration. Several mathematical measures can be derived to characterize a social network, the individuals and their relationships. Among them, the notion of centrality can express the involvement of an individual in the network (Borgatti, 2005) through various measures such as the local measure of degree and the global measures of closeness centrality and betweenness centrality (Freeman, 1978).
The main advantage of an SNA analysis lies in its ability to not only provide a series of mathematical values that outline some local and global structural properties, but also to represent graphically and visually the relationships that emerge within the network (Brandes et al., 2006) in a sort of visual exploratory framework (Card et al., 1999). The SNA approach provides the structural component of our modelling approach. It is particularly suited to the representation of the individuals involved in a given network, and has the advantage of providing a series of mathematical measures to evaluate local and global properties.
While SNA provides a sort of static view of the interactions and individuals involved in a given social network, a behavioural approach should support the representation of the dynamics of a given system. The selected approach, Data Flow Diagrams (DFD), came from the domain of information design, and while initially applied to software
engineering although its scope has been now largely extended to a wide range of data and information modelling (Mylopoulos, 1998). Based on a graphic formalism, DFD diagrams denote how data are used by a system on the one hand, and on the other hand,
2 3 4 5 6 7 8 9 10 11 12 13 14 15 16 17 18 19 20 21 22 23 24 25 26 27 28 29 30 31 32 33 34 35 36 37 38 39 40 41 42 43 44 45 46 47 48 49 50 51 52 53 54 55 56 57 58 59
For Peer Review Only
identify the external entities involved (i.e., people or systems). It allows primarily to materialize the data flows between the involved entities (Li and Chen, 2009). Thanks to a hierarchical decomposition of data processes, the DFD approach provides a series of nested diagrams; from the most general diagram called context diagram (also known as “level 0” diagram), to the increasingly more specific diagrams describing in greater detail, processes and data flow (Whitten and Bentley, 2005, Li and Chen, 2009, Shelly and Rosenblatt, 2009).
So far SNA and DFD analysis have been often applied to model humans’ social network and the dynamics of some systems of interest, respectively. However, and to the best of our knowledge, they are hardly applied together. The approach developed in this paper combines the two approaches in order not only to study the main patterns that emerge from several SDIs modelled as a social network where actors interact with the SDIs, but also as a set of SDIs and actors interacting according to some general use patterns.
The SNA approach represents explicitly the relationships between a series of SDIs and users interacting with them as part of their professional practices. The network representation developed is based on a bipartite directed graph relating two types of nodes: users and SDIs. Links model uses, that is, relationships between users and SDIs, and are oriented from the users to the SDIs. The network that emerges not only provide an explicit representation of all uses of a large set of SDIs (macro view), but also a detailed representation of the uses of a given SDI (micro view). A series of graph)based measures are applied to reflect the local and global specific properties of the network, that is, the measures of degree, betweenness centrality and closeness centrality. The degree of a node is given by the number of nodes connected to that node, it is a local
2 3 4 5 6 7 8 9 10 11 12 13 14 15 16 17 18 19 20 21 22 23 24 25 26 27 28 29 30 31 32 33 34 35 36 37 38 39 40 41 42 43 44 45 46 47 48 49 50 51 52 53 54 55 56 57 58 59
For Peer Review Only
measure. Global measures of betweenness centrality and closeness centrality consider the network as a whole.
The betweenness centrality evaluates the proportion of the shortest paths between the nodes pairs which pass through a given node. The closeness centrality reveals whether a given node can reach other nodes with a path on the graph comprising a fairly limited number of arcs. The betweenness centrality Cb(n) (1) of a node n is
given as follows (Newman, 2003):
Cb(n) = ∑s≠n≠t (σst (n) / σst) (1)
where s and t are nodes in the network different from n, σst denotes the number
of shortest paths from s to t, and σst (n) is the number of shortest paths from s to t that n
lies on.
The closeness centrality Cc(n) (2) of a node n is defined as the reciprocal of the
average shortest path length and is computed as follows (Sabidussi, 1966):
Cc(n) = 1 / avg( L(n,m) ) (2)
where L(n,m) is the length of the shortest path between two nodes n and m. The closeness centrality of each node is a number between 0 and 1.
The figures that emerge from the application of these measures are often complemented by the visual analysis of the represented graphs for exploration purpose (Tukey, 1977). In particular, the graph)based and exploratory analyses are applied to the bipartite graph at two levels of abstraction: the institutional level upon which the user works, and the one that models the institutional level upon which the SDI is
implemented. The application of these two criteria takes into account the multi)level dimension of public policies reflected by land management and planning activities, by
2 3 4 5 6 7 8 9 10 11 12 13 14 15 16 17 18 19 20 21 22 23 24 25 26 27 28 29 30 31 32 33 34 35 36 37 38 39 40 41 42 43 44 45 46 47 48 49 50 51 52 53 54 55 56 57 58 59
For Peer Review Only
the SDIs implementation, as well as the importance of reflecting the collaborative interactions between the different SDIs considered (Vandenbroucke and Biliouris, 2011). The network and structural components of our modelling approach and the SNA represented have been implemented on top of the SNA software UCINET andNETDRAW (Borgatti et al., 2002) that respectively provides several graph)based measure analysis and visual functions (Knoke and Yang, 2008, Huisman and Van Duijn, 2005).
Based on a conceptual and graphical representation of the users’ professional practices, the DFD analysis represents and categorizes information flows between the SDIs identified by the SNA approach, as well as the other institutional entities and relationships to them.
The DFD analysis is materialized by a context diagram. This allows a generalization of the main functions of the networks of SDIs, as well as the external entities interacting with them. The context diagram is developed according to several modelling abstractions (Yourdon and Constantine, 1979) that represent SDIs, users and information flows. SDIs are represented by "system" symbols (i.e., circles) while users by the symbols "external entity" (i.e., rectangles) and information flows by the symbol "flow" (i.e., arrow). As for the SNA analysis, the DFD analysis is also based on a multi) level structure in order to take into account both the territorial levels of public policies as well as the different levels of the SDIs implementation.
" # $ $ % &
The experimental framework has been applied to the coastal zone management context in France. Across the land)sea interface, coastal areas are complex territories (Sale et al., 2008) whose management is supported by a wide range of actors and institutions involved at various scales and with differing objectives. Indeed, management and
2 3 4 5 6 7 8 9 10 11 12 13 14 15 16 17 18 19 20 21 22 23 24 25 26 27 28 29 30 31 32 33 34 35 36 37 38 39 40 41 42 43 44 45 46 47 48 49 50 51 52 53 54 55 56 57 58 59
For Peer Review Only
planning tasks require appropriate geographical information at the most relevant scales (Bartlett and Smith, 2004). In particular, the need for multiple informational resources (i.e., environmental, economic, social, cultural, etc.) on several coastal regions, and this at complementary scales, implies collaboration and information between data producers and users (Gillespie et al., 2000, Sale et al., 2008, Butler et al., 2011).
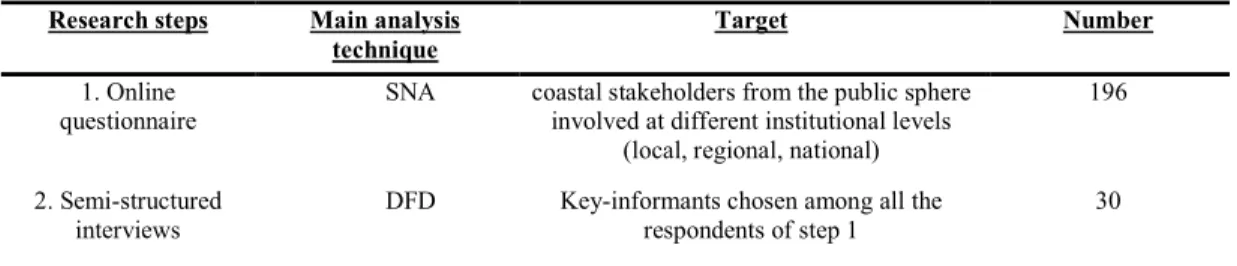
The continuous search for a better wealth, as well as the need for a better use of the potential of French marine and coastal zones, has placed these territories at the heart of the national policy. This has led to identify the collection and sharing of geographical information via SDIs as a major component to favor the development of coastal and marine public policies. Our study considers coastal stakeholders from the public sphere and involved at different institutional levels (i.e., local, regional, national) in the implementation of management policies of French coastal areas. The data collection strategy combines an online questionnaire with the participation of 196 coastal stakeholders from all over the country and semi)structured interviews conducted with 30 key)informants (Tremblay, 1957), with varied profiles and chosen among all respondents of the online questionnaire.
The 196 responses to the online questionnaire were represented by the SNA approach, while the minutes of the 30 semi)structured interviews have been modelled by the DFD approach (Table 1).
Table 1. Main methods and data applied to the study
'
(
& ) $*
1. Online questionnaire
SNA coastal stakeholders from the public sphere involved at different institutional levels
(local, regional, national)
196
2. Semi)structured interviews
DFD Key)informants chosen among all the respondents of step 1 30 2 3 4 5 6 7 8 9 10 11 12 13 14 15 16 17 18 19 20 21 22 23 24 25 26 27 28 29 30 31 32 33 34 35 36 37 38 39 40 41 42 43 44 45 46 47 48 49 50 51 52 53 54 55 56 57 58 59
For Peer Review Only
+ # $ '
! " # #
The 196 coastal stakeholders who cooperated in the investigation and submitted replies to the questionnaire overall identified 80 SDIs used for coastal practices. More than half of the respondents (56.5%) reported using several SDIs (from 2 to 11).
Amongst several trends observed and measured, the SNA analysis outlines the multiplicity of the SDIs use reported by the coastal respondents. It also appears from this analysis, that the resulting graph of the nodes and links is highly polarized, this denoting a scale)free network (Barabási and Albert, 1999). This reflects the fact that a few SDIs are connected with a large number of users, while many SDIs are used by only one or a small number of coastal users.
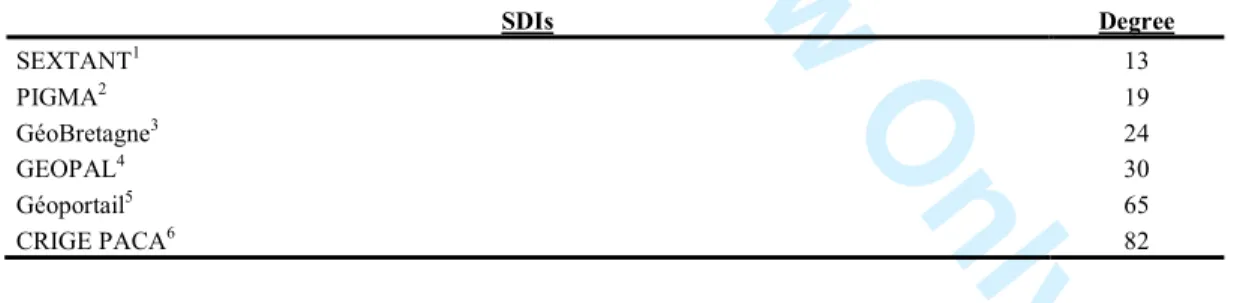
The SNA analysis also characterizes the "multi)SDIs" use, and this both by the graph)based measures previously introduced and by a visual exploration of the graph produced. The degree reveals the most connected nodes (Table 2 and Figure 1).
Table 2. Degree values of the six most connected SDIs in the network
SEXTANT1 13 PIGMA2 19 GéoBretagne3 24 GEOPAL4 30 Géoportail5 65 CRIGE PACA6 82 1 http://sextant.ifremer.fr/ 2 http://www.pigma.org/ 3 http://cms.geobretagne.fr/ 4 http://www.geopal.org/accueil 5 http://www.geoportail.gouv.fr/accueil 6 http://www.crige)paca.org/ 2 3 4 5 6 7 8 9 10 11 12 13 14 15 16 17 18 19 20 21 22 23 24 25 26 27 28 29 30 31 32 33 34 35 36 37 38 39 40 41 42 43 44 45 46 47 48 49 50 51 52 53 54 55 56 57 58 59
For Peer Review Only
The measure of degree identifies the most important SDIs having many coastal users, such as the Geoportail, French national SDI or the CRIGE)PACA, the oldest French regional SDI with a community of more than 1,200 partner organizations.
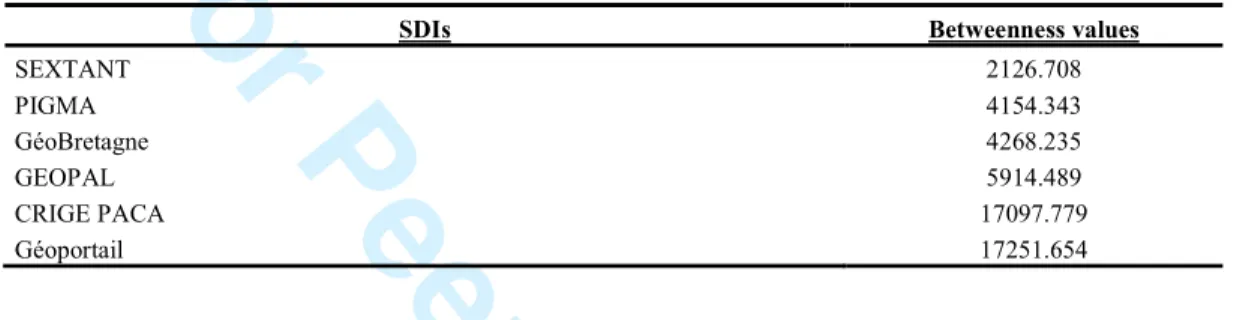
The measure of betweenness (Table 3 and Figure 2) continues the analysis by highlighting SDIs whose users are likely to interact with other SDIs.
Table 3. SDIs with the highest betweeness values
! % , SEXTANT 2126.708 PIGMA 4154.343 GéoBretagne 4268.235 GEOPAL 5914.489 CRIGE PACA 17097.779 Géoportail 17251.654
Some complementarity trends can be observed, for instance between the SDIs Geoportail and CRIGE)PACA as several users are interacting between them. Other complementarity trends can be observed between these important SDIs and SDIs that play a minor role, located at the periphery of the network. Amongst a set of SDIs that play a minor role, let us mention the ones that provide some thematic geographical information (e.g., InfoTerre7, SIT PNR PACA8) or European data (e.g., INSPIRE9).
While the previous measures highlight the important SDIs in the network, the measure of closeness (Table 4 and Figure 3) reveals the SDIs at the periphery of the network, that is, the ones that play a secondary role in the network. In fact these SDIs are connected to a few users, those users being also not very active in the network.
7 http://infoterre.brgm.fr/ 8 http://www.pnrpaca.org/index.php?cont=login 9 http://inspire)geoportal.ec.europa.eu/ 2 3 4 5 6 7 8 9 10 11 12 13 14 15 16 17 18 19 20 21 22 23 24 25 26 27 28 29 30 31 32 33 34 35 36 37 38 39 40 41 42 43 44 45 46 47 48 49 50 51 52 53 54 55 56 57 58 59
For Peer Review Only
Table 4. SDIs with the highest closeness values, INSEE10 7196.000 EuroGeographics11 7330.000 IGECOM 4012 7332.000 SOeS13 7394.000 PRODIGE)Picardie14 7512.000 PRODIGE 971 7576.000 SIG 97215 7582.000
For instance, on the periphery of the graph there is a SDI related to an overseas area (e.g. Martinique for SIG 972), or another one that provides access to information of lesser geographical relevance (e.g. statistical information for SOeS), or another one whose access is restricted to a certain category of users (e.g., public servants for Prodige)Picardie).
In order to further characterize the “multi)SDIs” use, the bipartite graph has been structured by levels (Figure 4). The interest of this multi)level representation is that the respective importance of each institutional level, as well as the SDI territorial levels, can be visually revealed. In particular the prominent role of regional SDIs in the circulation of coastal information can be clearly observed, with 51% of the total number of links. The national SDIs play also an important role with 29% of the total number of links. These links come from users working mainly at regional and national levels.
Last but not least the SNA analysis can also show the specific properties of a given SDI at the micro level as illustrated in Figure 5 for the SDI Geoportail and for the SDI CRIGE)PACA in Figure 6.
10 http://www.insee.fr/fr/ 11 http://www.eurogeographics.org/ 12 https://www.igecom40.fr/ 13 http://www.statistiques.developpement)durable.gouv.fr/ 14 http://www.sigpicardie.fr/catalogue/ 15 http://www.sig972.org/ 2 3 4 5 6 7 8 9 10 11 12 13 14 15 16 17 18 19 20 21 22 23 24 25 26 27 28 29 30 31 32 33 34 35 36 37 38 39 40 41 42 43 44 45 46 47 48 49 50 51 52 53 54 55 56 57 58 59
For Peer Review Only
This local analysis shows notably that the large majority of users (98 %) of the national SDI Géoportail combine others SDIs while just over half of the users (53 %) of the regional SDI CRIGE)PACA interact with other SDIs than CRIGE)PACA.
! $ "
The DFD approach is applied to the interview minutes that describe the professional practices of 30 coastal key)informants interacting with the SDIs identified by the SNA analysis according to the implementation level of the SDI and the professional level of the key)informant. The diagram focuses on the Geoportail and CRIGE)PACA.
The analysis reveals the main actions carried out by the coastal key informants and the noticeable geographical information flows. These actions include (1) access to geographical information ("search/find" flow) and (2) sharing geographical information ("disseminate" flow) (Figure 7).
The DFD approach also identifies a series of additional sources of geographical resources that the coastal key)informants are searching for, while non)accessible via the available SDIS, but necessary to carry out their tasks (Figure 8). These additional sources of geographical informational are mainly obtained from the (1) generation of new information through field observations (“gather” flow) and (2) solicitation of institutional partners involved in the management of the coastal territory. The latter are essentially provided by some informal exchanges ("request / receive" flow) but that sometimes doesn’t succeed ("request" flow).
Finally, the DFD approach also stresses the importance for the key)informants to be involved in working groups implemented by some SDIs (“contribute” and
“disseminate” flows) (Figure 9). These groups are dedicated to certain themes such as "coastal and marines zones", their goals are to ease and enhance the access and the sharing of geographical information at all levels.
2 3 4 5 6 7 8 9 10 11 12 13 14 15 16 17 18 19 20 21 22 23 24 25 26 27 28 29 30 31 32 33 34 35 36 37 38 39 40 41 42 43 44 45 46 47 48 49 50 51 52 53 54 55 56 57 58 59
For Peer Review Only
The groups identified are specific means that favour exchange and cooperation between coastal stakeholders at different territorial levels. They act as communities of practice (Wenger, 1999), and allow the actors to act together for management and planning purposes.
! %& #
Overall the experimental study of coastal stakeholder practices has been developed using a "user)centred" approach as suggested by a series of previous works (Masser, 2005, Nedović)Budić et al., 2008, Sadeghi)Niaraki et al., 2010, Hennig et al., 2013). The analysis and interpretation have been performed thanks to the combination of SNA and DFD modelling methods applied to an online questionnaire and semi)structured interviews. The results reveal a better understanding of the SDIs’ use. The SNA analyses have identified the main SDIs used by coastal stakeholders and the main structural properties that emerge. For instance, the bipartite graph visually presented by institutional levels, highlights the respective roles of the SDIs at each institutional level in the exchange and sharing of geographical information. This multi)SDIs and multi) levels use is structured around several key SDIs (e.g., Geoportail and CRIGE)PACA) whose role is particularly significant, but complemented by a series of ‘minor’ SDIs. This reveals the fact that most users interact with key SDIs while also interacting with SDIs playing a minor role, this combination being necessary for coastal stakeholders acting in specific territories.
The DFD approach reveals the main information flows between the SDIs
identified by the SNA analysis and the role played by the other entities (e.g. institutional partners, working group) involved in the sharing of the geographical information within the framework of French coastal management. The combination of SDIs, information flows and informational resources provide a global view of a given coastal zone, not
2 3 4 5 6 7 8 9 10 11 12 13 14 15 16 17 18 19 20 21 22 23 24 25 26 27 28 29 30 31 32 33 34 35 36 37 38 39 40 41 42 43 44 45 46 47 48 49 50 51 52 53 54 55 56 57 58 59
For Peer Review Only
limited to a straight availability of geographical information. Such information frameworks can be used as public policy instruments to understand, act, communicate and cooperate; the objective being to provide a better support for coastal zones management.However, the results also emphasize the fact that geographical information provided by the coastal community is still scarce. The main reasons given by the coastal actors to explain these difficulties to access and share geographical information are not technological, but social and institutional as emphasized by many authors (Canessa et al., 2007, Wright, 2009, Gourmelon et al., 2010). Whith this in mind, the DFD approach highlights the key role of the working groups implemented by the SDIs by encouraging information flows between the partners. Therefore, members gradually become
"produsers" (Budhathoki et al., 2008) that use, provide and disseminate geographical information via the SDIs. These working groups act as strong catalysts for geographical information flows in the coastal community.
-The objective of the research presented in this paper is to provide an integrated approach for the study of SDIs uses. Amongst the many actors involved in the implementation of the SDIs, users have a special and key position (Omran and van Etten, 2007, Grus et al., 2010, Nedović)Budić et al., 2008, Mäkelä et al., 2010, van Loenen et al., 2010). The in)depth analysis of 28 definitions of SDIs conducted by Hendriks et al. (2012), highlights the significant role played by these users. It clearly appears that a better knowledge of the users’ practices and feedbacks are surely
important factors within the context of the democratization of geographical information (McDougall, 2010), and the emergence of Volunteered Geographic Information
(Goodchild, 2007). 2 3 4 5 6 7 8 9 10 11 12 13 14 15 16 17 18 19 20 21 22 23 24 25 26 27 28 29 30 31 32 33 34 35 36 37 38 39 40 41 42 43 44 45 46 47 48 49 50 51 52 53 54 55 56 57 58 59
For Peer Review Only
Based on the combination of graph)based measures and visual exploration of the SNA approach, different SDI behaviors and complementarities can be observed. In particular, this study shows the multi)SDIs use reported by the respondents. The DFD analysis allows us to analyze the existence (and non)existence) of geographical information flows between the SDIs and additional geographical resources. Thanks to an integration of the multiple territorial levels of both the SDIs implementation and coastal manager interactions, the multi)level framework of the SNA and DFD analysis adds an extra dimension to the study. This favors an analysis of the respective roles played by each institutional level, as well as the information flows between them.
The experimentation also provides some insights for further developments. For instance, the SNA approach can be extended to the temporal domain in order to analyze the evolution of the SDIs uses over time. Indeed, the objective is to repeat the on line survey in 2017, this allowing a comparison of practices and SDIS’ structural properties over time (Knoke and Yang, 2008).
Several mathematical measures have been applied in this paper to reveal some structural network properties. We plan in future work to explore the interest of several additional measures (e.g., information centrality (Stephenson and Zelen, 1989)) as well as additional visual variables for the study of SDIs’ uses. We would like to also explore the way DFD representations can outline the respective roles of the different working groups within a particular coastal community. Amongst several avenues still opened, geographical information flows between SDIs and stakeholders are still to be
categorized and studied. Such flows might be evaluated according to several parameters such frequency of use, level of satisfaction, etc. Finally, the method and formalisms developed should be transferred to other methodological approaches in different contexts at the international level as well as to the terrestrial and marine domains.
2 3 4 5 6 7 8 9 10 11 12 13 14 15 16 17 18 19 20 21 22 23 24 25 26 27 28 29 30 31 32 33 34 35 36 37 38 39 40 41 42 43 44 45 46 47 48 49 50 51 52 53 54 55 56 57 58 59
For Peer Review Only
.
This paper introduces an integrated SNA and DFD approaches for the study of SDI uses within a coastal community. By applying the method and models developed to a wide range of use contexts and various territorial levels (from the local level to the national level), the study reveals the complexity of SDIs uses. In particular, the combination of the SNA and DFD approaches favours a global interpretation of the graphs and diagrams generated, as well as some “micro” analysis.
While the SNA analysis focuses on the characterization of a large set of SDIs used by a broad coastal community, the DFD approach analyses more finely how these SDIs fit into the daily life of coastal managers and how they contribute to coastal zones management. The analytical methods are based on a series of graph)based and graphical analyses, visually enhanced by a multi)level representation that favours an identification of the respective roles played by the different institutional levels and SDI
implementation levels. This integrated strategy and combination of analytical and modelling analyses constitute the fundamentals of a replicable approach that links the macro and micro visions of SDIs’ uses. This in fact generates a sort of global view of a SDI system and also favours a better understanding of the SDIs appropriation in the context of complex multi)actor and multi)level territorial governance.
The proposed methodology can be applied to the study of the roles played by the users involved in third generation SDIs implementations (McDougall, 2010, Hennig et al., 2013) and should contribute to the Multi)View Framework to assess SDI
(Crompvoets et al., 2008). Topic)wise, the methodology allow to assess how the flow of geographic information affects environmental management practices and environmental governance (Mol, 2008). 2 3 4 5 6 7 8 9 10 11 12 13 14 15 16 17 18 19 20 21 22 23 24 25 26 27 28 29 30 31 32 33 34 35 36 37 38 39 40 41 42 43 44 45 46 47 48 49 50 51 52 53 54 55 56 57 58 59
For Peer Review Only
' "
Barabási, A.)L. and Albert, R. 1999. Emergence of scaling in random networks. Science, 286 (5439), 509)512.
Bartlett, D. and Smith, J. 2004. GIS for coastal zone management, London, UK: CRC Press.
Borgatti, S. P. 2005. Centrality and network flow. Social Networks, 27 (1), 55)71. Borgatti, S. P. and Everett, M. G. 1997. Network analysis of 2)mode data. Social
Networks, 19 (3), 243)269.
Borgatti, S. P., Everett, M. G. and Freeman, L. C. 2002. Ucinet for Windows: Software for Social Network Analysis [Online]. Harvard, MA: Analytic Technologies. Available from: https://sites.google.com/site/ucinetsoftware/home.
Brandes, U., Kenis, P. and Raab, J. 2006. Explanation through network visualization. Methodology: European Journal of Research Methods for the Behavioral and Social Sciences, 2 (1), 16)23.
Budhathoki, N., Bruce, B. and Nedovic)Budic, Z. 2008. Reconceptualizing the role of the user of spatial data infrastructure. GeoJournal, 72 (3), 149)160.
Butler, M. J. A., Boudreau, P. R., Leblanc, C. and Baldwin, K. 2011. Spatial Data Infrastructures in Support of Ecosystem Based Management and Ecosystem Approach to Fisheries in the Caribbean. In: FANNING, L., MAHON, R. & MCCONNEY, P., eds. Towards Marine Ecosystem.based Management in the Wider Caribbean. Amsterdam: Amsterdam University Press, 297)306. Canessa, R., Butler, M., Leblanc, C., Stewart, C. and Howes, D. 2007. Spatial
Information Infrastructure for Integrated Coastal and Ocean Management in Canada. Coastal Management, 35 (1), 105)142.
Card, S. K., Mackinlay, J. D. and Shneiderman, B. 1999. Readings in information visualization: using vision to think, San Diego, USA: Academic Press. Crompvoets, J., Bregt, A., Rajabifard, A. and Williamson, I. 2004. Assessing the
worldwide developments of national spatial data clearinghouses. International Journal of Geographical Information Science, 18 (7), 665)689.
Crompvoets, J., Rajabifard, A., Van Loenen, B. and Fernández, T. D. 2008. A Multi. View Framework to Assess Spatial Data Infrastructures [Online]. Australia: The University of Melbourne. Available:
http://www.csdila.unimelb.edu.au/publication/books/mvfasdi.html [Accessed 18 September 2014.
Freeman, L. C. 1978. Centrality in social networks conceptual clarification. Social Networks, 1 (3), 215)239.
Gillespie, R., Butler, M., Anderson, N., Kucera, H. and Leblanc, C. 2000. MGDI: An information infrastructure to support integrated coastal management in Canada. GeoCoast, 1 (1), 15)24.
Goodchild, M. F. 2007. Citizens as sensors: the world of volunteered geography. GeoJournal, 69 (4), 211)221.
Gourmelon, F., Robin, M., Maanan, M., Georis)Creuseveau, J., Pennober, G., Simao Da Silva, A., Fattal, P., Zourarah, B., Affian, K. and Hauhouaut, C. 2010.
Geographic Information System for Integrated Coastal Zone Management in Developing countries: cases studies in Mauritania, Côte d'Ivoire, Guinea)Bissau and Morocco. In: MAANAN, M. & ROBIN, M., eds. Geomatic solutions for Coastal Environments. New York, USA: Nova Science Publishers, 347)359
2 3 4 5 6 7 8 9 10 11 12 13 14 15 16 17 18 19 20 21 22 23 24 25 26 27 28 29 30 31 32 33 34 35 36 37 38 39 40 41 42 43 44 45 46 47 48 49 50 51 52 53 54 55 56 57 58 59
For Peer Review Only
Grus, L., Crompvoets, J. and Bregt, A. 2010. Spatial data infrastructures as complex adaptive systems. International Journal of Geographical Information Science, 24 (3), 439)463.
Hanneman, R. A. and Riddle, M. 2005. Introduction to social network methods [Online]. University of California. Available from:
http://faculty.ucr.edu/~hanneman/nettext/ [Accessed 2 September 2014]. Hendriks, P. H. J., Dessers, E. and Van Hootegem, G. 2012. Reconsidering the
definition of a spatial data infrastructure. International Journal of Geographical Information Science, 26 (8), 1479)1494.
Hennig, S., Gryl, I. and Vogler, R. 2013. Spatial data infrastructures, spatially enabled society and the need for society’s education to leverage spatial data.
international Journal of Spatial Data Infrastructures Research, 8 98)127. Huisman, M. and Van Duijn, M. a. J. 2005. Software for social network analysis.
Models and methods in social network analysis, 270)316.
Knoke, D. and Yang, S. 2008. Social network analysis, Thousand Oaks, USA: Sage. Li, Q. and Chen, Y.)L. 2009. Data Flow Diagram. In: LI, Q. & CHEN, Y.)H., eds.
Modeling and Analysis of Enterprise and Information Systems. Berlin, Germany: Springer, 85)97.
Mäkelä, J., Vaniala, R. and Ahonen)Rainio, P. 2010. Competence management within organisations as an approach to enhancing GIS maturity. International Journal of Spatial Data Infrastructures Research, 5 267)285.
Masser, I. 2005. GIS worlds: creating spatial data infrastructures, Redlands, USA: ESRI press.
Masser, I. 2010. Building European spatial data infrastructures, Redlands, USA: ESRI Press.
Mcdougall, K. From silos to networks)will users drive spatial data infrastructures in the future? 24th FIG International Congress (FIG 2010), 2010. International Federation of Surveyors (FIG), 13.
Mol, A. P. 2008. Environmental reform in the information age, Cambridge, UK: Cambridge University Press.
Mylopoulos, J. 1998. Information modeling in the time of the revolution. Information Systems, 23 (3–4), 127)155.
Nedović)Budić, Z., Pinto, J. K. and Budhathoki, N. R. 2008. SDI effectiveness from the user perspective. In: CROMPVOETS, J., RAJABIFARD, A., VAN LOENEN, B. & DELGADO FERNÁNDEZ, T., eds. A Multi.View Framework to Assess SDIs. Australia: The University of Melbourne, 273)304.
Newman, M. E. J. 2003. The Structure and Function of Complex Networks. SIAM Review, 45 (2), 167)256.
Omran, E. E. and Van Etten, J. 2007. Spatial‐Data Sharing: Applying Social‐Network Analysis to study individual and collective behaviour. International Journal of Geographical Information Science, 21 (6), 699)714.
Rajabifard, A., Binns, A., Masser, I. and Williamson, I. 2006. The role of sub‐national government and the private sector in future spatial data infrastructures.
International Journal of Geographical Information Science, 20 (7), 727)741. Rajabifard, A., Feeney, M.)E. and Williamson, I. P. 2002. Future directions for SDI
development. International Journal of Applied Earth Observation and Geoinformation, 4 (1), 11)22.
Sabidussi, G. 1966. The centrality index of a graph. Psychometrika, 31 (4), 581)603. Sadeghi)Niaraki, A., Rajabifard, A., Kim, K. and Seo, J. Ontology Based SDI to
Facilitate Spatially Enabled Society. GSDI, 2010 St. Ausustine, Trinidad 10.
2 3 4 5 6 7 8 9 10 11 12 13 14 15 16 17 18 19 20 21 22 23 24 25 26 27 28 29 30 31 32 33 34 35 36 37 38 39 40 41 42 43 44 45 46 47 48 49 50 51 52 53 54 55 56 57 58 59
For Peer Review Only
Sale, P. F., Butler, M., Hooten, A., Kritzer, J., Lindeman, K., Sadovy, Y., Steneck, R. and Van Lavieren, H. 2008. Stemming decline of the coastal ocean: rethinking environmental management [Online]. United Nations University (UNU) INWEH). Available from:
http://www.inweh.unu.edu/Coastal/Publications/Stemmingdecline.pdf [Accessed 10 January 2015].
Scott, J. 2000. Social network analysis: a handbook, Thousands Oaks, USA: Sage. Shelly, G. and Rosenblatt, H. J. 2009. Systems analysis and design, Boston, USA:
Cengage Learning.
Stephenson, K. and Zelen, M. 1989. Rethinking centrality: Methods and examples. Social Networks, 11 (1), 1)37.
Tremblay, M.)A. 1957. The Key Informant Technique: A Nonethnographic Application. American Anthropologist, 59 (4), 688)701.
Tukey, J. W. 1977. Exploratory data analysis, Reading, USA: Addison)Wisley Publishing.
Van Loenen, B., Crompvoets, J. and Poplin, A. Assessing geoportals from a user perspective. GeoValue Workshop, 2010 Hamburg, Germany. 29)38.
Vandenbroucke, D. 2011. INSPIRE & NSDI State of Play: D3.2 . Detailed survey on use and usability [Online]. K.U.Leuven. Available from:
http://inspire.ec.europa.eu/reports/stateofplay2011/INSPIRE_NSDI_SoP_) _D_3_2_)_Result_Detailed_Survey_Year_2)_v3.1.pdf [Accessed 4 November 2014].
Vandenbroucke, D. and Biliouris, D. 2011. Spatial Data Infrastructures in France: State of play 2011 [Online]. Available from:
http://inspire.ec.europa.eu/reports/stateofplay2011/rcr11FRv102.pdf [Accessed 2 February 2015].
Vandenbroucke, D., Crompvoets, J., Vancauwenberghe, G., Dessers, E. and Van Orshoven, J. 2009. A Network Perspective on Spatial Data Infrastructures: Application to the Sub)national SDI of Flanders (Belgium). Transactions in GIS, 13 (s1), 105)122.
Wasserman, S. and Faust, K. 1994. Social network analysis: Methods and applications, Cambridge, UK: Cambridge University Press.
Wenger, E. 1999. Communities of practice: Learning, meaning, and identity: Cambridge University Press.
Whitten, J. L. and Bentley, L. 2005. Systems analysis and design methods, Boston, USA: McGraw)Hill.
Williamson, I. P., Rajabifard, A. and Feeney, M.)E. 2003. Developing spatial data infrastructures: from concept to reality, London, UK: Taylor & Francis. Wright, D. J. 2009. Spatial Data Infrastructures for Coastal Environments. In: YANG,
X., ed. Remote Sensing and Geospatial Technologies for Coastal Ecosystem Assessment and Management. Berlin, Germany: Springer, 91)112.
Yourdon, E. and Constantine, L. L. 1979. Structured design: Fundamentals of a discipline of computer program and systems design, Englewood Cliffs, USA: Prentice)Hall. 2 3 4 5 6 7 8 9 10 11 12 13 14 15 16 17 18 19 20 21 22 23 24 25 26 27 28 29 30 31 32 33 34 35 36 37 38 39 40 41 42 43 44 45 46 47 48 49 50 51 52 53 54 55 56 57 58 59
For Peer Review Only
#
Figure 1. Degree graph (Nuser=196, NSDI = 80, Narc =403 Figure 2. Betweenness graph (Nuser=196, NSDI = 80, Narc =403) Figure 3. Closeness graph (Nuser=196, NSDI = 80, Narc =403
Figure 4. Original bipartite graph structured by levels (Nuser=196, NSDI = 80, Narc =403)
Figure 5. Graph of the Geoportail users (Nuser=65, NSDI = 58, Narc =208) Figure 6. Graph of the CRIGE)PACA users (Nuser=82, NSDI = 50, Narc =186) Figure 7. DFD Diagram: actions)based information flows
Figure 8. DFD Diagram: additional sources information flows Figure 9. DFD Diagram: working groups information flows
2 3 4 5 6 7 8 9 10 11 12 13 14 15 16 17 18 19 20 21 22 23 24 25 26 27 28 29 30 31 32 33 34 35 36 37 38 39 40 41 42 43 44 45 46 47 48 49 50 51 52 53 54 55 56 57 58 59
For Peer Review Only
! 2 3 4 5 6 7 8 9 10 11 12 13 14 15 16 17 18 19 20 21 22 23 24 25 26 27 28 29 30 31 32 33 34 35 36 37 38 39 40 41 42 43 44 45 46 47 48 49 50 51 52 53 54 55 56 57 58 59For Peer Review Only
! " # $$ # % ! 2 3 4 5 6 7 8 9 10 11 12 13 14 15 16 17 18 19 20 21 22 23 24 25 26 27 28 29 30 31 32 33 34 35 36 37 38 39 40 41 42 43 44 45 46 47 48 49 50 51 52 53 54 55 56 57 58 59For Peer Review Only
! " ! ## " $ % 2 3 4 5 6 7 8 9 10 11 12 13 14 15 16 17 18 19 20 21 22 23 24 25 26 27 28 29 30 31 32 33 34 35 36 37 38 39 40 41 42 43 44 45 46 47 48 49 50 51 52 53 54 55 56 57 58 59For Peer Review Only
!" "#$ "%&' (( % ) $ 2 3 4 5 6 7 8 9 10 11 12 13 14 15 16 17 18 19 20 21 22 23 24 25 26 27 28 29 30 31 32 33 34 35 36 37 38 39 40 41 42 43 44 45 46 47 48 49 50 51 52 53 54 55 56 57 58 59For Peer Review Only
! " #$$ ! " ! % 2 3 4 5 6 7 8 9 10 11 12 13 14 15 16 17 18 19 20 21 22 23 24 25 26 27 28 29 30 31 32 33 34 35 36 37 38 39 40 41 42 43 44 45 46 47 48 49 50 51 52 53 54 55 56 57 58 59For Peer Review Only
!" # $ % $&"'$" (( & ' & %
2 3 4 5 6 7 8 9 10 11 12 13 14 15 16 17 18 19 20 21 22 23 24 25 26 27 28 29 30 31 32 33 34 35 36 37 38 39 40 41 42 43 44 45 46 47 48 49 50 51 52 53 54 55 56 57 58 59