Is the Long-Run Performance of Cross-Listed Firms Anomalous?
36
0
0
Texte intégral
(2) CIRANO Le CIRANO est un organisme sans but lucratif constitué en vertu de la Loi des compagnies du Québec. Le financement de son infrastructure et de ses activités de recherche provient des cotisations de ses organisations-membres, d’une subvention d’infrastructure du Ministère du Développement économique et régional et de la Recherche, de même que des subventions et mandats obtenus par ses équipes de recherche. CIRANO is a private non-profit organization incorporated under the Québec Companies Act. Its infrastructure and research activities are funded through fees paid by member organizations, an infrastructure grant from the Ministère du Développement économique et régional et de la Recherche, and grants and research mandates obtained by its research teams.. Les partenaires du CIRANO Partenaire majeur Ministère du Développement économique, de l’Innovation et de l’Exportation Partenaires corporatifs Alcan inc. Banque de développement du Canada Banque du Canada Banque Laurentienne du Canada Banque Nationale du Canada Banque Royale du Canada Banque Scotia Bell Canada BMO Groupe financier Bourse de Montréal Caisse de dépôt et placement du Québec DMR Conseil Fédération des caisses Desjardins du Québec Gaz de France Gaz Métro Hydro-Québec Industrie Canada Investissements PSP Ministère des Finances du Québec Raymond Chabot Grant Thornton State Street Global Advisors Transat A.T. Ville de Montréal Partenaires universitaires École Polytechnique de Montréal HEC Montréal McGill University Université Concordia Université de Montréal Université de Sherbrooke Université du Québec Université du Québec à Montréal Université Laval Le CIRANO collabore avec de nombreux centres et chaires de recherche universitaires dont on peut consulter la liste sur son site web Les cahiers de la série scientifique (CS) visent à rendre accessibles des résultats de recherche effectuée au CIRANO afin de susciter échanges et commentaires. Ces cahiers sont écrits dans le style des publications scientifiques. Les idées et les opinions émises sont sous l’unique responsabilité des auteurs et ne représentent pas nécessairement les positions du CIRANO ou de ses partenaires. This paper presents research carried out at CIRANO and aims at encouraging discussion and comment. The observations and viewpoints expressed are the sole responsibility of the authors. They do not necessarily represent positions of CIRANO or its partners.. ISSN 1198-8177. Partenaire financier.
(3) Is the Long-Run Performance of Cross-Listed Firms Anomalous? Cécile Carpentier, Jean-François L’Her and Jean-Marc Suret ∗. Résumé / Abstract Selon les études antérieures, le rendement à long terme des titres qui s’inscrivent aux États-Unis (qui s’interlistent) est anormalement faible. Nous réexaminons ces résultats, qu’il est difficile de concilier avec les avantages procurés par cette opération et qui ne permettent pas d’expliquer le grand nombre d’interlistages observé récemment. Nous étudions la population des sociétés ouvertes canadiennes qui se sont inscrites aux États-Unis entre 1990 et 2005, en utilisant différentes méthodologies et indices. Une attention particulière est également portée aux désincriptions. En utilisant des méthodologies robustes, nous n’observons aucune performance anormale suite à l’interlistage des sociétés canadiennes. Nos résultats indiquent que les résultats antérieurs de sous performance à long terme pourraient provenir d’une combinaison de choix méthodologique et de biais de sélection et de survie. Mots-clés: interlistage international, performance anormale, méthodes en temps évènementiel, méthodes en temps calendaire, modèle d’évaluation des actifs international. We re-examine previous evidence of long-run underperformance of newly cross-listed firms. The seresults cannot be reconciled with the numerous advantages provided by cross-listing or with the large number of new overseas listings recently observed. We analyze the whole population of Canadian firms that listed in the U.S. from 1990 to 2005, using several methodologies and indexes. Cross-delisting companies receive particular attention. Using robust methodologies, we do not observe any abnormal performance following cross-listing of Canadian firms. Our results indicate that the previous assumption of long-run underperformance can be traced to a combination of methodological choices, sample selection and survival biases. Keywords: international cross-listing, abnormal performance, event-time methods, calendar-time methods, international asset pricing model. Codes JEL : F30, G14, G15. ∗. Cécile Carpentier is from Laval University, email: Cecile.carpentier@fsa.ulaval.ca, Jean-François L’Her is from La Caisse de dépôt et placement du Québec, e-mail: jlher@lacaisse.com; Jean-Marc Suret (corresponding author) is from Laval University, Faculty of Administrative Science, School of Accountancy, 6226 Pavilion Palasis-Prince, G1K 7P4, Québec, Canada, phone: (418) 656 7134, fax: (418) 656 7746, email: Jean-marc.suret@fsa.ulaval.ca. The authors assume full responsibility for any errors remaining in the text. The views expressed in this article are those of the authors, and do not necessarily reflect the position of the Caisse de dépôt et placement du Québec. The authors thank Michel Levasseur and Assoé Kodjovi for their helpful comments on previous versions of this paper. Remaining errors are ours..
(4) Is the Long-Run Performance of Cross-Listed Firms Anomalous?. Companies list abroad to benefit from better visibility (Baker et al., 2002), to improve their stock liquidity (Karolyi, 1998) or to reduce their cost of capital when markets are segmented (Hail and Leuz, 2006). The decision to list abroad may also be motivated by a certification effect (Coffee, 2002). These arguments may explain why the cross-listing announcement is generally associated with positive abnormal returns (Doukas and Switzer, 2000). Such reactions are consistent with the managers’ positive perception of cross-listing (Houston and Jones, 1999, 2002) and with the dramatic increase in cross-listing over the past 20 years (Burns et al., 2007). Gozzi et al. (2007). note that between 1989 and 2000, almost 2,300 firms with market capitalization of over US$8 trillion cross-listed. This surge in cross-listing seems difficult to reconcile with the recurrent observation of long-run underperformance of newly interlisted stocks. There is worldwide (Foerster and Karolyi, 1999; Errunza and Miller, 2000; Sarkissian and Schill, 2005) and country-specific (Faff et al., 2002; Ahmed et al., 2006) evidence of a strong rally before the cross-listing announcement, and of a significant aftermarket underperformance, ranging from -10 to -40 per cent. In Canada, Mittoo (2003) reports that newly cross-listed firms underperform indexes over the three years after the listing, a result consistent with Alexander et al. (1988). Whereas the abnormal long-run performance is generally associated with a decrease in the cost of capital (Foerster and Karolyi, 1999; Errunza and Miller, 2000), several authors have questioned this explanation. As Karolyi (2006) underscores, it is striking “that Canadian firms experience a dramatic long-run capital market reaction to U.S. listings (...) given the longstanding evidence of North American equity market integration” (p. 114). Doidge et al. (2004, p. 208) wrote that “the hypothesis that firms list to achieve a lower cost of capital based on risk sharing with nonresident investors faces a number of difficulties”. A second explanation can be the progressive reduction in the cross-listing premium (Doidge et al., 2007). However, as evidenced by Gozzi et al. (2007), the decrease in Tobin’s q following cross-listing is mainly driven by the increase in total assets after internationalization, while the market capitalization remains high. Indeed, the. 1.
(5) observation of a significant long-run underperformance following listing of Canadian firms in the U.S. warrants re-examination. We follow the path forged by the numerous researchers that re-examine the long-run underperformance following significant corporate events, and show the significant influence of the methodological choices intended to detect stock price abnormal performance on previous empirical conclusions.1 Brav et al. (2000) and Eckbo et al. (2007) offer good examples of this research avenue in the equity offerings area. In the particular case of newly cross-listed companies, the following arguments reinforce the justification of analysis of underperformance. First, the evidence of this phenomenon is scarce and limited to a few papers. Second, for the Canadian case, evidence relies on limited sub-samples of the population of newly cross-listed companies; some categories of which have been omitted for several reasons, creating possible selection and survival biases. Finally, most previous studies use cumulative abnormal returns, which present several weaknesses in the analysis of long-run performance. Below, we thoroughly re-examine the long-run stock price performance of Canadian U.S. crosslisted firms. We focus on the Canadian stock market, because Canada has the world’s largest number of securities listed abroad (Karolyi, 2006). Several Canadian-based corporations post high transaction volumes on American stock markets. Moreover, all Canadian stocks trade in the U.S. as ordinary shares and not as American Depositary Receipts (ADRs), which eliminates the need to control for the way sample stocks are listed in the U.S. We contribute to the debate on cross-listing in three ways. First, we conduct an in-depth analysis of the entire population of Canadian firms that cross-list in the U.S. from 1990 to 2005. We include and analyze in depth firms that cease to be considered as cross-listed, due to merger/acquisition, delisting or cross-delisting. Thus, we obtain a much larger sample than previous studies, free of sample selection and survival biases. Second, we examine event-time results to allow comparison with previous studies and focus on calendar-time results. We estimate the long-run performance of cross-listed firms through the alphas of Fama and French (1993)’s three-factor pricing model (TFPM). We examine a domestic version and two international versions of the TFPM. We also use equally- and value-weighted schemes, and WLS. 1. See Sarkissian and Schill (2007) for a comparison of these two literatures and of their results.. 2.
(6) estimations. Third, we scrutinize the robustness of the results along purged factors, OLS estimation and cross-sectional patterns. We confirm the strong rally before the cross-listing of Canadian firms in the U.S. markets. However, previous evidence of a significant aftermarket underperformance of newly listed Canadian companies proves to be less robust when rigorous methodologies are applied. Equallyweighted cumulative abnormal returns are not significantly different from zero when appropriate size and book-to-market reference portfolios are used. All alphas estimated through a domestic or an international version of the TFPM are not significantly different from zero. We then refute the observation of a long-run underperformance of newly cross-listed Canadian stocks and suggest a solution for the puzzle underscored in previous research. The paper proceeds as follows: Section I presents the literature, the hypothesis and potential explanations for the puzzling long-run underperformance evidenced by empirical studies. Section II discusses data sources, presents data relative to cross-listing and cross-delisting, and the circumstances under which the latter occurs. Section III is devoted to the re-examination of previous results, using event-time methods. Sections IV and V present the abnormal performance of calendar-time portfolios of newly cross-listed firms using domestic and international versions of the three-factor pricing model. Section VI discusses the robustness of our results and Section VII concludes. I. BACKGROUND LITERATURE AND HYPOTHESIS A. T HE B ENEFITS OF C ROSS -L ISTING According to Baker et al. (2002), NYSE listings are associated with a strong increase in visibility, estimated by news coverage and analyst following. In the same vein, Lang, Lins and Miller (2003) show that cross-listing improves the informational environment of firms, which, in turn, increases stock’s value: cross-listed firms arouse an increased interest from financial analysts and tend to have lower earnings forecasts errors. The investors’ recognition hypothesis derives from Merton’s (1987) proposition relative to incomplete information. Cross-listing reduces the shadow cost of incomplete information in the host country, and allows an increase in the shareholder base. Foerster and Karolyi (1999) estimate this increase at 28.8% after ADR. 3.
(7) listing. Moreover, cross-listing is generally associated with an increase in trading volume and liquidity. Stulz (1999) and Coffee (2002) argue that by cross-listing, firms are able to enhance investor protection by ‘‘bonding’’ to the U.S. legal and regulatory regimes, and, as a result, reduce agency costs. Reese and Weisbach (2002) and Doidge et al. (2004) provide evidence broadly consistent with the legal bonding hypothesis. The argument of risk reduction has been taken up by several researchers. As Hail and Leuz (2006) maintain, if a country’s capital market is not fully integrated with international capital markets, firms face a higher cost of capital because risk is mostly borne by investors from this country. Cross-listings make it easier for foreign investors to hold shares in these firms and, as a consequence, risk is more widely shared. Thus, cross-listed firms should have a lower cost of capital. Accordingly, both risk levels and cost of capital should decrease after cross-listing. This reduction, together with increased growth opportunities, decreasing agency costs and an improvement in firms’ ability to take advantage of growth opportunities, can explain why foreign companies listed in the U.S. are worth more than non-interlisted firms (Doidge et al., 2004). Managers seem to be aware of these advantages of cross-listing. Studies based on interviews with managers, CEOs and CFOs found that the most important reason for interlisting is increased access to capital, but they also cite the increase in liquidity, institutional investment, analysts’ coverage and lower cost of capital (Mittoo, 1992; Foerster et al., 1999; Houston and Jones, 2002). Further, cross-listing induces additional costs. Stringent disclosure requirements can represent an impediment to cross-border listing for firms based in countries with very different legal and accounting environments (e.g. emerging markets vs. the U.S.), but to a much lesser degree for Canadian firms. Interlisting of Canadian corporations has been facilitated by the implementation of the Multijurisdictional Disclosure System (MJDS) in 1991, which allows Canadian issuers to meet their U.S. filing requirements using Canadian disclosure documents.2 The only supplementary costs that a cross-listed company incurs are the reconciliation of financial statements with U.S. GAAP and the listing fees on the foreign market. From theoretical and managers’ standpoints, cross-listing in the U.S. can be considered by Canadian firms as a strategic corporate event that can increase shareholders’ wealth, at a minimal. 2. Canadian issuers can use MJDS forms to offer securities publicly in the U.S. based on a Canadian prospectus that is subject to review only by Canadian securities regulators. 4.
(8) cost. This can explain why 400 Canadian companies announced that they listed abroad from 1990 to 2005. The positive consequences of these advantages of cross-listing should be anticipated by investors, and likely produce a pre-listing run-up. However, the effect of these advantages of cross-listing on long-run returns is less clear cut. B. T HE L ONG -R UN P ERFORMANCE OF C ROSS -L ISTING Karolyi (1998), quoting several sources, reports a risk-adjusted decline in stock’s value of 12%– 19% in the year following cross-listing.3 According to Foerster and Karolyi (1999), who study 153 ADR and ordinary cross-listings from 1976 to 1992, the listing firms incur a loss of 14 % (22.3% for the 67 Canadian firms) during the year following the announcement, and the local post-listing beta drops significantly. Errunza and Miller (2000) use a sample of 126 ADR firms in 32 countries, and document a 42% decrease in the cost of capital during the 36 months following the listing. Sarkissian and Schill (2007) use an extensive sample of 1,676 overseas listings in 25 countries by 1,130 firms in 42 countries. They observe a negative adjusted return of -9.66% during the 5 years following the listing, and a non-significant abnormal return during years 5 to 10 (Table 4, Panel B). Each of these studies documents a significant run-up before cross-listing. Alexander et al. (1988) examine the impact of listing for 34 foreign stocks (13 of which were Canadian) in the U.S. during the 1969-1982 period. They find significantly negative post-listing returns, which are less pronounced for the Canadian subsample. More recently, Foerster and Karolyi (1993) found annualized excess returns of over 23% for the 100 days before listing and negative post-listing performance for 53 Toronto Stock Exchange (TSE) stocks that interlisted in the U.S. Finally, Mittoo (2003) analyzes 71 Canadian companies that cross-list from 1991 to 1998. She observes a strong and significant abnormal return of -28.45 % to -13% during the three years following the listing whether she uses en equally- or a value-weighted benchmark. The long-run performance of newly cross-listed firms is generally associated with a decrease in the cost of capital, under the argument that ex-post return is, on average, equal to the expected return (Errunza and Miller, 2000 p. 579). Whereas abnormal returns in the range of -10 to -14 % for a year (depending on the studies) can hardly be explained by a reduction in risk and cost of 3. See Karolyi (1998) and Foerster and Karolyi (1993) for a review of the ‘80s studies.. 5.
(9) capital alone, several authors have questioned this explanation. First, as Hail and Leuz (2006) and Sarkissian and Schill (2006) point out, cross-listings are major corporate events, making it particularly difficult to obtain equilibrium estimates for expected returns. Second, studies based on alternative methods of cost of capital estimation report lower and more reasonable decreases following cross-listing. Using implicit cost of capital estimates based on earnings forecasts, Hail and Leuz (2006) report an average reduction in the cost of capital of between 70 and 120 basis points. This estimation is in line with Koedijk and van Dijk (2004), who find that asset pricing models yield a significantly different estimate of the cost of capital for only 12% of the crosslisted companies examined, and a difference in cost of capital of around 50 basis points for listing in the U.S. and 80 basis points for listing in the U.K.. Third, the cost of capital reduction argument is grounded in the segmentation between markets, although the Canadian and American markets seem to be progressively integrating. Finally, the evidence of a significant negative performance of cross-listed firms is hard to reconcile with either the advantages of this operation or with the numerous cross-listing decisions that have been made during the last 20 years. The long-run underperformance of Canadian newly cross-listed firms is a puzzling result, similar to the one that challenges researchers in the area of new issues. Few explanations, other than the cost of capital reduction, have been put forth to solve this puzzle. C. S OLVING THE ‘P UZZLE ’ One explanation posits that intermarket informational linkages, the degree of market segmentation and the complex interface of competition between international markets are important components. Basically, this means that if markets are segmented and not completely transparent, and order flow is lost to the overseas market, then risk increases and market maker confidence is reduced (Domowitz et al., 1998). This explanation hardly fits the Canadian vs. U.S. situation. Karolyi (1998) raises the managerial incentives argument, which predicts that managers will time cross-listing events to coincide with the peak of domestic stock market performance. However, Errunza and Miller’s (2000) results do not support the managerial timing hypothesis in the case of ADR listings. Similarly, Gozzi et al. (2007) suggest that market timing is not the only explanation for the times-series pattern of corporate valuation around cross-listing. Another explanation is that the costs of listing simply outweigh the economic benefits gained from overseas listing and, hence, investors react negatively to cross-listing. In Canada, the MJDS. 6.
(10) strongly reduces the cross-listing costs. Moreover, it is difficult to accept that these costs are not anticipated and can affect the stock’s returns several years after the listing. A parallel research stream has attempted to analyze the effects of cross-listing on firm value, and generally evidences a cross-listing premium: cross-listed firms are worth more than similar noncross-listed stocks (King and Segal, 2005, 2007; Doidge et al. 2004, 2007). As Doidge et al. (2007) assert, U.S. cross-listed firms should be worth more because 1) they can take advantage of growth opportunities that they could not have taken advantage of without a listing and 2) a smaller fraction of the cash flows generated by the firms are appropriated as private benefits by insiders. They contend that the first source of valuation effect does not persist. Accordingly, the cross-listing premium should partially vanish with time. Doidge et al. (2007) show that this premium decreases but is still present three years after the listing. In Canada, King et Segal (2007) demonstrate that cross-listed firms are valued similarly to their U.S. peers, at a premium (of 21% using Tobin’s q) to comparable non-cross-listed Canadian firms. However, King and Segal (2005) show that this premium disappears within two years of cross-listing. If newly crosslisted firms trade at a premium, and if the premium disappears or shrinks during the following years, the post-listing return should be abnormally low. Gozzi et al. (2007) analyze the components of the q ratio around the cross-listings and observe that the market capitalization increases one year before the cross-listing and remains high thereafter. The reduction in q ratio can be traced to the increase in total assets after internationalization. Therefore, the decrease in q ratio does not imply an abnormal negative stock return. Similarly to the case of initial public offerings, we observe long-run underperformance of firms following a perceived value-increasing corporate event. Consistent with numerous authors in the corporate finance field (see Eckbo et al, 2007 for a review), we contend that the measurement problem of long-run performance can explain previous results. They can be also traced to sample selection and survival biases: previous studies generally rely on sub-samples of newly crosslisted firms, due to several constraints in data availability and the high rate of cross-delisting. Second, the puzzle can also be linked to the specific time period covered in previous studies. As evidenced by Foerster and Karolyi (1993), the long-run underperformance seems to have sectorspecific components. While clusters of date and sector exist in the cross-listing activity, some observations can be traced to the composition of the samples during a given time period. Third,. 7.
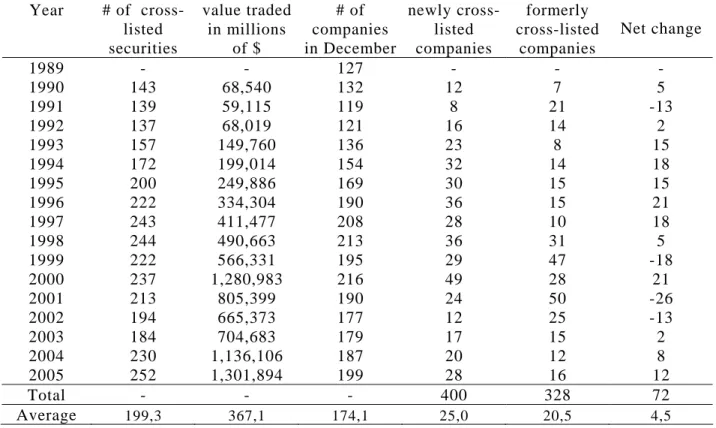
(11) most previous studies estimate long-run performance of cross-listed firms through event-time approaches. These methods indeed suffer from various problems associated with both the measurement of abnormal returns and the specification of tests for non-zero abnormal returns. D H YPOTHESIS AND S TRATEGY Our general hypothesis is that the long-run performance of Canadian cross-listed firms in the U.S. should be normal. We also posit that the conclusion of long-run underperformance reported in previous work can be traced to a combination of methodological choices, sample selection and survival biases. To validate these hypotheses, we follow a three-step procedure. We first replicate Mittoo’s results, using event-time methods, and we analyze the results’ sensitivity to the sample composition, the index and the weighting scheme, and the time period under study. In a second step, we investigate the performance of Canadian interlisted firms using a calendar-time methodology, value-weighted portfolios and a weighted-least squares estimation (WLS). We use one domestic and two international versions of the Fama and French three-factor pricing model. Third, we test the sensitivity of our results to the WLS estimation, purged risk factors, and examine cross-sectional patterns induced by sectors. II. DATA Monthly summaries of cross-listed stocks from January 1990 to December 2005 come from the Interlisted stock section of the monthly editions of the TSX review. For each of the companies listed in the U.S. from 1990 to 2005, and for each month, we collected the volume of transactions in both markets. Monthly data are required because several securities appear to be cross-listed for just a few months. We collected trading volumes to detect situations where a company appears as cross-listed for a few months, but without any trades outside of Canada, or with a proportion of foreign trades in the vicinity of 1% to 2%. Stock market data come from Datastream. A. T RENDS IN C ANADIAN C ROSS -L ISTING Table 1 reports the number of Canadian cross-listed companies and the number of Canadian companies that enter and quit the cross-listed group annually. In December 1989, 127 companies were listed on American exchanges. From 1990 to 2005, 400 companies listed their stocks on one. 8.
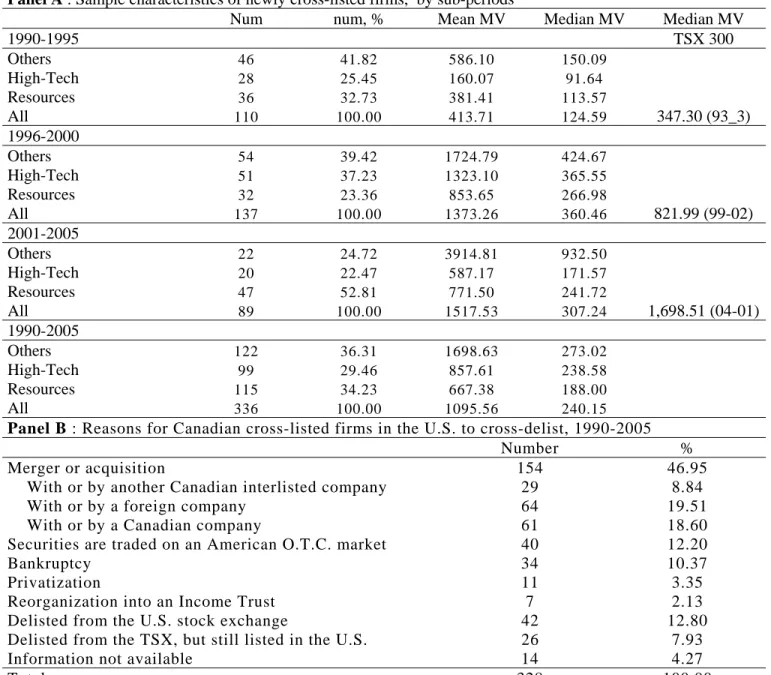
(12) of these markets.4 A total of 328 companies ceased to be considered cross-listed, for various reasons that we analyze below. The “in and out” movements of Canadian firms from the U.S. market are in fact more intensive than indicated by the yearly summaries. On average, since 1990 25 Canadian companies have listed abroad yearly, while 20 disappeared from the cross-listed company summary. In 1999 and 2001, 47 and 50 Canadian companies lost their interlisted status respectively. In 2000 alone, 49 Canadian companies listed abroad. The merger wave of the technological bubble and its subsequent burst are putatively the main explanatory factors of these peaks. However, cross-listing of Canadian firms in the U.S. since 2001 is probably mostly influenced by the strong increase in resource prices. These different environments create conditions that influence the funding needs and listing decisions of Canadian firms. To gain a better understanding of the cross-listing decision, we present, in Table 2, Panel A, the sector distribution of newly cross-listed firms, along three sub-periods. Several companies reported as cross-listed fail to be traded in the U.S. over 12 months; according to the trading volume reported in each country. The majority of them were never traded abroad, and rapidly ceased to be considered as cross-listed. We delete these observations and retain the 336 (out of 400) new cross-listed firms that effectively trade in the U.S. After-1990, Canadian firms that cross-list are medium-sized: 50% exhibit a market capitalization lower than CAN$ 240 million at the time of the U.S. listing. Cross-listed stocks are generally presented as the largest in Canada, but the biggest capitalizations were already listed in the U.S. in 1989. The median capitalization of newly cross-listed firms since 1990 is notably lower than the median size of the firms included in the index reported in Table 2. Over the entire 1990-2005 period, the Resources, Other and High-tech sectors represent around 35%, 35% and 30% of listings respectively. However, these proportions are time-dependent. During the 1990-1995 subperiod, the main contingent (41.82%) of newly cross-listed firms operate in sectors other than high-tech (25.45%) and resources (32.73%). As expected, high-tech cross-listed firms became more numerous from 1996 to 2000, representing 37.23% of observations. Resources largely dominate during the post-2000 period, with 52.81% of the observations. The median market capitalization increases between the first and second sub-periods (from CAN$125 to $360. 4. This number is very close to the total of 399 cross-listings reported by Doidge et al. (2007) for the same years. We do not consider the 40 (7) companies that cross-list on AIM (LSE) from 1990 to 2005. 9.
(13) million) and decreases to CAN$307 million during the last sub-period. This clustering can induce cross-sectional dependence in returns and limits the power of event-time methods. **Insert Table 1 and Table 2 about here** B. T HE R EASONS FOR CROSS - DELISTING Our sample size is much larger than that of samples of Canadian U.S. cross-listed firms used in previous studies. The main reason is the high rate of cross-delisting, which occurs for a variety of reasons that are detailed in Panel B of Table 2. We carefully analyze each of the Canadian firms that cease to be considered as cross-listed between the beginning of 1990 and the end of 2005. We were able to determine the reasons in 314 of the 328 reported cases. The most common reason that companies lose their status of interlisted companies is mergers or acquisitions. We found that 154 (46.95%) of the disappearing companies were acquired by or merged with Canadian or foreign companies. In numerous cases, the acquisition can be considered a positive event for the investors, but some technology firms that cross-listed in 19992000 were subsequently acquired at very low prices. A second group of cross-listed firms delist from the U.S. exchanges. They retreat to Canada (42 cases) or are still O.T.C. traded (40 cases). The motivation for this delisting cannot be clarified in each case, but we observe the following patterns: 1) the proportion of trades in the U.S. is very low, and probably does not justify the burden of the U.S. listing. The median proportion of U.S. trades for these stocks is 1.5%, for the month before the delisting from the U.S., and the average transaction volume is low,5 2) the company fails to comply with NASDAQ requirements, 3) some companies sell their operations in the U.S. or create a subsidiary in charge of these operations, which becomes listed in the U.S. The first observation is consistent with the costbenefit analysis of a foreign listing. When a company fails to attract foreign investors, the costs of the cross-listing outweigh the potential benefits. This observation is in line with the strategic motive for a foreign listing. Globally, the failure to maintain a listing on a major exchange can be seen as a negative event. This concerns 25% of the cases analyzed. A group of 26 companies delist from Canada and trade in the U.S. only (8.28% of cross-delisting cases). This situation can. 10.
(14) generally be considered as a favourable situation for shareholders. The last group comprises companies that disappeared following a bankruptcy (34) or a going private transaction (11 cases). In addition, seven Canadian companies were reorganized into an income trust, and consequently delisted from the U.S. while Income Trust rules limit the number of non-resident stockholders. Approximately 60% of the observations cease to be considered as cross-listed following generally positive events like a merger, moving to the U.S. or a reorganization as an income trust. C. I MPLICATIONS AND S TRATEGY Table 2 and related discussion tend to indicate that cross-listing is time- and sector-dependent. Panel B indicates that a large proportion of newly cross-listed firms disappears or ceases to be considered as cross-listed in the years following their listing on the U.S. market. These companies are likely to be excluded from the lists provided by the U.S. exchanges, which are the common source of data of previous studies. The effect of this bias deserves particular attention. To ease the comparison with Mittoo (2003) and disentangle the sample selection from the period effects, we construct three samples. The restricted sample corresponds approximately to Mittoo’s sample – 100 firms over the 1990-1998 period6, applying the same criteria – we delete stocks that are not followed by the CFMRC database, and keep only stocks that trade during the month of listing and in at least 75% of the 49 months covered by the calculation. The increased sample spans the same time-frame. The only condition applied is that firms be listed in the U.S. during 12 consecutive months. We thus obtain a sample of 179 Canadian cross-listed firms. Finally, the whole sample is composed of the 336 effectively newly cross-listed firms between 1990 and 2005. III. RE-EXAMINATION OF PREVIOUS RESULTS: EVENT-TIME METHODS A. B ENCHMARKS Abnormal returns are differences between the stock returns and those of a benchmark. Accordingly, long-term returns are highly sensitive to the choice of this benchmark. Previous 5. The median transaction volume in this category is less than $650,000 per month while the 10th percentile of the distribution of the average monthly volume for the total population is $612,500. 6 We were unable to obtain a better reconciliation between samples, probably because of the difference between data sources. Mittoo uses the lists provided by the American exchanges. It seems that several companies, reported as cross-listed by the Canadian exchanges, did not appear on these lists. 11.
(15) studies rely either on market index or on matching firms as a benchmark. Value-weighted market indexes have the advantage of availability, but do not take into account the market risk of the studied firms. In Canada, the TSX 300 (now S&P TSX) is a common reference. We use the capped version of this index, except in an initial attempt to replicate previous results7. Mittoo (2003) uses an equally-weighted benchmark, constructed from the CFMRC database, which, on average, comprises 1,500 securities during the period she examines – 1990 to 1999. As the top 100 stocks represent approximately 80% of the value of the value-weighted index, the equallyweighted index is very small-size oriented, and probably not suitable for comparison with the cross-listed Canadian firms. The annualized return difference between the equally-weighted and the value-weighted, 11.37% from 1990 to 2005, can potentially drive abnormal returns. We construct a similar index to ease the comparison. The alternative approach is to benchmark the studied firms with non-event firms that share several firm characteristics. As mentioned by Mittoo, “Ideally, performance of sample firms should be benchmarked with that of control firms matched by industry, book-to-market value, and firm size” (p. 1,659). She uses an industry-matched domestic firm, whereas we use reference portfolios formed continuously on the basis of firm size and book-to-market ratios. To construct the reference portfolios, we extract firms’ book-equity from the Cancorp database and estimate the book-to-market ratios after matching the Datastream and Cancorp databases. To construct the size control portfolio, all Canadian stocks are ranked each month according to their market capitalizations, and we form quintile portfolios. Independently, all stocks are also ranked according to their book-to-market ratios, and five portfolios are formed. The returns of the 25 monthly rebalanced portfolios are calculated as the value-weighted average of the individualfirm monthly returns in each of the size/book-to-market intersections. Each cross-listed firm is then assigned a control portfolio based on its capitalization and book-to-market ratio.. 7. The TSX 300 was a value-weighted portfolio of approximately 275 stocks from 10 industry groups, which present the largest float. In May 1999, the TSX introduced a 10% capped index to avoid the risk of concentration in Nortel Inc., which represented up to 35% of the TSX in September 1999, and a risk contribution of 65%. Almost all Canadian pension plans then adopted the capped index to replace the old non-capped index. 12.
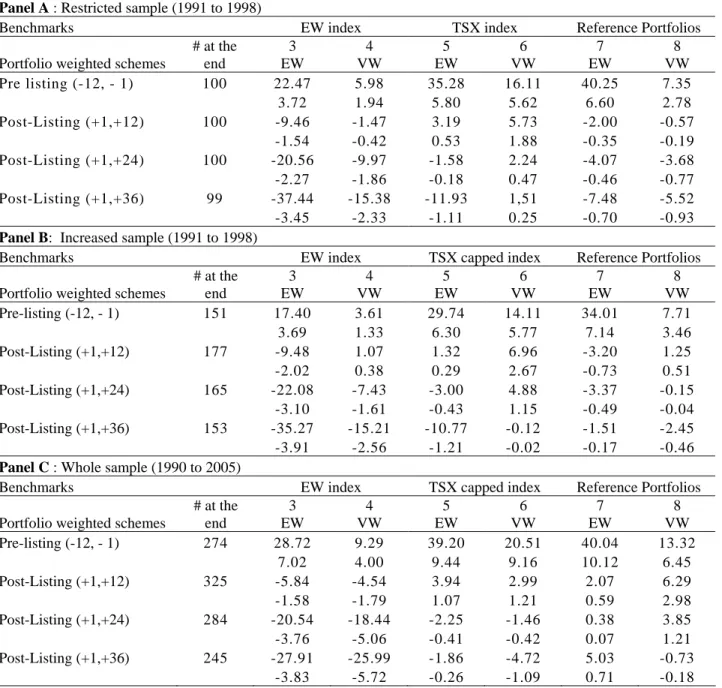
(16) B. R ESULTS Table 3 summarizes CARs obtained on the three samples – restricted sample, increased sample, whole sample – , with the four aforementioned benchmarks – EW, VW, VWC (value-weighted capped) and reference portfolios –, and two portfolio weighted schemes – value-weighted and equally-weighted. Four windows are analyzed: the pre-cross-listing 12-month period, and the post-cross-listing at 12-, 24-, and 36-month periods. In panel A, we essentially replicate the results of previous studies and analyze the effects of alternative benchmarks and portfolio weighting schemes on these results. Panel B is useful for the analysis of the sample bias, while Panel C is based on the comprehensive sample. Columns 3 and 5 in Panel A of Table 3 present CARs comparable to those obtained by Mittoo (2003) for the EW and VW benchmarks with equally-weighted portfolios. We observe a strong and significant rally before the cross-listing, whatever the benchmark (22.47% and 35.28% vs. 29.80% and 40.75% for Mittoo (Table 6), for the EW and VW indexes respectively). Canadian cross-listed firms post a strong underperformance over the 36-month period following the listing when an EW index is used as the benchmark (-37.44 % vs -28.45% for Mittoo, Table 6). When a VW (TSX) index is used, Mittoo reports a -12.77% underperformance; we get a non significant abnormal performance of -11,93 % over the 36-month period following the listing.8 In conclusion, using CARs, VW and EW market indexes and equally-weighted portfolios, we closely replicate previous results. We then examine the robustness of these results to alternative benchmarks and weighted schemes. In columns 4 and 6, we present CARs when portfolios are value-weighted. For each benchmark and pre- or post-listing period examined, we note a strong decrease in abnormal performance relative to the equally-weighted scheme. The underperformance is significant only for the EW benchmark: -15.38% over the three-year horizon following cross-listing. With the VW index the abnormal performance is positive and not significantly different from zero (1.51%). The abnormal long-run underperformance of newly cross-listed companies is thus largely driven by small market capitalization cross-listed firms and totally disappears against a value-weighted benchmark. 8. We use the non-capped index. Using the capped version change the CAR+1,+36 to 12,95%. 13.
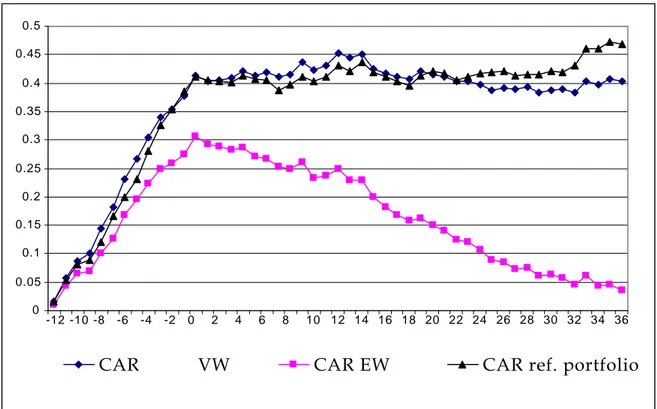
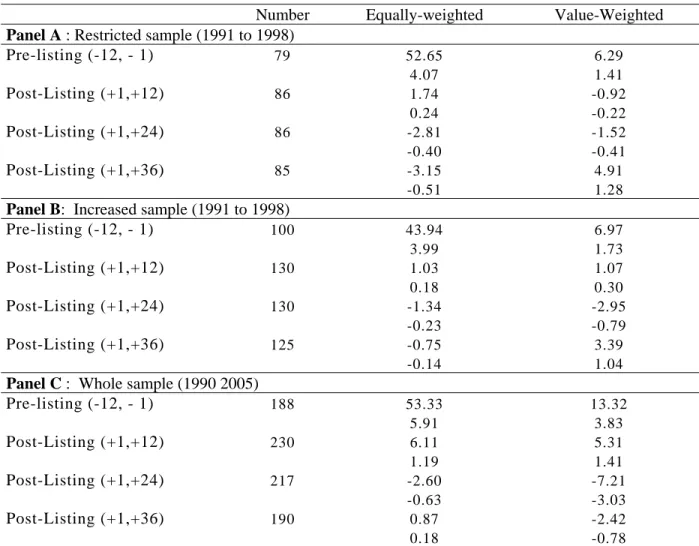
(17) Columns 7 and 8 present the results obtained with reference portfolios that enable us to control for size and growth opportunities. The pre-cross-listing run-up is still significant, but we no longer observe a significant long-run underperformance. By comparison with Panel A, Panel B of Table 3 allows us to assess the effect of sample selection and survival biases on the results. When focusing on reference portfolios, we note that the biases influence the magnitude of abnormal returns. For example, the 36-month CAR falls from -7.48% to -1.51% when all the observations are included in the sample. The bias has a very limited effect when EW or VW benchmarks are used (columns 3 to 6). Panel C of Table 4 presents CARs obtained using the whole sample for the 1990-2005 period. Although we still observe a strong rally before U.S. cross-listing, our results show that the aftermarket underperformance critically depends on the benchmark used. Significant abnormal returns appear only when the equally-weighted benchmark is used. In the two other cases examined, we do not observe a steady and significant decline in performance after U.S. crosslisting: CARs over the following 36-month period go from -4.72% to 5.03%. We even note a significant overperformance when using reference portfolios, and an equally-weighted base. Figure 1 plots CARs from 12 months prior to the effective cross-listing of Canadian firms on a U.S. market, and from the cross-listing to 36 months after listing for the whole sample along the three benchmarks. It clearly illustrates the major effect of the choice of the benchmark on the long-run performance measurement. **Insert Table 3 and Figure 1 about here** Table 4 presents the pre- and post-listing performance of Canadian cross-listed firms using BHARs, size and book-to-market reference portfolios, and equally- and value-weighted schemes. The performance preceding the cross-listing of Canadian firms in the U.S. is significantly positive for the three samples examined when we use an equally-weighted scheme: from 43.94% to 53.33%. The rally is much lower when we use a value-weighted scheme: 6.29% to 13.32%. Canadian firms post a significant underperformance in the 24 months following the cross-listing in only one case: the whole sample, on a value-weighted base. Otherwise, for the 36-month horizon, we cannot rule out the possibility that the aftermarket performance of Canadian crosslisted firms is null. For the whole sample, over the 1990-2005 period, the 3-year abnormal performance is 0.87% and -2.42% for the equally- and value-weighted schemes, respectively. 14.
(18) This first part of our analysis, based on event-time methods, indicates that the evidence of a longrun underperformance of newly Canadian cross-listed stocks is weak. It consistently appears only when the stock’s performance is benchmarked against an equally weighted index, whose return overrides the conventional index by more than 1000 basis points per year during the period under study. When a value-weighted index is used, the underperformance appears only in a sub-period when the cross-listed firms’ portfolio is equally weighted. Thus, small firms strongly influence this result. In such a situation, matching against reference portfolios appears to be the most accurate method, and yields no evidence of long-run underperformance. According Lyon, Barber and Tsai (1999) and Mitchell and Stafford (2000), event-time approaches suffer from various problems associated with both the measurement of abnormal returns and the specification of tests for non-zero abnormal returns. They suffer specifically from a cross-sectional dependence problem inherent in events that occur in waves and within a wave, or cluster by industry. Canadian cross-listing is characterized by periods of hot and cold markets and by industry clustering (Table 1). More importantly, our period of analysis includes the technological bubble, which prompted numerous growth stocks to cross-list (Table 2). These arguments justify the use of calendar time methods. **Insert Table 4 about here** IV. CALENDAR-TIME RESULTS: DOMESTIC TFPM A. M ETHODOLOGICAL C ONSIDERATIONS We estimate abnormal returns through the alphas obtained from the Fama and French TFPM. We construct calendar-time portfolios as follows. A Canadian firm which becomes interlisted in the U.S. stock markets enters our calendar-time portfolio (12 months before its interlisting). For the post 36-month (24-month, 12-month) performance, it is removed from the portfolio after 36 months (24 or 12 respectively). To avoid any survivorship bias, any Canadian interlisted firm that becomes cross-delisted is dropped from the portfolio in the month it is cross-delisted. We then calculate the value-weighted return of our interlisted Canadian firm portfolio. We estimate the following regression for our three samples of Canadian interlisted firms:. 15.
(19) R p ,t − R f ,t = α p + β p ( R m,t − R f ,t ) + s p SMBt + h p HMLt + e p ,t. (3). The dependent variable of the regression is the monthly excess return of the portfolios (Rp,t - Rf,t), which corresponds for a given month, t, to the returns of the portfolio of Canadian interlisted firms (Rp,t) less the risk-free rate (the monthly rate of 91-day Canadian Government Treasury bills, Rf,t). The independent variables are the excess market return and two zero-investment portfolios, which we construct to mimic the risk factors common to all securities. We have constructed SMB and HML in keeping with Fama and French (1993). Stocks are ranked in July based on their size and book-to-market ratio. The stocks are subsequently sorted into two size groups and three book-to-market groups corresponding to our universe breakpoints: the stocks above the 50 percent size breakpoint are designated B (for big) and the remaining 50 percent are designated S (for small); the stocks above the 70 percent book-to-market breakpoint are designated H (for high), the middle 40 percent are designated M and the firms below the 30 percent book-to-market breakpoint are designated L (for low). Six value-weighted portfolios, S/L, S/M, S/H, B/L, B/M and B/H are formed at the intersection of size and book-to-market groups. SMB = ((S/L − B/L)+ (S/M − B/M)+ (S/H − B/H))/3 and HML = ((S/H − S/L) + ( B/H − B/L))/2 .. For the 1990-2005 period, the average annual market, SMB and HML premiums are 7.56%, 5.88% and 7.56% respectively. βp, sp, hp stand for the loadings of the portfolio on each risk factor: the market, SMB (size) and HML (book-to-market ratio). The parameter (α) in equation (1) indicates the monthly average abnormal return of our Canadian cross-listed firm samples. Market and all risk factors and portfolio returns are value-weighted and capped. Since the OLS procedure has a weak capacity to detect abnormal performance because it averages over months of low and heavy event activity, we use a WLS procedure instead. The weights are proportional to the square root of the number of firms present on each calendar month t, such that months with more issues are weighted more heavily. The WLS procedure also deals with potential heteroskedastic residuals induced by calendar clustering. We focus on alphas from factor regressions obtained with value-weighted portfolios and WLS estimations.. 16.
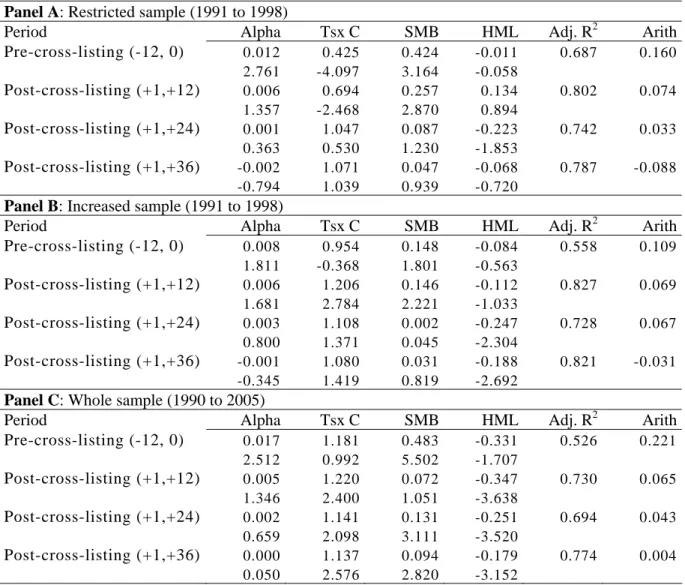
(20) B. R ESULTS Table 5 provides evidence of the pre- and post-listing performance of Canadian cross-listed. firms, regressing calendar-time portfolios - equally- and value-weighted schemes - on the Fama and French three risk factors and using WLS estimations, for the three aforementioned samples. The one-year abnormal performance before cross-listing is positive and highly significant: +22.1% for the whole sample. The run-up is also significantly positive for the restricted sample (+16.0%), and positive and significant at the 10% level for the increased sample (+10.9%). The long-run performance following cross-listing is not significantly different from zero in any of the three samples and three horizons considered. For the more comprehensive sample and the 36-month horizon, the abnormal performance is 0.4%. The comparison of results in Panels A to C of Table 5 allows us to assess the potential effects of sample selection and survival biases and time period on the results of long-run abnormal returns following cross-listing. The biases influence the magnitude of the underperformance over the post-listing three-year period. It ranges from -8.8% for the restricted sample to 0.4% for the whole population. However, no particular abnormal return differs significantly from 0. We restrict the loading discussion to the whole sample results (Panel C). Betas of cross-listed firms do not differ significantly from 1 before the announcement. In line with the argument of risk reduction, we note a slight decrease in betas after the cross-listing. The estimated value for the three-years following the cross-listing is 1.137, which differs from 1 at the conventional level. SMB loadings are generally significantly positive before and after Canadian firms cross-list. Consistent with their median size ($238 million), they are smaller than their domestic counterparts. SMB loadings decrease after the cross-listing. For the whole sample (Panel C), they decline from 0.483 for the year before the cross-listing to 0.094 for the three years following it. Cross-listed firms tend to be relatively larger firms three years after cross-listing, a result in line with the observation that cross-listed firms are generally high growth firms (Claessens and Schmukler, 2007), which use internationalization to increase their asset base (Gozzi et al., 2007). HML loadings are generally negative before and after Canadian firms cross-list. Canadian crosslisted firms thus tend to be more growth-oriented than their domestic counterparts. For the whole. 17.
(21) sample (Panel C) the HML loading is equal to -0.331 (significantly different from zero at the 10% level) before cross-listing and to -0.179 (highly significant) after the listing. The main result of this section is that when we estimate calendar-time performance through the alphas from the Fama and French TFPM, the underperformance following cross-listing vanishes. Our results thus contradict several previous results. This can be traced to three factors: we use a more comprehensive sample, we analyze a different time period and we use different methodologies. In the last section, we examine the sensitivity of our results to alternative specifications and to industry effects. **Insert Table 5 about here** V. CALENDAR-TIME RESULTS: INTERNATIONAL TFPM A. M ETHODOLOGICAL C ONSIDERATIONS. As underscored by Foerster and Karolyi (1999), while several previous studies analyze abnormal returns around cross-listing relative to domestic benchmarks, it is more appropriate to use both domestic and international benchmarks. Foerster and Karolyi use a two-factor international asset pricing model (IAPM): the domestic market excess return and the world market excess return. We use a three-factor IAPM. We estimate abnormal returns through the alphas obtained from two international versions of the TFPM: first a North American version of the TFPM, and second a world version of the TFPM. We estimate the following regression for each calendar-time portfolio: Rp,t − R f ,t = α p + β kp (Rkm,t − R f ,t ) + skp SMBkt + hkp HMLkt + β cp (Rcm,t − R f ,t ) + scp SMBct + hcp HMLct + e p,t (4). with k=us or w standing for US or World and c standing for Canada. The dependent variable of the regression is the monthly excess return of the portfolios (Rp,t - Rf,t), which corresponds for a given month, t, to the returns of the portfolio of Canadian interlisted firms (Rp,t) less the risk-free rate (the monthly rate of 91-day Canadian Government Treasury bills, Rf,t).. 18.
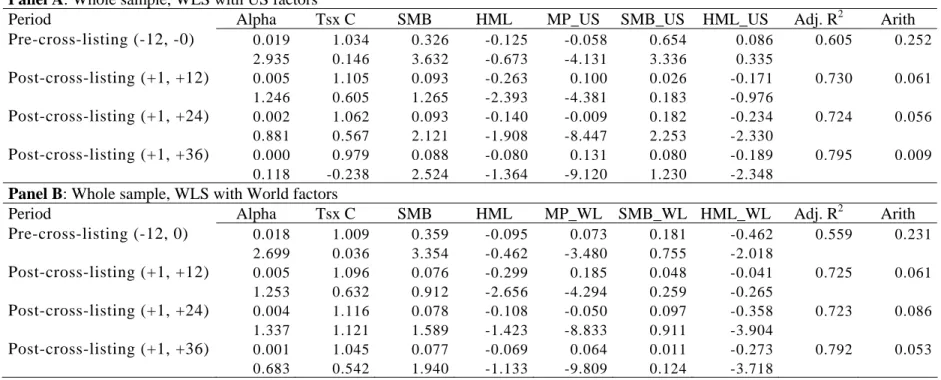
(22) The three first independent variables are the excess U.S. (World ex-Canada) market return and two SMB and HML U.S. (World ex-Canada) zero-investment portfolios. U.S. risk factors come from Kenneth French’s website. We construct global risk factors from stock constituents available on Datastream and Worldscope. We retain all firms with available market capitalization and country affiliation data as well as positive book-to-market equity. All returns are denominated in Canadian hedged returns. We use the value-weighted MSCI world index return as a proxy for the world market return (WRm) and the 91-day U.S. T-bills as a proxy for the riskfree rate (Rf). To construct global risk factors, we apply a country stratification methodology and a value-weighted scheme.9 We first construct risk factors for each country following the Fama and French methodology (1993). To construct the country SMB and HML risk factors, we rank stocks independently according to their market capitalization and book-to-market ratios every end-of-June. The book-to-market ratio used in June of year y is the ratio of the book equity for the last fiscal year end in y-1 divided by the market capitalization in December of year y-1. We subsequently use country weights to construct the global size (SMBw) and the book-to-market equity (HMLw) world risk factors. B. R ESULTS Table 6 provides evidence of the pre- and post-performance of Canadian cross-listed firms in the. U.S. stock markets. Panels A and B present the estimated alphas and the risk loadings (WLS estimation) of value-weighted calendar-time portfolios regressed on the North American and world version of the Fama and French TFPM. First, the pre-cross-listing alpha obtained with the North American version of the TFPM is positive and highly significant, which corroborates the results obtained in previous studies: 25.2% over the 12-month period preceding cross-listing. The same conclusion applies when we estimate the alpha through the world version of the TFPM: 23.1%. Globally, the magnitude of the pre-run-up we estimate is similar to that estimated in previous studies. Second, the post-cross-listing alphas estimated with the North American or the world version of the TFPM are all positive, but not significantly different from zero. The three-year post-cross9. Results do not differ significantly whether we use a country stratification or a no-country stratification, in which all stocks are pooled together. The latter results are available upon request. 19.
(23) listing performances are 0.9% and 5.3% for the North American and world version of the TFPM respectively. This result contrasts with previous empirical evidence of a negative abnormal return. Third, the introduction of a U.S. or world market factor does not significantly modify the magnitude of the systematic risk estimated through the domestic version of the TFPM. The market risk during the pre-cross-listing period is not significantly different from one. Further, for the North American version of the Fama and French TFPM, we observe a decline in the domestic systematic risk after cross-listing: from 1.034 one year before to 0.979 three years after crosslisting. This result is in line with Foerster and Karolyi (1999). However, we do not corroborate this decline when using the world version of the TFPM: the pre- and post-listing domestic betas are 1.009 and 1.045 respectively. Domestic SMB loadings are still positive but slightly lower than with the domestic version of the Fama and French TFPM. They decrease from 0.326 and 0.359 to 0.088 and 0.077 for both international versions of the TFPM. The domestic HML loadings all remain negative but their magnitude is slightly lower than those of the domestic version of the TFPM. They increase slightly before and after cross-listing from -0.125 and -0.095 to -0.08 and -0.069. With the exception of the HML U.S. loading before cross-listing, the U.S. and world SMB and HML loadings follow the same pattern as their domestic counterparts. They are respectively positive and negative, and tend to decrease and increase before and after cross-listing. For the three-year post-cross-listing period, as a consequence of the introduction of the U.S. and world risk factors, the SMB domestic loading remains significant at the 10% level while the U.S. and world SMB loadings are not significant, and the HML domestic loading is no longer significant while the U.S. and world HML loadings are. The use of international versions of the factor models confirms that post-cross-listing returns of Canadian firms could be considered normal. **Insert Table 6 about here**. 20.
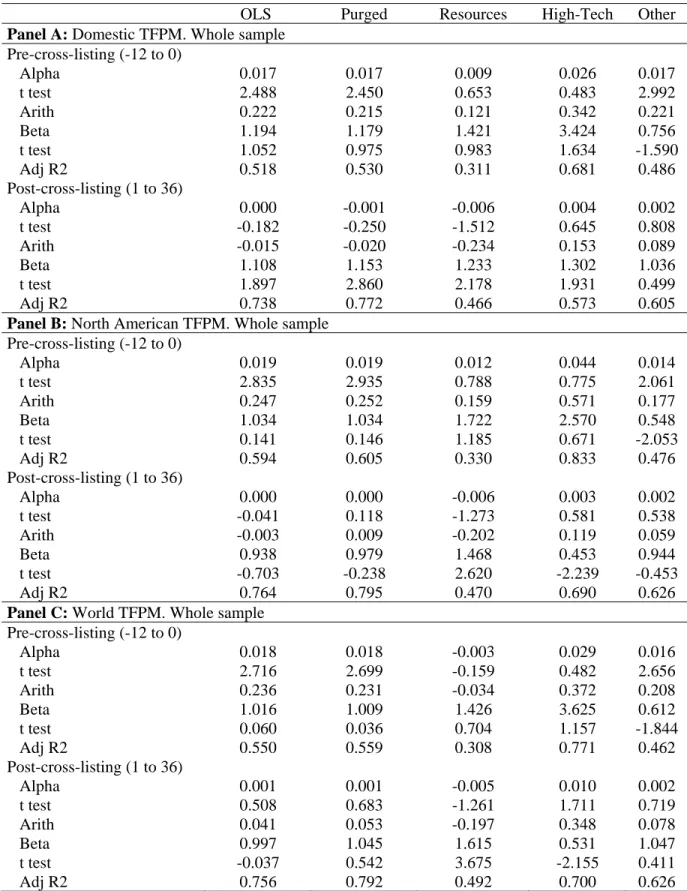
(24) VI ROBUSTNESS TESTS A. P URGED P ORTFOLIOS AND OLS. Following Loughran and Ritter (2000), we estimate purged factors (pSMB, pHML) to improve the power of long-run performance tests for the domestic, U.S. and world versions of the factor model. We eliminate returns from issuing firms over the 36-month post-issue period in order to reduce benchmark contamination. Table 7 shows that using purged risk factors, the annualized alpha coefficient for the 12-month. period preceding the cross-listing of Canadian firms is positive and significant at the 1% level regardless of the model. It ranges from 21.5% for the domestic TFPM to 25.2% for the North American TFPM. The annualized alpha coefficient for the 36-month period following the crosslisting is not significantly different from 0 (from -2% to 5.3%). The loadings on the market and purged risk factors are very similar to those obtained in Table 5 with raw risk factors. For the sake of robustness, we also report performance results obtained with OLS estimations in Table 7. We obtain similar results for the pre- and post-listing performance of Canadian crosslisted firms. Regardless of the version of the factor model, using OLS or purged specifications does not change the results. B. S ECTOR EFFECTS. As evidenced by Foerster and Karolyi (1993), long-run underperformance seems to have sectorspecific components. We thus scrutinize whether there exist cross-sectional patterns of the performance around the cross-listing along the three sectors aforementioned - Resources, HighTech and Other. We report results in the last columns three of Table 7 respectively. The precross-listing run-up is significantly different from 0 only for the Other sectors sub-sample (at the 10% level), and ranges from 17.7% for the North American TFPM to 22.1% for the domestic TFPM. Substantial differences appear between the long-run performance of the three groups. Using the domestic version of the model, the three-year alphas are respectively -23.4%, 15.3% and 8.9% for Resources, High-Tech and Other sectors, but these abnormal performances do not differ 21.
(25) significantly from 0. Such differences between the sectors and the cross-listing clustering can explain the observation that long-run performances appear to be time-sensitive. In all sectors, the pre-listing beta does not differ significantly from 1. In each sector, the beta decreases after the listing in the U.S., and it becomes significantly different from 1 in the resources and High-Tech sectors. The decrease in Beta is particularly clear for high tech companies, from 3.424 to 1.302 (domestic version). Using the U.S. version of the model, we observe a reduction in systematic domestic risk from 2.57 to 0.453. This is in line not only with the argument of risk reduction induced by cross-listing, but also with the observation that cross-listed companies rapidly became more mature and less growth oriented (Gozzi et al., 2007). **Insert Table 7 about here**. Globally, post-cross-listing returns appear to be lower for resources firms than for non resources firms, albeit not significantly different from 0. The reduction in systematic risk is the most spectacular effect that can be associated with cross-listing, and is limited to the high-tech sector. VII. CONCLUDING REMARKS. We re-examine the pre-listing run-up and long-run underperformance of newly Canadian crosslisted firms in the U.S. using the same approach as Mitchell and Stafford (2000) and Eckbo et al. (2007) for other long-term corporate decisions. Our methodology focuses on three objectives: 1) to obtain the most comprehensive sample of cross-listed firms, free of potential sample selection and survival biases; 2) to examine different benchmarks, notably relevant size and book-tomarket reference portfolios; and 3) to estimate alphas from calendar-time regressions using domestic and international relevant risk factors rather than to estimate abnormal returns from event-time methodologies which suffer from cross-sectional dependence. First, we replicate previous results, using a similar sample, the same method for estimating abnormal returns and the same benchmark. Similarly to Mittoo (2003), we observe a strong and significant rally before the cross-listing, and a strong underperformance over the 36-month period following the listing – the underperformance is greater with the equally-weighted index than the value-weighted index. We evidence that these results critically depend on the benchmark, the methodology used and the portfolio weighted scheme. Even with CARs, we do not observe a. 22.
(26) significant underperformance after the cross-listing of Canadian firms with the value-weighted index and a value weighted portfolio scheme, and with reference portfolios. Nor do we observe significant underperformance with BHARs or with calendar-time portfolios. Using a significantly increased sample over the same period as Mittoo (2003), we obtain similar results with the same methodology – CARs, benchmarks and an equally-weighted portfolio scheme. We show, however, that the results can be sensitive to the sample selection and survival biases induced by using the lists of foreign companies provided by U.S. exchanges. Results over the entire 1990-2005 period corroborate our previous results. Using the domestic Fama and French TFPM, the pre-listing 12-month run-up is positive and significant. The 36month post-listing performance is not significantly different from zero. When we estimate abnormal performance through the alphas of a North-American and a world version of the Fama and French TFPM, results are similar. The pre-listing run-up is positive and significant in both cases (25.2% and 23.1%, respectively). The long-run abnormal performance is not significantly different from zero in both cases (0.9% and 5.3% over the 3 years respectively). These results are robust when we use purged risk factors and OLS estimations. Finally, we observe that sectors explain part of the cross-sectional variance in post-listing abnormal results. In contrast with most previous empirical studies, we found no evidence of a significant steady underperformance after cross-listing. We demonstrate that the results of analyses of post-crosslisting returns are highly sensitive to the empirical specification of the tests, a characteristic shared with other corporate events such as initial and seasoned equity offerings. Our conclusion is in line with the theoretical and alleged benefits of cross-listing, the intense cross-listing activity of the ‘90s and ‘00s and the increasing integration of the Canadian and U.S. stock markets. The anticipation of the positive effects of cross-listing can explain the significant post event rally. Our results are a partial response to the post-listing puzzle raised by several authors: there is no loss of wealth for shareholders following a listing abroad. Our results are, however, limited to one country and extensions in other and less integrated markets would be required to reach a definitive answer.. 23.
(27) Table 1. Annual distribution of Canadian companies listed on both a Canadian stock exchange and an American stock exchange between 1990 and 2005 Year. 1989 1990 1991 1992 1993 1994 1995 1996 1997 1998 1999 2000 2001 2002 2003 2004 2005 Total Average. # of crosslisted securities 143 139 137 157 172 200 222 243 244 222 237 213 194 184 230 252 199,3. value traded # of newly crossformerly in millions companies listed cross-listed of $ in December companies companies 127 68,540 132 12 7 59,115 119 8 21 68,019 121 16 14 149,760 136 23 8 199,014 154 32 14 249,886 169 30 15 334,304 190 36 15 411,477 208 28 10 490,663 213 36 31 566,331 195 29 47 1,280,983 216 49 28 805,399 190 24 50 665,373 177 12 25 704,683 179 17 15 1,136,106 187 20 12 1,301,894 199 28 16 400 328 367,1. 174,1. 25,0. 20,5. Net change 5 -13 2 15 18 15 21 18 5 -18 21 -26 -13 2 8 12 72 4,5. Source: Toronto Stock Exchange Review, January 1990 to December 2005.. 24.
(28) Table 2. Summary of the cross-listing and of the cross-delisting process of Canadian companies, from 1990 to 2005. Panel A presents the number and characteristics of newly U.S cross-listed Canadian firms. Panel B presents the reasons that 328 Canadian companies cross-delisted between 1990 and 2005.. Panel A : Sample characteristics of newly cross-listed firms, by sub-periods Num num, % Mean MV Median MV Median MV 1990-1995 TSX 300 Others 46 41.82 586.10 150.09 High-Tech 28 25.45 160.07 91.64 Resources 36 32.73 381.41 113.57 All 347.30 (93_3) 110 100.00 413.71 124.59 1996-2000 Others 54 39.42 1724.79 424.67 High-Tech 51 37.23 1323.10 365.55 Resources 32 23.36 853.65 266.98 All 821.99 (99-02) 137 100.00 1373.26 360.46 2001-2005 Others 22 24.72 3914.81 932.50 High-Tech 20 22.47 587.17 171.57 Resources 47 52.81 771.50 241.72 All 1,698.51 (04-01) 89 100.00 1517.53 307.24 1990-2005 Others 122 36.31 1698.63 273.02 High-Tech 99 29.46 857.61 238.58 Resources 115 34.23 667.38 188.00 All 336 100.00 1095.56 240.15 Panel B : Reasons for Canadian cross-listed firms in the U.S. to cross-delist, 1990-2005 Number % Merger or acquisition 154 46.95 With or by another Canadian interlisted company 29 8.84 With or by a foreign company 64 19.51 With or by a Canadian company 61 18.60 Securities are traded on an American O.T.C. market 40 12.20 Bankruptcy 34 10.37 Privatization 11 3.35 Reorganization into an Income Trust 7 2.13 Delisted from the U.S. stock exchange 42 12.80 Delisted from the TSX, but still listed in the U.S. 26 7.93 Information not available 14 4.27 Total 328 100.00 Sources: TSX review, January 1990 to December 2005, FPinfomart.ca, Sedar, www.otcbb.com, www.pinksheets.com , Google and Copernic software. 25.
(29) Table 3. Abnormal Returns of Canadian U.S. Cross-Listed Firms Using Cumulative Abnormal Returns We estimate abnormal returns for the one-year horizon preceding the U.S. cross-listing of a Canadian firm, and the one-, twoand three-year horizons following the listing. The whole sample comprises 336 cross-listings that occurred from January 1990 through December 2005. Cumulative Abnormal Returns (CARs) are estimated relative to four benchmarks: TSX equally-weighted index (EW), TSX value-weighted index (VW), TSX 10% capped index (C) and size/book-tomarket reference portfolios. Portfolios of Canadian cross-listed firms are equally-weighted (EW) or valueweighted (VW). Three samples of Canadian cross-listed firms are examined: 1) a sample of cross-listed firms from 1991 to 1998 based on the same criteria as Mittoo (2003); 2) an increased sample of cross-listed firms from 1991 to 1998 based solely on the criterion that stocks are traded in 12 consecutive months; 3) the whole sample of cross-listed firms from 1990 to 2005 based solely on the criterion that stocks are traded in 12 consecutive months. The t-statistic for the cumulative average adjusted return in month t, CAR1,t is computed as CAR1,t . n0.5 / tott where n, is the number of firms trading in each month, and tott is computed as tott = [t . var + 2 . (t - 1) . cov]0..5, where t is the event month, var is the average (over 12, 24, 36 months) cross-sectional variance, and cov is the first-order autocovariance of the ARt series. Panel A : Restricted sample (1991 to 1998) Benchmarks EW index # at the 3 4 Portfolio weighted schemes end EW VW Pre listing (-12, - 1) 100 22.47 5.98 3.72 1.94 Post-Listing (+1,+12) 100 -9.46 -1.47 -1.54 -0.42 Post-Listing (+1,+24) 100 -20.56 -9.97 -2.27 -1.86 Post-Listing (+1,+36) 99 -37.44 -15.38 -3.45 -2.33 Panel B: Increased sample (1991 to 1998) Benchmarks EW index # at the 3 4 Portfolio weighted schemes end EW VW Pre-listing (-12, - 1) 151 17.40 3.61 3.69 1.33 Post-Listing (+1,+12) 177 -9.48 1.07 -2.02 0.38 Post-Listing (+1,+24) 165 -22.08 -7.43 -3.10 -1.61 Post-Listing (+1,+36) 153 -35.27 -15.21 -3.91 -2.56 Panel C : Whole sample (1990 to 2005) Benchmarks EW index # at the 3 4 Portfolio weighted schemes end EW VW Pre-listing (-12, - 1) 274 28.72 9.29 7.02 4.00 Post-Listing (+1,+12) 325 -5.84 -4.54 -1.58 -1.79 Post-Listing (+1,+24) 284 -20.54 -18.44 -3.76 -5.06 Post-Listing (+1,+36) 245 -27.91 -25.99 -3.83 -5.72. TSX index 5 6 EW VW 35.28 16.11 5.80 5.62 3.19 5.73 0.53 1.88 -1.58 2.24 -0.18 0.47 -11.93 1,51 -1.11 0.25. Reference Portfolios 7 8 EW VW 40.25 7.35 6.60 2.78 -2.00 -0.57 -0.35 -0.19 -4.07 -3.68 -0.46 -0.77 -7.48 -5.52 -0.70 -0.93. TSX capped index 5 6 EW VW 29.74 14.11 6.30 5.77 1.32 6.96 0.29 2.67 -3.00 4.88 -0.43 1.15 -10.77 -0.12 -1.21 -0.02. Reference Portfolios 7 8 EW VW 34.01 7.71 7.14 3.46 -3.20 1.25 -0.73 0.51 -3.37 -0.15 -0.49 -0.04 -1.51 -2.45 -0.17 -0.46. TSX capped index 5 6 EW VW 39.20 20.51 9.44 9.16 3.94 2.99 1.07 1.21 -2.25 -1.46 -0.41 -0.42 -1.86 -4.72 -0.26 -1.09. Reference Portfolios 7 8 EW VW 40.04 13.32 10.12 6.45 2.07 6.29 0.59 2.98 0.38 3.85 0.07 1.21 5.03 -0.73 0.71 -0.18. 26.
(30) Figure 1. Cumulative Abnormal Returns of Canadian firms that Cross-List in US markets We estimate abnormal returns for the one-year horizon preceding the U.S. cross-listing of a Canadian firm, and the three-year horizon following the listing. The whole sample comprises 336 cross-listings that occurred from January 1990 through December 2005. Cumulative Abnormal Returns (CARs) are estimated relative to three benchmarks: TSX equally-weighted index (EW), TSX value-weighted 10% capped index and size/bookto-market reference portfolios. Portfolios of Canadian cross-listed firms are equally-weighted (EW) or value-weighted (VW).. 0.5 0.45 0.4 0.35 0.3 0.25 0.2 0.15 0.1 0.05 0. -12 -10 -8. -6. CAR. -4. -2. 0. 2. VW. 4. 6. 8. 10 12 14 16 18 20 22 24 26 28 30 32 34 36. CAR EW. CAR ref. portfolio. 27.
(31) Table 4. Abnormal Returns of Canadian U.S. Cross-Listed Firms Using Buy-and-Hold Abnormal Returns We estimate abnormal returns for the one-year horizon preceding the U.S. cross-listing of a Canadian firm, and the one-, two and three-year horizons following the cross-listing. The whole sample comprises 336 cross-listings that occurred from January 1990 through December 2005. Abnormal returns are computed as Buy-and-Hold Abnormal Returns (BHARs) relative to size/book-to-market reference portfolios. Portfolios of Canadian cross-listed firms are equally-weighted (EW) or valueweighted (VW).. Number Panel A : Restricted sample (1991 to 1998) Pre-listing (-12, - 1) 79 Post-Listing (+1,+12). 86. Post-Listing (+1,+24). 86. Post-Listing (+1,+36). 85. Panel B: Increased sample (1991 to 1998) Pre-listing (-12, - 1) 100 Post-Listing (+1,+12). 130. Post-Listing (+1,+24). 130. Post-Listing (+1,+36). 125. Panel C : Whole sample (1990 2005) Pre-listing (-12, - 1) 188 Post-Listing (+1,+12). 230. Post-Listing (+1,+24). 217. Post-Listing (+1,+36). 190. Equally-weighted. Value-Weighted. 52.65 4.07 1.74 0.24 -2.81 -0.40 -3.15 -0.51. 6.29 1.41 -0.92 -0.22 -1.52 -0.41 4.91 1.28. 43.94 3.99 1.03 0.18 -1.34 -0.23 -0.75 -0.14. 6.97 1.73 1.07 0.30 -2.95 -0.79 3.39 1.04. 53.33 5.91 6.11 1.19 -2.60 -0.63 0.87 0.18. 13.32 3.83 5.31 1.41 -7.21 -3.03 -2.42 -0.78. 28.
(32) Table 5. Abnormal Returns of Canadian U.S. Cross-Listed Firms Using Fama-French Three-Factor Pricing Model as a Benchmark We estimate abnormal returns for the one-year horizon preceding the U.S. cross-listing of a Canadian firm, and the one-, two-, and three-year horizons following it. The whole sample comprises 336 cross-listings that occurred from January 1990 through December 2005. We examine value-weighted (monthly-rebalanced) calendar-time portfolio returns. We regress the monthly excess returns to the calendar-time portfolios, R p,t − R f ,t , on the Fama-French (1993) three-factor model: R p ,t − R f ,t = α p + β p ( R m,t − R f ,t ) + s p SMBt + h p HMLt + e p ,t (Rp,t - Rf,t) corresponds, for a given month t, to the returns of the portfolios of private and public equity issues (Rp,t) less the risk-free rate (the monthly rate of 91-day Canadian Government Treasury bills, Rf,t). βp, sp, hp are the loadings of the portfolios on each risk factor: the market (10% capped index), SMB (size) and HML (book-to-market ratio). α indicates the monthly average abnormal return of our Canadian U.S. cross-listed firm sample. Arith stands for the arithmetic abnormal return over the period considered. We estimate the weighted least squares (WLS) time series regression in which the weights are proportional to the square root of the number of firms present each month t. The t-statistics for each parameter are shown in parentheses. H0 for the β coefficient is β equal to one. Arith stands for the three years arithmetic abnormal return.. Panel A: Restricted sample (1991 to 1998) Period Alpha Pre-cross-listing (-12, 0) 0.012 Post-cross-listing (+1,+12) Post-cross-listing (+1,+24) Post-cross-listing (+1,+36). 2.761 0.006 1.357 0.001 0.363 -0.002 -0.794. Panel B: Increased sample (1991 to 1998) Period Alpha Pre-cross-listing (-12, 0) 0.008 Post-cross-listing (+1,+12) Post-cross-listing (+1,+24) Post-cross-listing (+1,+36). 1.811 0.006 1.681 0.003 0.800 -0.001 -0.345. Panel C: Whole sample (1990 to 2005) Period Alpha Pre-cross-listing (-12, 0) 0.017 Post-cross-listing (+1,+12) Post-cross-listing (+1,+24) Post-cross-listing (+1,+36). 2.512 0.005 1.346 0.002 0.659 0.000 0.050. Tsx C. SMB. HML. Adj. R2. Arith. 0.425 -4.097 0.694 -2.468 1.047 0.530 1.071 1.039. 0.424 3.164 0.257 2.870 0.087 1.230 0.047 0.939. -0.011 -0.058 0.134 0.894 -0.223 -1.853 -0.068 -0.720. 0.687. 0.160. 0.802. 0.074. 0.742. 0.033. 0.787. -0.088. Tsx C. SMB. HML. Adj. R2. Arith. 0.954 -0.368 1.206 2.784 1.108 1.371 1.080 1.419. 0.148 1.801 0.146 2.221 0.002 0.045 0.031 0.819. -0.084 -0.563 -0.112 -1.033 -0.247 -2.304 -0.188 -2.692. 0.558. 0.109. 0.827. 0.069. 0.728. 0.067. 0.821. -0.031. Tsx C. SMB. HML. Adj. R2. Arith. 1.181 0.992 1.220 2.400 1.141 2.098 1.137 2.576. 0.483 5.502 0.072 1.051 0.131 3.111 0.094 2.820. -0.331 -1.707 -0.347 -3.638 -0.251 -3.520 -0.179 -3.152. 0.526. 0.221. 0.730. 0.065. 0.694. 0.043. 0.774. 0.004. 29.
Figure
+5
Documents relatifs
Serge Amselem (PU-PH), Université Pierre et Marie Curie, UMR_S933, Service de Génétique et Embryologie Médicales, Hôpital Armand-Trousseau,
The first study examining the existence of target leverage of Vietnam listed firms was by Dereeper, Sébastien and Trinh (2012). Based on a data sample of 300 listed firms
In: Nuclear Instruments and Methods in Physics Research Section A: Accelerators, Spectrometers, Detectors and Associated Equipment 367.1-3 (1995), pp.. “GEM: A new concept for
We report results on a proof-of-concept image classification dataset and on a real-world risk classi- fication task in which the model successfully incorporated feedback from experts
This study concludes that many feminist ideas appeared in the novel Dreams of Trespass by male characters who criticized the harem where they lived and
Consistent with the prediction of an increased analyst following for firms with greater risk disclosure, we document a significant positive association between the four measurements
We particularly focus on major board attributes that have been shown to influence the quality of board monitoring, namely, chief executive officer (CEO) duality leadership (i.e.,
‒ Les dispositions du présent titre sont applicables aux délais et mesures qui ont expiré ou qui expirent entre le 12 mars 2020 et l’expiration d’un délai d’un mois à compter
