Under the radar?
‘Soft’ residential densification in England, 2001-2011
Peter Bibby
1, John Henneberry
1and Jean-Marie Halleux
21Department of Urban Studies and Planning, University of Sheffield, UK 2Department of Geography, University of Liège, Belgium
Abstract
Urban compaction policies have been widely adopted in developed countries in pursuit of more sustainable cities. Compactness is achieved through a process of ‘densification’, of developing and using land and buildings more intensively. However, empirical evidence on the processes and outcomes of urban densification is lacking. The paper addresses this lacuna. It considers densification in England, a country that has long experience of applying policies of urban containment and consolidation; and one where new data sources allow the analysis of recent land use change at a level of detail not hitherto possible. In England between 2001 and 2011 the bulk of additional dwellings were accommodated within urban areas, increasing their density. Yet there were wide inter- and intra-regional variations in the pattern of densification: for example, in the contributions of large scale, formal development and of small scale, informal, gradual change – of ‘hard’ and ‘soft’ densification – to the process. The significant differences in local experiences of densification that result raise major issues for policy.
Keywords
Urban containment, urban densification, hard densification, soft densification
Status
Authors’ final version, published in Environment and Planning B: Urban Analytics and City Science at: http://journals.sagepub.com/home/epb
Introduction
A key aim of the UK land use planning system introduced by the Town & Country Planning Act 1947 was “… to contain urban areas …” (Simmie et al, 1992: 36). This was to be achieved through the establishment of green belts around larger towns and cities and the strict control of extra-urban development elsewhere (Hall, 1974). Urban containment has been pursued with remarkable persistence ever since, despite fundamental changes in its context. Initially, an anti-urban narrative coupled a more dirigiste approach to planning with the need to protect the countryside from the city. ‘Overspill’ of housing and other development from existing settlements was to be accommodated in planned new towns or town extensions (Cullingworth et al, 2014). 1979 marked a fundamental shift in strategy. State intervention – whether related to planned settlements, housing provision or infrastructure investment – was reduced or withdrawn in favour of private, market-driven provision (Allmendinger and Thomas, 1998). At the same time, demand for housing continued to increase, underpinned by population growth and reductions in household size1. In the face of continued constraints on the physical extent of existing settlements the bulk of additional
dwellings required to meet this demand would need to be accommodated in those same settlements. This posed a challenge for policy-makers.
By the mid 1980s the value of complementing containment policy by encouraging residential development on previously developed sites had become evident to central government planners in England. New arrangements for monitoring land use
introduced in 1985 (the Land Use Change Statistics (LUCS),) demonstrated that more than two fifths of new housebuilding occurred on brownfield sites; and that there was little tendency for this proportion to fall in subsequent years. The rate of brownfield development became the main measure of success in avoiding rural to urban land conversion and a key indicator of local planning authority (LPA) performance. In 1998 an explicit target for the planning system was introduced: to ensure that, by 2008, 60% of all new development in England would be accommodated on brownfield sites. The pragmatic assumption was that urban containment would be achieved through intensification.
Given its popular appeal, Government did not seek to justify containment policy. The practical concern lay in regulating incremental private sector development rather than in laying out cities. Intensification could only be achieved through the agency of more than 350 local planning authorities (LPAs) working within a framework set by central government. Planning policy guidance was therefore revised in 2000, reinforcing the presumption for brownfield development and strongly advising against allowing new development at densities of less than 30 dwellings per hectare. These two requirements would be used to control development either by being embedded within the statutory plans of LPAs or standing alongside them. They applied in principle to all LPAs, regardless of local economic conditions or the physical configuration of their urban areas.
1 England’s population increased from 38.67m in 1951 to 53.01m in 2011 and average household size
decreased from 3.3 to 2.4 over the same period. The highest rate of decennial absolute and relative population growth (3.87m/7.9%) occurred between 2001 and 2011.
However, urban ‘intensification’ - or ‘densification’ or ‘consolidation’ - (Burton, 2000) “… is a complex process, with many components …” (Williams et al, 1996: 83) that may be considered at three levels. The first is that of the basic elements of the city: urban land and built structures. The intensification of activities within buildings (or on land) should be distinguished from the intensification of built form (or land) through physical change (Williams et al, 1996; Burton, 2002). Such increased use of existing buildings or land may occur without a change of use or consequent upon a change of use.2 Most forms of densification involve physical works. Some do not add to urban built form; for example, sub-divisions and conversions of existing buildings, and the re-use of vacant buildings. Others do so add. Examples include extensions to existing properties, the development of vacant or derelict open land, infill on back land or gardens involving plot sub-division, and re-development or new development at higher densities, using more intensive building types such as apartment blocks, town houses and terraces. The second level of consideration is the interplay between factors that reinforce or detract from the process of densification. Gains resulting from new development, extensions, conversions to residential use, sub-division of dwellings and so on must be balanced against losses from part or full demolition, conversions from residential use, re-consolidation of previously sub-divided houses and so on. Gains from the
construction of additional buildings must be distinguished from gains from the more intensive use of existing accommodation. Gains from the development of more intensive built forms must be offset by the development of more extensive types of scheme. Thus, whatever the spatial scale of consideration, the net outcome will embody a mix of actions that support or undermine densification. Where the former outweigh the latter, development density will increase, but the converse may also apply3. Consequently, the pattern of densification is likely to display wide inter- and intra-urban variation.
The particular mix of components of densification to which an area is subject and the way in which densification occurs have major implications for local resident and business communities. This is the third level of consideration. Formal planning policy and practice focuses on promoting relatively large-scale re/development involving major developers, investors and infrastructure providers. This results in a significant change in urban form and much disruption during the development period (Pinnegar et al, 2015; Touati-Morel, 2015 and 2016). In contrast, densification may occur
incrementally through the actions of local contractors and, to a lesser extent, of the owners of small sites and buildings. Such gradual change is more difficult for planners to control and usually prompts limited local resistance4 but, cumulatively, may result in substantial neighbourhood change (Pinnegar et al, 2015). Touati-Morel (2015 and 2016) labels the former ‘hard’ densification and the latter ‘soft’ densification.
These outcomes are indicative of complex processes and patterns of densification. Such complications and their nature and significance have yet to be explored because
detailed empirical evidence on the physical outcomes of urban containment and
2Assuming minimal adaptive physical works; hence uncommon. 3That is, that either densification or de-densification may result.
densification is lacking (Burton, 2000; Colomb, 2007; Orenstein, 2014)5. The paper addresses this gap in knowledge by considering the following question. In the context of extant central government planning policy in England, what has been the pattern of residential development and its contribution to urban densification between 2001 and 2011? While the balance between development within the boundaries of urban areas and that beyond is considered, the focus is on the intensification of single family
residential neighbourhoods and especially upon ‘soft’ densification. We proceed in three stages. First, the methodology for defining and analyzing densification and for
distinguishing between its ‘hard’ and ‘soft’ elements is briefly outlined. Next, the results of the analysis are presented and the key aspects of the findings are identified. Finally we discuss the implications of the results.
Methodology: measuring densification in England6
The principal data on which the measurement of residential densification is based are drawn from two sources. The first is Royal Mail’s Postcode Address Files (PAFs) for April 2001 and April 2011 that provide, for the respective times, a comprehensive listing of properties for the purposes of mail delivery. The second is the Land Use Change Statistics (LUCS) collected for the Department of Communities and Local Government that indicate new house building, usually at individual land parcel level. These data enable analysis to proceed at a much finer grain than Output Area (OA) level and allow change to be represented hectare by hectare and results to be provided for broader areas by aggregation. In combination they provide an unrivalled resource for examining densification.
The estimation of the scale and pattern of residential densification was undertaken in five stages.
1. The overall net addition to the residential building stock was derived by applying elementary natural language processing to the 2001 and 2011 PAFs.
2. The number of new dwellings built hectare by hectare for the period 2001-2011 was estimated from the LUCS at individual land parcel level.
3. Estimates of the number of net additional dwellings resulting from change of use and conversion of existing buildings to/from residential use are derived directly from PAF (via changes between residential and non-residential types of address). 4. The number of additional dwellings realized through internal division of houses
is assessed as the residue of the foregoing categories; that is 1 – (2+3). 5. Finally, a size threshold was used to distinguish between ‘hard’ and ‘soft’
densification of each type (with the latter defined as development that did not require the creation of a new unit postcode or that occurred on a site of less than 0.4 hectares).
The following picture of residential densification emerged.
5A review of previous research on urban densification is presented in the Appendix. 6A detailed exposition of this methodologyis presented in the Appendix.
Densification and ‘soft’ densification in England
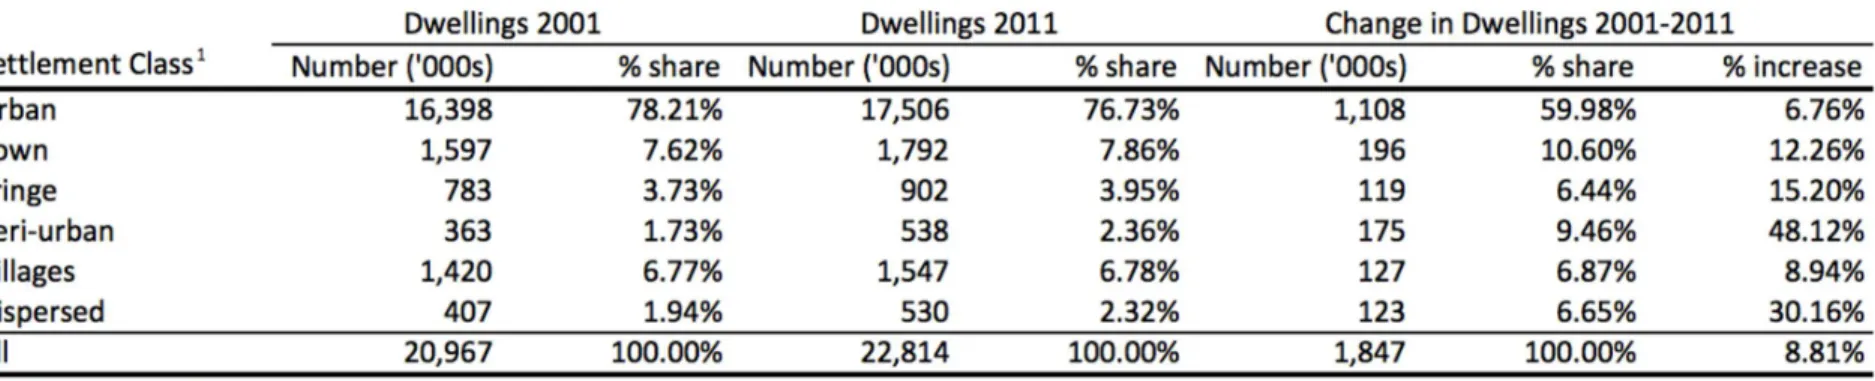
An overview of the contribution of different categories of settlement to accommodating additional dwellings between 2001 and 2011 is provided by Table 1. It demonstrates the remarkable role of England's urban areas in accommodating more than a million additional dwellings within their 2001 boundaries over the inter-censal period. They accounted for three in every five additional dwellings (60%). Thus, in its own terms, planning policy7 was very successful in avoiding urban spread and, hence, in securing densification.
Table 2 demonstrates that of the additional 1.108 million dwellings that were produced within the 2001 urban areas, 77.3% were in single-family residential neighbourhoods (SFRNs) and 22.7% were elsewhere (column 2). There was a similar split in the way that dwellings were produced, with new construction responsible for 76.6% of the additional units and subdivision and conversion of existing buildings for 23.4% (columns 3 and 4). Soft densification accounted for 28.5% of the total number of dwellings absorbed into the urban areas between 2001 and 2011 (column 5): 17.1% of the entire increase in England's dwelling stock.
As the physical extent of both the urban areas and the SFRNs is known, in addition to the estimated number of units gained by soft densification, it is possible to gauge the extent to which this has increased ambient density8: by an additional 0.32 dwellings per hectare in SFRNs, 0.46 dwellings per hectare in other urban areas and 0.33 dwellings per hectare in urban areas overall.
At this general level it is possible to distinguish different forms of soft densification in broad terms and to establish its significance in different contexts. 110,000 dwellings, 9.9% of the net increase in dwellings (column 8) and 34.8% of units attributable to soft densification (column 8/column 5), were generated through internal reorganisation of buildings (including conversion and subdivision of buildings formerly in non-residential use where this did not involve major change). More substantial forms of conversion and subdivision contributed 149,000 dwellings (column 4 – column 8) to the housing stock of urban areas between 2001 and 2011.
In interpreting Table 2 it should be understood that subdivision of existing dwellings is treated as a form of soft densification not involving new construction, but conversion involving subdivision of buildings such as offices, substantial factories and so on is treated as part of hard densification even though it is not treated as part of new construction. For this reason not all conversion and subdivision activity is treated as involving soft densification.
This leads to two important conclusions at the level of England as a whole. First, more than two-thirds (71.5%; column 2 – column 5) of the overall densification of English urban areas was achieved through new construction or large-scale conversion projects
7 Articulated by the 2000 version of PPG3.
8 The term ambient density is used here to refer to the density of dwellings across an entire area (eg
administrative or statistical unit) as distinct from the density at which dwellings are built on a site. The ambient density is much lower than the site density as the area over which it is calculated includes land in all non-residential uses including offices, parks etc.
involving major change. Second, the experiences of SFRNs and of other urban areas relating to soft densification are markedly different. Within SFRNs, soft densification accounted for almost a third of all properties gained through densification overall (32.1%; column 5/column 2). That proportion is much smaller in other urban area (16.3%). In contrast, compared with other urban areas, a significantly smaller proportion of additional dwellings attributable to soft densification in SFRNs was generated through infill construction rather than from the reorganization of existing buildings (62.2%, column 6/column 5, for the former, and 85.4% for the latter). Soft densification, infill and ‘garden grabbing’
Soft densification produced more additional units through construction than through alteration of existing buildings (Table 2, columns 6 and 8). Only a small proportion of this infill construction was accommodated on subdivided house plots or, more generally, on land previously in residential use. A larger proportion of these new units, their
location in essentially residential areas notwithstanding, were built on vacant plots or plots that had previously been in non-residential use.9
Nevertheless, beyond maintaining a distinction between new dwellings arising from forms of soft-densification traditionally described as ‘infill development’ and those created by subdividing buildings already part of the townscape, Table 2 attempts a disaggregation of the infill element by including a proxy for ‘garden infill’ (column 7). Such development retains the existing dwelling or dwellings – that is, no units are demolished - while new units are built on rear gardens (or back land) generating ‘derived plots’ by subdivision10. Although any form of infill development tends to have similar consequences by virtue of its location relative to existing dwellings (such as pressure on infrastructure, additional traffic, and loss of light and intrusion caused by new buildings), ‘garden infill’ may have a sharper impact, on biodiversity or
neighbourhood character, for example. This point is especially significant because although infill development in England has not been particularly contentious
historically, after 2005 opposition to some forms of densification crystallized around the pejorative term ‘garden grabbing’11.
9Our detailed analysis shows that, within urban SFRNs between 2001 and 2011, the sources of land for
housing were as follows: garden infill, 8.3%; other residential curtilage, 2.6%; residential replacement, 17.2%; replacement of other (non-residential) development, 31.6%; vacant land, 32.0%; and
undeveloped land, 8.2%.
10On derived (or derivative) plots, see Conzen (1960: 124). Although urban morphologists identify
various ideal types of derivative plots, the most common distinction is between back land development and replacement of existing dwellings (usually by more units) along the building frontage. Debate in England after 2000 focussed on ‘back gardens’.
11The executive summary of the report by Sayce et al refers to “the issue of back garden development
Table 1: Increase in dwellings by settlement class, England, 2001-2011
‘Garden infill’ activity (part of soft densification) accommodated an estimated 33,000 dwellings in urban areas in the inter-censal decade, of which 29,000 were within SFRNs. This represents 15.9% of all soft densification infill or 10.5% of all soft densification within these areas (that is, 29,000/275,000; Table 2, column 7/column 5). It is
equivalent to 0.2% of their stock in 2001 (that is, 29,000/14,477,000; Table 2, column 7/column 1). This might be thought of as the rate of residential plot subdivision per decade. Also of note is the character of garden infill development. This remained
markedly different from other housing development. Although there was a tendency for the density of property built on sites tracked by the garden proxy to increase over time, development densities were consistently well below those found in other contexts. As a result, the amount of residential space12 secured by a household moving into a garden infill property was typically double that in other new built dwellings (16.6 dwellings per hectare compared with 30.6 dwellings per hectare between 2001 and 2011). Garden infill, while contentious, broadened the portfolio of high status properties in an area13. These summary figures allow concerns about ‘garden grabbing’ to be set in context. If the principal beneficiaries of garden infill were those who were able to realise the capital value of the land that they had made available for development, the derived plots undoubtedly afforded unusually large portions of residential space to their new
occupiers. It is thus difficult to sustain the argument that "tens of thousands of gardens across the country were being dug up, and replaced with blocks of flats and high density buildings that spell disaster for the local environment and local infrastructure"
(Goldsmith, 2010, np)14.
Spatial variation in densification in England 2001-2011
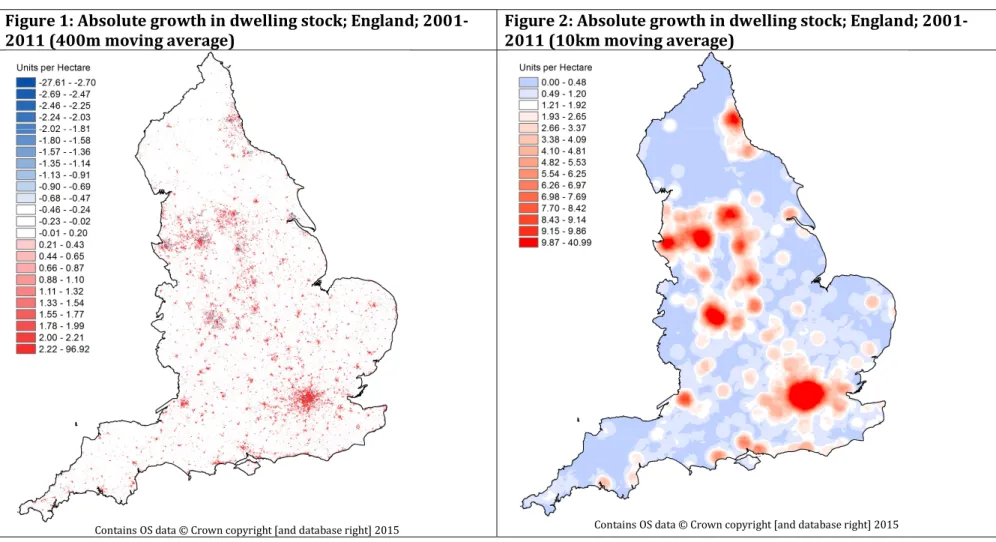
Overall spatial variation in the tendency to accommodate additional dwellings between 2001 and 2011 is illustrated in Figures 1 and 2. Figure 1 has been produced by
comparing counts of dwellings at the 100m x 100m cell scale for 2001 and 2011 and generalising the results using geographic moving averages at the 400m scale. At this level of resolution it is possible to see not only the intensity of densification in much of London and the cores of cities such as Bristol, Manchester and Leeds, but also the very uneven nature of densification within midland and northern cities. Densification characterized the cores of those cities rather than their suburbs and the centres of provincial conurbations rather than their satellite towns.
12For the purposes of this document, ‘residential space’ refers to the sum of the footprint of domestic
buildings and residential gardens as estimated by GLUD.
13 Comparison of residential density on each garden infill site (from LUCS) with the residential density of
the ‘host’ OA (from GLUD) shows that the former is typically 10 dph less than the latter.
14A claim by Conservative MP Zac Goldsmith (2010) in a blog entitled “Zac welcomes conclusion of
Garden Grabbing campaign” when the newly elected Coalition Government announced that garden land was to be removed from the definition of previously developed land and the abolition of density targets.
Figure 1: Absolute growth in dwelling stock; England;
2001-2011 (400m moving average) Figure 2: Absolute growth in dwelling stock; England; 2001-2011 (10km moving average)
Figure 2 uses the same underlying data to show absolute change over the decade in the number of dwellings within 10km of any point. It highlights the importance of the cities in absorbing additional dwellings and the overall extent of densification generally. The dominant pattern reflects the series of cities that runs from London, through the West Midlands conurbation to the Mersey Belt extending from Liverpool to Manchester in the North West. A second ridge of marked densification runs from the cities of Leicester and Nottingham in the East Midlands to Sheffield and Leeds (within Yorkshire and the Humber). The mature urban areas of the North East also accommodated very substantial numbers of additional dwellings.
Regional variation in ‘soft’ densification
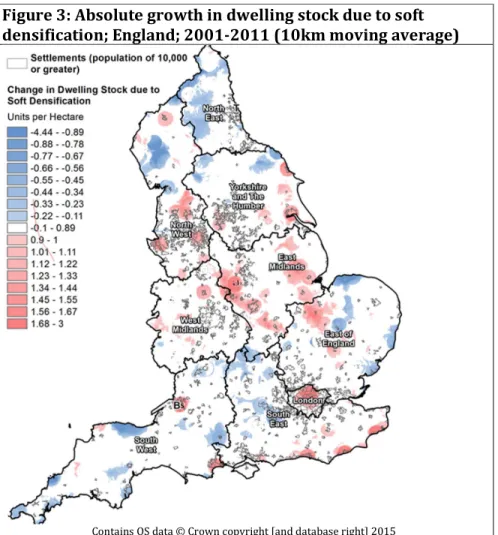
Despite the remarkable extent to which urban areas proved capable of absorbing additional dwellings after 2001 (Table 1) and the substantial contribution of soft densification to that process (Table 2), the latter’s geographic incidence was very patchy. Figure 3 shows the effect of soft densification on ambient density, hectare by hectare across the country. The increasing densities so evident in London are reflected in Bristol (Bs), in certain south coast towns and in many cities and towns in the East Midlands. The effect of soft densification on the major urban areas of the North West was clearly also important, but its impact on the conurbations of Yorkshire and the Humber was a little less clear, and that on the West Midlands conurbation faltering. Soft densification would appear to have had limited effect on densities in the North East region. Finally, in parts of the South East and most of the South West some combination of demolition, amalgamation of dwellings and de-conversion15 cancelled out any
tendency to soft densification, and reduced densification overall.
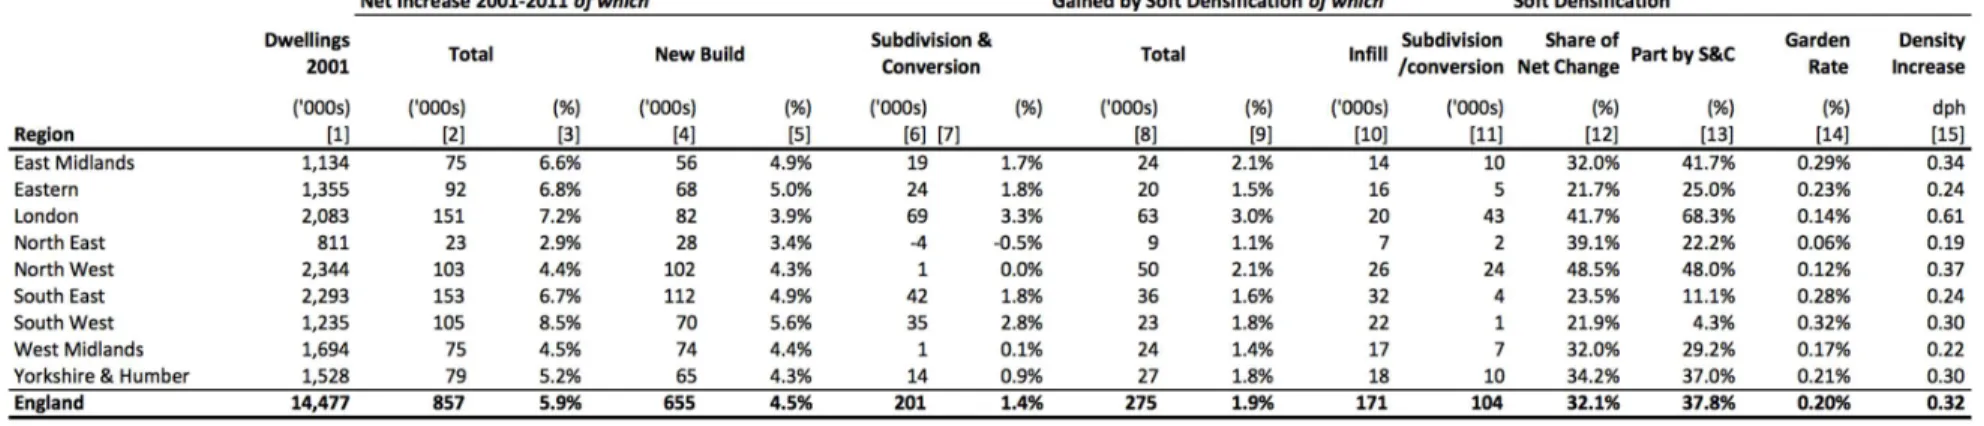
The differences in the rates of soft densification that occurred in SFRNs at the level of NUTS1 regions are shown in Table 3. The table16 demonstrates the vast disparity in the scale of the dwelling stocks between the regions.
At NUTS1 region level, London combines the second-highest growth in the dwelling stock in absolute terms (see column 2 of Table 3) with the second-highest rate of growth (column 3). Soft densification accounted for over two-fifths (41.7%; column 12) of growth in London’s dwelling stock, and increased ambient density by 0.61 dwellings per hectare (column 15). This was achieved overwhelmingly through internal
subdivision of buildings. Two thirds (68.3%; column 13) of soft densification came from this source. The opportunities for recycling urban land and buildings, supported by continuing economic, population and household growth in the context of the very strict containment regime of the Metropolitan Green Belt combined to produce a soft
densification rate of 3% per decade (column 9), almost half as great again as in any of the other regions.
15This term refers to the conversion of a house that has been converted into flats back to its original
usage as single dwelling. The question of whether deconversion constitutes a material change of use requiring planning permission is not clear, but there is a legal precedent for this (London Borough of Richmond-upon-Thames v Secretary of State for the Environment, Transport and the Regions and Richmond upon Thames Churches Housing Trust [2000]).
Figure 3: Absolute growth in dwelling stock due to soft densification; England; 2001-2011 (10km moving average)
Contains OS data © Crown copyright [and database right] 2015
The two NUTS1 regions with rates of soft densification closest to that of London (the East Midlands and the North West, both at 2.1%) embody very different combinations of circumstances. The rate of growth of dwellings in SFRNs in the East Midlands was 6.6%; that in the North West was 4.4% (column 3). The factor underlying the high rate of soft densification in the North West was the large stock of urban land. Green Belt constraint beyond the urban areas, coupled with local policies guiding developers towards recycling the many small sites through urban infilling, ensured that soft densification accounted for a large portion of the additional units created. It
represented a larger part of the net increase in dwellings in the North West (48.5%) than in London (41.7%), the East Midlands (32.0%) or any other region (see column 12). More generally, reference to the rate of growth of the dwelling stock and the settlement structure of each NUTS1 region provides a way of beginning to understand place-to-place variation in soft densification. The West Midlands and the North East with
relatively low rates of growth experienced the lowest rates of soft densification (column 9). The South West with a relatively small dwelling stock displayed the highest rate of growth (at 8.5% over the decade; column 3), but its urban structure – lacking major conurbations – did not favour soft densification, and the overall rate was a moderate 1.8% (column 9).
Table 3: Soft densification, English urban area SFRNs only, by region 2001-2011
The components of soft densification vary in importance across different regions. This is particularly clear in the case of garden infill. The rate of residential plot subdivision (the ‘Garden Rate’, see column 14) is associated with high demand. Division of this rate by the overall rate of soft densification (column 9) shows that garden infill accounted for 18% of all soft densification in the South East and South West but only 5% in the North East.
Soft densification in London
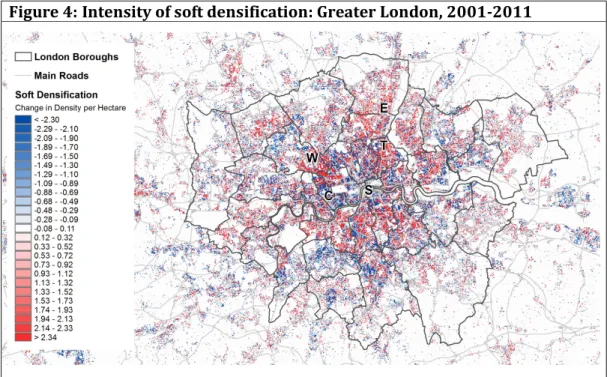
London’s physical extent has been constrained by a green belt for longer than any other English city17 and it has been subject to continually high levels of demand for housing. In these circumstances, it is not surprising that the scale and rate of soft densification in London are the highest of any region (Table 3, columns 8 and 9). For these reasons, a more detailed consideration of London was undertaken to provide an initial indication of the varying character of intra-regional soft densification. Figure 4 illustrates how the average number of units gained through soft densification varied in different parts of London. It is an absolute measure. The most obvious areas of soft densification are attributable to dwelling subdivision and are found in locales such as Willesden (W), Tottenham (T) and Edmonton (E).
While Figure 4 illustrates the effect of soft densification almost street by street, Figure 5 provides a starker impression of the net effect of small-scale adjustments to the
dwelling stock within a 2km radius of any point. This again highlights the scale of soft densification in Willesden (W), Tottenham (T) and Edmonton (E). Net effects in other areas become clearer. The limited role of soft densification is evident in a group of localities such as Southwark (S) where large-scale change is taking place. Here, as in the inner core of Westminster (C), the tendency to soft densification is weak, because change is controlled by major property interests. Figure 5 also highlights stable suburban areas such as Wimbledon,where the net effect of small-scale adjustments is strongly negative. Finally comparison of Figures 4 and 5 draws attention to contexts where there is substantial small-scale activity but little net effect. This is exemplified by the eastern part of the London Borough of Ealing where conversion of family dwellings into flats appears to be almost exactly offset by de-conversion on a similar scale (a trend whose continuation since 2011 is confirmed in monitoring by the Greater London Authority (2014: 44)).
The extent of garden infill in London was relatively limited over the decade; a reflection of the generally high density of building on existing residential plots and a consequent emphasis on building extensions rather than plot subdivision. On the definitions used here, there are some areas of London where the rate of garden infill was relatively high – Southall in the London Borough of Ealing was one such area, an area centred on Childs Hill impinging on the London Boroughs of Camden and Barnet was another and
Kingston-on-Thames, a third. Higher rates were typical of suburban towns beyond the
17Purchase of land by LPAs for inclusion in London’s green belt was underway by 1935 and permanent
protection was given to green belt land by The Green Belt (London & home counties) Act, 1938.
Abercrombie’s County of London Plan defined London’s green belt in 1943. The Town & Country Planning Act, 1947 provided LPAs with the power to prevent development in designated green belts without the need to purchase the land (Campaign to Protect Rural England (CPRE), 2014).
limits of Greater London, particularly in an arc stretching from Reading in the West to St Albans in the North.
Figure 4: Intensity of soft densification: Greater London, 2001-2011
Figure 5: Intensity of soft densification: Greater London, 2001-2011 (2km moving average)
This initial consideration of London and its environs illustrates clearly that the welter of individual actions through which agents adjust the housing stock may and frequently do move in opposite directions. For example, not only are conversions and de-conversions
Contains OS data © Crown copyright [and database right] 2015.
closely balanced in much of Ealing, but also the relatively high rate of plot subdivision in Southall (Ealing) is not evident in the overall pattern of soft densification. In a similar way, a tendency towards densification evident in infill development may be negated by de-conversions or amalgamation of dwellings. Within Greater London, the high rate of infill construction found in much of Croydon is offset by adjustments to the existing stock that tend to create fewer, larger dwellings. This particular balance has also reduced or even negated any tendency to soft densification in areas to the South and West of Greater London, such as Reading, Guildford and Crawley.
Conclusions
Urban England has been well contained. Three in every five additional dwellings developed between 2001 and 2011 were accommodated within extant urban areas. Three quarters of these dwellings were produced by new construction and one quarter by the conversion and sub-division of existing buildings. Three quarters of this activity was in single-family residential neighbourhoods – ‘the suburbs’ – and one quarter elsewhere in urban areas. Three quarters of the additional dwellings were accounted for by formally planned ‘hard’ densification and one quarter by informal ‘soft’
densification occurring ‘under the radar’. But these overall trends, while important, mask myriad experiences of densification that vary greatly between and within English cities.
Interaction between settlement forms, economic structures and performance,
demographic trends and policy regimes, past and present, combine locally to produce a wide range of outcomes. Soft densification accounts for more than 40% of additional dwellings in both London and the North West. But a lack of available sites in the face of high demand results in conversion and sub-division producing twice as many dwellings as infill development in London. In the North West’s cities, with much post-industrial vacancy and lower demand, land supply is much less constrained and the two sources of additional dwellings are in balance. Intra-urban patterns of densification are even more complex. In the London Boroughs various combinations of large, formal development schemes that substantially increase site density and others that reduce it, less intrusive infill developments, and the de-conversion of larger existing houses may all be
proceeding simultaneously. The extent to which development density in an area increases or decreases is determined by the balance between these factors. Indeed, the local built environment may be substantially re-structured but with little net effect on overall density, as in Ealing or Croydon.
Clearly, the process of urban densification is complex and its workings are contingent on local circumstances. This produces great variation in the types of physical change that are pursued and the character of the built environments that result. Despite their heterogeneity, these findings have implications for cities more generally. The first is the importance of the scale at which density and densification are considered. Research at the metropolitan level may conceal as much as it reveals. Similar (trends in) densities between cities may be the only thing that they have in common if these have been achieved in different ways and take different intra-urban forms. More detailed analysis is required to uncover detailed conditions. Secondly, in the absence of such analysis, there is the risk of inappropriate policy responses. For example, moves to remove land
from a city’s green belt where this is not justified, wholly or in part. Thirdly, the
existence of substantial variation in intra-urban densification raises questions about the assumption that more dense and compact cities are also more socially just and
equitable cities (Burton, 2000; Touati-Morel, 2016). Different patterns of intra-urban densification affect different neighbourhoods in different ways, some good and some bad, and their net effect is not clear. Finally, densification challenges the urban stereotype of central areas surrounded by a ring of relatively stable, homogeneous suburbs that expands outwards as cities grow (Phelps and Wood, 2011). It disrupts current assumptions and relations, perhaps particularly in the suburbs. Therefore,
“… density matters … Through the various forms it may take, density reveals power relations. It also mediates between different interests, favouring some and disadvantaging others.” (Charmes and Keil, 2015: 10)
In this paper we have focused on the forms of densification in England, hitherto not established empirically. Subsequent analysis will consider its theoretical, social and policy implications.
Data Sources
This paper is based on the analysis of data drawn from the following sources: the Land Use Change Statistics (LUCS), managed by the Department for Communities and Local Government (for details see <https://www.gov.uk/government/collections/land-use-change-statistics>); and the Royal Mail's Postcode Address File (PAF) (for details see <http://www.postcodeaddressfile.co.uk/products/postcode_address_file_paf/paf_prod uct_detail.htm>).
Acknowledgement
The research for this paper was undertaken in the context of an international research consultation on “Towards ‘soft’ densification and intensification policies? Interests, limitations and opportunities”. This consultation was financed by the French Ministry of Planning (Ministère de la Cohésion des territoires (Ministry of Territorial Cohesion) - Ministère de la Transition écologique et solidaire (Ministry for the Ecological and Inclusive Transition)) and managed by PUCA (Plan Urbanisme Construction Architecture). The authors are grateful for PUCA’s support.
References
Allmendinger P and Thomas H (Eds) (1998) Urban Planning and the British New Right. Abingdon: Routledge.
Burton E (2000) The compact city: just or just compact? A preliminary analysis, Urban Studies, 37(11): 1969–2006.
Burton E (2002) Measuring Urban Compactness in U.K. Towns and Cities, Environment and Planning B: Planning and Design, 29: 219-250.
Campaign to Protect Rural England (CPRE) (2014) London’s Green Belt and Metropolitan Land: Time for Renewal, London: CPRE.
http://www.cprelondon.org.uk/resources/item/2240-london-green-belt-time-for-renewal. Accessed 18/10/17.
Charmes E and Keil R (2015) The Politics of Post-Suburban Densification in Canada and France, International Journal of Urban and Regional Research, 39(3): 581-602. Conzen M (1960) Alnwick, Northumberland: a study in town-plan analysis. London:
Publication No. 27, Institute of British Geographers.
Cullingworth B, Nadin V, Hart T, Davoudi S, Pendlebury J, Vigar G, Webb D and
Townshend T (2014) Town and Country Planning in the UK. Abingdon: Routledge. Dubois O and Van Criekingen M (2006) La « ville durable » contre les inégalités
sociales ? Compacité urbaine et gentrification à Bruxelles, Urbia, 2: 9-18. Greater London Authority (2014) Housing In London 2014: The evidence base for the
Mayor’s Housing Strategy. London: Greater London Authority.
Hall P (1974) The Containment of Urban England, The Geographical Journal, 140(3): 386-408.
London Borough of Ealing (2013) Illegal Outhouses in Ealing, Draft Reprot to Scrutiny Panel. Available at: http://www.ealing.gov.uk/download/meetings/id/item_7-illegal_outhouses_appendix
Orenstein D, Frenkel A and Jahshan F (2014) Methodology matters: measuring urban spatial development using alternative methods, Environment and Planning B: Planning and Design, 41: 3-23.
Phelps N and Wood A (2011) The New Post-suburban Politics? Urban Studies, 48(12): 2591–2610.
Pinnegar S, Randolph B and Freestone R (2015) Incremental urbanism: characteristics and implications of residential renewal through owner-driven demolition and rebuilding, Town Planning Review, 86 (3): 279-301.
Sayce S, Walford N and Garside P (2012) Residential development on gardens in
England: Their role in providing sustainable housing supply, Land Use Policy, 29: 771-780.
Simmie J, Olsberg S and Tunnell C (1992) Urban Containment and Land Use Planning, Land Use Policy, 9: 36–46.
Touati-Morel A (2015) Hard and Soft Densification Policies in the Paris City-Region, International Journal of Urban and Regional Research, 39(3): 603–612.
Touati-Morel A (2016) The ‘hidden mechanisms’ of land use policies: The case of socio-spatial impacts of suburban densification, Territoire(s), 5: 1-18.
Williams K, Burton E and Jenks M (1996) Achieving the Compact City through
Intensification: an Acceptable Option? In Jenks M, Burton E and Williams K (Eds) The Compact City: a Sustainable Urban Form? London: Spon, pp.83-96.
APPENDIX
Previous research on urban densification
Detailed empirical evidence on the physical outcomes of urban containment and densification is lacking (Burton, 2000; Colomb, 2007; Orenstein, 2014). Some studies consider alternative containment policies but not the responses to them (for example, Millward, 2006) or consider those responses more in broad conceptual terms than in detailed concrete terms (for example, Touati-Morel, 2015 and 2016). Other studies are concerned with defining and measuring density (for example, Williams, 2009), urban form (for example, Williams, 2014) or compactness (for example, Lee et al, 2015) at national or metropolitan levels, but not with the physical adjustments that are made to achieve these states. Yet others focus on specific components of urban densification such as the construction of new residential units (Nelson et al, 2004), the scale of garden development (Sayce et al, 2012), the amount of vacant land (Newman et al, 2016a) or the potential for house building on such previously developed land (Sinnett et al, 2014). Apart from their partial coverage, all the latter studies were at the
metropolitan or local authority level and therefore give no insight into intra-urban processes and patterns of densification.
A rare example of intra-urban analysis is the work of Newman et al (2016a and b). They examined the prevalence of abandoned structures in US cities at census tract18 level using, as a measure, vacancy rates derived from GIS data on vacant addresses provided by the US Postal Service. This was done within a conceptual framework that highlights the interplay between the fixedness of a city’s land area (whether the urban envelope is elastic or inelastic) and the trend in its population (whether the demand for
accommodation is growing or declining). Inelastic cities had lower levels of vacancy than elastic cities, especially if their populations were growing. However, nothing is said about what amounts and forms of physical development reduce vacancy in these
circumstances: circumstances that are typical in England.
In the case of England, the two most useful studies of urban densification are those of Burton (2002) and, particularly, of Bibby (2009). Burton developed a range of
indicators for the various facets of both the process of intensification and the resulting density of the subject cities. However, most of these measures were based on data relating to population, housing stock/type, dwelling completions, planning permissions and brownfield land. In addition, her study was undertaken at local authority level (for 25 medium-sized English cities). This, combined with the inadequacies of the data, led Burton (2002: 245) to conclude that her analysis “… may hide internal distributions of density that are more significant in determining different outcomes …” on the ground.
18 “Census tracts generally have a population size between 1,200 and 8,000 people, with an optimum size
of 4,000 people.” (United States Census Bureau, https://www.census.gov/geo/reference/gtc/gtc_ct.html, accessed 18/10/17)
The introduction, development and adaptation of new data sources have significantly improved the information available on land use in England. Drawing on these sources19, Bibby (2009) undertook a much more detailed analysis of recent land use change in England than had hitherto been possible. Using a 14-fold typology of locales20 he demonstrated, inter alia, that for the period 2000-2004, the main urban areas
accounted for the development of 59.8% of net additional dwellings (or 297,700 units, the result of a gross addition of 380,900 and a gross loss of -83,200). This change was shared roughly equally between city centres and higher density suburbs, on the one hand, and low density, villa and low density, edge suburbs, on the other. Over the same period, the “… ambient density in urban areas increased from 32.39 to 32.62 dwellings per hectare, excluding parks, open spaces, industrial areas, etc.” (Bibby, 2009: S12)
Methodology
Measuring densification in England
The principal data on which the measurement of residential densification is based are drawn from two sources. The first is Royal Mail’s Postcode Address Files (PAFs) for April 2001 and April 2011 that provide, for the respective times, a comprehensive listing of properties for the purposes of mail delivery. The second is the Land Use Change Statistics (LUCS) collected for the Department of Communities and Local Government that indicate new house building, usually at individual land parcel level. These data enable analysis to proceed at a much finer grain than Output Area (OA) level and allow change to be represented hectare by hectare and results to be provided for broader areas by aggregation. In combination they provide an unrivalled resource for examining densification.21
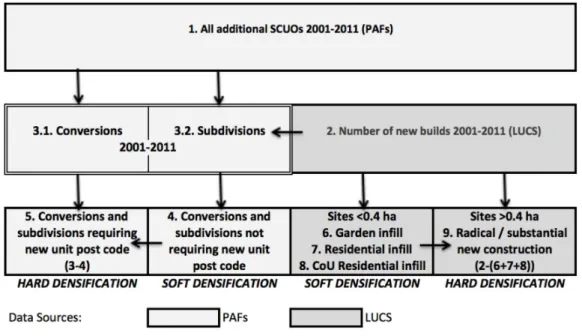
The overall scale of the addition to the residential building stock, however achieved, is estimated by the net change in the number of self-contained units of occupation (SCUOs) inferred from the 2001 and 2011 PAFs (see Figure A[1]). We use the numbers of residential delivery points recorded on PAF together with supplementary households information from PAF to estimate the number of permanent dwellings for occupation by private households by making adjustments to exclude: student accommodation of various forms; institutions (for example, nurses homes, prisons, hostels); elderly persons homes; units on caravan sites; and non-residential units (for example, accommodation addresses, units in managed workspace). But multiple SCUOs are allowed in subdivided property, in serviced apartments and in new residential blocks with what is termed by Royal Mail a single ‘delivery point’.22
19The Land Use Change Statistics (LUCS), the National Land Use Database of Previously Developed Land
(NLUD-PDL), and the Generalised Land Use Database (GLUD), the Ordnance Survey’s Addresspoint, the Valuation Office Agency’s (VOA) rating list and the Royal Mail’s Postcode Address File (PAF).
20Rural town, urban fringe, village, peri-urban, village envelope, hamlet, isolated farmstead and other
rural; villa suburb, low density suburb, low density edge suburb, higher density suburb, city living and other urban (Bibby and Shepherd, 2004; Bibby and Brindley, 2006).
21Their principal weakness is that they will not detect covert densification related for instance to
accommodation in illegal outhouses (see London Borough of Ealing, 2013).
22Where the postal service leaves mail for occupants at a single place within the building – such as a
Figure A: Approach to Estimating Densification in England, 2001-2011
Source: the authors
The SCUO counts therefore rest on considering each delivery point on PAF in turn, and, where more than one household is recorded, determining the number of additional SCUOs to be admitted. This analysis was based on the application of elementary natural language processing to the building names, sub-building names and occupier names included on PAF, using the artificial intelligence language Prolog and its Definite Clause Grammars extension (DCG).
The number of new dwellings built hectare by hectare for the period 2001-2011 was estimated from the LUCS at individual land parcel level (Figure A[2]). When a land use change is noted by Ordnance Survey in the process of large-scale map revision, a LUCS record is created which includes: the grid reference (location) of the parcel affected by the change (correct to 10m); the area affected by the change (in hectares); the
estimated year of change; the land use classification before and after the change; and, in the case of changes to residential property, the number of units demolished and the number of units built.
Estimates of the number of net additional SCUOs resulting from change of use and conversion of existing buildings to/from residential use are derived directly from PAF (Figure A[3.1]). The number of additional dwellings realized through internal division of houses (Figure A[3.2]) is assessed as the difference between the overall number of units attributable to densification and those forms involving new construction that can be estimated from LUCS.
Distinguishing between ‘hard’ and soft’ densification
The next step in the analysis was to make an operational distinction between ‘hard’ and ‘soft’ densification (as characterised by Touati-Morel, 2015 and 2016). In this way the
significance of major change by large actors such as volume housebuilders or
commercial developers that is usually formally planned, may be compared with that of gradual change by small actors that often occurs ‘under the radar’. The latter actors include small house builders and property owners or community groups, together with professionals who might serve individual households, including surveyors, architects, and those providing finance appropriate to this scale of activity. The essential difference between hard densification and soft densification is that the former will usually demand significant infrastructure investment and will require capital resources beyond the reach of a small housebuilder.
The particular processes that may appropriately be included in the expression ‘soft’ densification are: the division of house plots and construction on the released part; the construction of small scale schemes on spare or undeveloped plots not previously in residential use; the construction of auxiliary dwellings within existing curtilages; the internal subdivision of houses into flats; the extension and reconfiguration of larger residential properties; and the change of use and subdivision of non-residential buildings for residential purposes where substantial change is not involved.23
Following the same approach as that adopted for overall densification, we consider PAF and then LUCS. Regarding PAF, a pragmatic protocol was adopted that gauges the significance of change by its implications for postal deliveries. A change is treated as an instance of ‘soft’ densification if the creation of a new unit postcode is not required. Where new dwellings are created their postcode sector will be determined by their location. The question of whether new properties will be assigned to the same unit postcode as neighbouring properties depends on the scale of the change. Specifically it depends on the implications for mail delivery. In the case of those new dwellings created through subdivision of a house into flats, those accommodated where a residential parcel has been subdivided, or which are secondary dwellings within the curtilage of a principal property, the new units will share the same full postcode as their host.
More significant change on the other hand will require the creation of one or more new unit postcodes within the same sector. Thus change that involves soft densification will not entail the creation of new postcodes 24 (Figure A[4]), while major change will (Figure A[5]). Identifying full postcodes that persist from one decennial census to the next and the number of associated residential changes provides a way of estimating the extent of soft densification, although it does not indicate the specific processes through which the additional units were produced.
23Much conversion and subdivision (for example, of former industrial premises such as textile mills or of
Victorian institutional buildings such as public asylums) is on a large scale and may need to be
undertaken alongsidesubstantial new construction to ensure viability. The work of specialist developer Urban Splash provides cases in point (Bloxham et al, 2011).
24Sometimes whole sets of postcode labels are changed; for example, when new postcode sectors are
created. In such circumstances, all properties across a broad area are assigned new postcodes, but any properties previously referenced by postcode i will subsequently be systematically reassigned to
postcode j. Postcode labels change in such cases but the specific groupings of individual properties do not. For analytic purposes this is not treated here as a case of unit postcode change.
Turning to LUCS, the following three types of construction are recognized as categories of ‘soft’ densification. The construction of one or occasionally more new dwellings built on residential land without demolition of a dwelling unit (approximating units gained through residential plot subdivision and subsequently referred to as ‘garden infill’; Figure A[6]). The construction of one or more new dwellings on parcels of no more than 0.4 hectares in extent25 occupied by one or a small number of existing dwellings,
possibly with demolition and replacement on that parcel (Figure A[7]). The
construction of one or more new dwellings on parcels of no more than 0.4 hectares in extent that were not previously in residential use (possibly involving demolition of non-residential buildings and consistent with the capacity of the agents with whom soft densification is associated; Figure A[8]), including construction on spare or
undeveloped plots. Development that constitutes ‘hard’ densification is any
construction recorded in LUCS that is more substantial than, and therefore falls outwith, the preceding three categories (Figure A[9]).
Focusing on residential neighbourhoods
In order further to refine the analysis, suburbs styled as ‘single-family residential neighbourhoods’ (or SFRNs)26, based on OAs, were delimited. OAs are the smallest units for which census data are released, each typically accommodating about 150
households. Census data allows the numbers of households living in each of a series of property types to be assessed in each OA (detached houses, semi-detached houses, terraced houses, converted flats in residential property originally designed for single household occupation, purpose-built flats, and further accommodation types). SFRNs were defined as those parts of OAs where more than half of all households live in whole houses or flats converted from whole houses. These OAs might be termed SFRN-OAs. The distinction between SFRNs and the SFRN-OAs in which they lie is important, because OAs typically include extensive non-residential land and property, and their boundaries may extend beyond the physical limits of the urban area. The approach taken was to overlay the mosaic of OAs from the 2001 and 2011 censuses on a grid representing the limits of physical settlement.
References
Bibby P (2009) Land use change in Britain, Land Use Policy, 26S: S2–S13. Bibby P and Brindley P (2006) Residential Development since 2000, Report to
Department of Communities and Local Government, University of Sheffield, Sheffield.
Bibby P and Brindley P (2013) Urban and Rural Area Definitions for Policy Purposes in England and Wales: Methodology (v1.0), Defra, Department for Communities and Local Government, Office for National Statistics, Welsh Government Available at https://www.gov.uk/government/uploads/system/uploads/attachment_data/fi
25 This 0.4 ha measure is approximately equivalent to 1 acre. This cut-off is frequently used in Britain as a
threshold in distinguishing small-scale from more significant development in the application of planning and similar ordinances.
26 Strictly these should be understood as neighbourhoods where the property was originally intended for
le/239477/RUC11methodologypaperaug_28_Aug.pdf. Last accessed 2nd May 2015.
Bibby P and Shepherd J (1991) Rates of Urbanization In England, 1981-2001. London: HMSO.
Bibby P and Shepherd J (1996) Urbanization in England: Projections 1991-2016. London: Department of the Environment, HMSO.
Bibby P and Shepherd J (2004) Developing a New Classification of Urban and Rural Areas for Policy Purposes—the Methodology, Report to Office for National Statistics. Available at: http://www.defra.gov.uk/rural/ruralstats/rural-defn/Rural Urban Methodology Report.pdf
Bloxham T, Falkingham J and Johnson N (2011) Urban Splash: Transformations, London: RIBA publishing.
Lee J, Kurisu K, An K and Hanaki K (2015) Development of the compact city index and its application to Japanese cities, Urban Studies, 52(6): 1054–1070.
Millward H (2006) Urban containment strategies: A case-study appraisal of plans and policies in Japanese, British, and Canadian cities, Land Use Policy, 23: 473–485. Nelson A, Burby R, Feser E, Dawkins C, Malizia E and Quercia R (2004) Urban
Containment and Central-City Revitalization, Journal of the American Planning Association, 70(4): 411-425.
Newman G, Bowman A, Lee R, and Kim B (2016a) A Current Inventory of Vacant Urban Land in America, Journal of Urban Design, 21(3): 302-319.
Newman G, Gu D, Kim J, Bowman A and Li W (2016b) Elasticity and Urban Vacancy: A Longitudinal Analysis of U.S. Cities, Cities, 58: 143-151.
Sinnett D, Carmichael L, Williams K and Miner P (2014) From wasted space to living spaces: The availability of brownfield land for housing development in England. London: Campaign to Protect Rural England.
Touati-Morel A (2015) Hard and Soft Densification Policies in the Paris City-Region, International Journal of Urban and Regional Research, 39(3): 603–612.
Touati-Morel A (2016) The ‘hidden mechanisms’ of land use policies: The case of socio-spatial impacts of suburban densification, Territoire(s), 5: 1-18.
Williams K (2009) Space per person in the UK: A review of densities, trends, experiences and optimum levels, Land Use Policy, 26S: S83–S92.
Williams K (2014) Urban form and infrastructure: a morphological review. London: Government Office for Science.