ASSESMENT OF ULTIMATE BENDING MOMENT OF SHIPS
FROM A RELIABILITY POINT OF VIEW, USING INDEPENDENT
PERTURBATIONS METHOD
C. Toderan1), T. Richir 1), 2), J. D. Caprace 1) and Ph. Rigo 1), 3)1)
Naval Architecture Department (ANAST), University of Liege, Belgium
2)
Fund for Training in Research in Industry and Agriculture of Belgium (F.R.I.A.)
3)
National Fund of Scientific Research of Belgium (NFSR.)
ABSTRACT
This paper presents a method to asses hull girder ultimate bending moment distribution, taking into account parameters uncertainty. This method is a part of a research activity carried out at University of Liege. The method is able to compute four statistical moments of ultimate strength distribution: average, standard deviation, skewness and kurtosis. Geometry parameters, material parameters and initial imperfections (initial deflections and residual stresses) are considered as random variables and a distribution is associated to each of them. Ultimate bending moment algorithm is a progressive collapse analysis based on Smith method and associated with the load-end shortening model proposed by Bureau Veritas and Joint Bulker Project Rules (JBP). In order to perform a reliability analysis, this algorithm is coupled with independent perturbations method. The advantage is a lower number of simulations compared to the standard Monte-Carlo procedure and a good use of the initial information that is available. The paper contains also a comparative analysis between the presented method and a linear sensitivity analysis performed by the ISSC 2000 “Ultimate Strength” committee for a VLCC structure.
KEYWORDS
Ultimate strength; Reliability; Load shortening model; Statistical moment; Model uncertainty; Progressive collapse analysis; Independent perturbations method.
INTRODUCTION
Simulation of the collapse behavior is an essential issue in assessing the safety of marine structures. An accurate estimate of the maximum load-carrying capacity, also called ultimate strength, is required to determine the maximum load that the structure can support. Ultimate strength of plates and stiffened panels is a complex function of a large number of parameters (geometry, material
properties, and imperfections) and a deterministic assessment procedure is often not sufficient for practical applications.
The uncertainties related to hull girder ultimate strength are usually classified in two classes:
• parameter uncertainties – related to physical model (the geometrical properties, scantlings of hull
3rd International ASRANet Colloquium 10 – 12th July 2006, Glasgow, UK.
components, material properties, imperfections,…)
• model uncertainties – related to mathematical model (hypotheses, analytical or numerical methods) Parameter uncertainties could be quantified by measurements, but in practice available data for a case study is often insufficient. Some general models were proposed in the literature for plates thickness, initial deflection, corrosion thickness, residual stress, etc. A sensitivity analysis of parameter uncertainties on hull girder ultimate strength was carried out by the ISSC 2000 IV.2 Committee [1] and it was found that the most influential parameters are yielding stress of the material and plate and stiffener thicknesses.
Model uncertainties could be defined as the gap (or ratio) between the numerical results and the actual value of the ultimate strength obtained via full scale tests or model tests. A study on model uncertainties was recently proposed by
Moan and al. [2] using several tests on box-girders models, simplified models and scale models. However, the number of available tests published until now seems to be still insufficient to perform an accurate statistical estimation of hull girder ultimate strength model uncertainty for different types of ships. Different reliability-based methods to assess ultimate strength of ships were published in recent years [3]. In all the cases, ultimate bending moment distribution is evaluated using two statistical moments (mean and standard deviation) or assuming to have a defined shape. Teixeira and Guedes-Soares [3] proposed a log-normal distribution with a 10 – 15% standard deviation for tankers and bulk carriers.
It is known that target probability related to ultimate strength limit state of ships is less than 10-7 in many cases, so it is crucial to model accurately the ultimate bending moment distribution and particularly its tails. For this purpose, it is important to take into account the third and mainly the fourth statistical moments of this distribution (skewness and kurtosis).
This paper presents a methodology to compute four statistical moments of ultimate strength distribution taking into account parameter uncertainty related to scantlings and material properties. A computer code, PRO-HULLST was developed and an application on a VLCC structure is presented below.
STATISTICAL MOMENTS OF A DISTRIBUTION
Generally, a random variable X is associated with a function called probability distribution – f(X) (see Fig1). It is usual to model this distribution by several statistical moments, as follows:
[ ]
X X f X dX m( )
X E∫
∞ ∞ − = = 1 1 1 ( ) (1)[ ]
X X m X f X dX( )
X E∫
∞ ∞ − = − = 1 2 2 2 ( ( )) ( )µ
(2)[ ]
X X m X f X dX( )
X E∫
∞ ∞ − = − = 1 3 3 3 ( ( )) ( )µ
(3)[ ]
X X m X f X dX( )
X E∫
∞ ∞ − = − = 1 4 4 4 ( ( )) ( )µ
(4)The first moment is the mean value of X; the moments greater than 1 are expressed as centered moments, relatively to the mean value. Using equations (2) – (4), it is easy to define the following parameters:
( )
X Xµ
2σ
= - standard deviation (5)( )
( )
3 3 1 X X X σ µ β = - skewness coefficient (6)( )
( )
4 4 2 X X X σ µ β = - kurtosis coefficient (7)In this convention, skewness coefficient is negative for a left dissymmetry distribution and zero for a symmetric distribution. The kurtosis coefficient has a value greater than 1.80 for usual distribution function and less than 1.80 for multi-modal distributions (β2=3 for
Gauss distribution).
INDEPENDENT PERTURBATIONS METHOD
One major difficulty of reliability based methods is the computation of statistical parameter of the response (output) as a function of statistical distributions of the input variables. Analytical methods are used only for simple cases and usually for a linear behavior of the structural model. For complex non-linear problems involving a large number of parameters, as ultimate strength analysis of ship structure, two classes of methods are
generally used: Monte-Carlo simulation and perturbations method.
In practice, Monte-Carlo method is limited when the structural model is sophisticated and the target probability is very low. Perturbations methods are often based on Taylor developments and limited to two statistical moments. Independent perturbations method proposed in this paper take into account four statistical moments by modeling each input variable distribution by three weighting points (see Fig 2)
X1, X2, X3 – values of variables P1, P2, P3 – associated probabilities.
Each weighting point is defined by a variable value and an associated probability. In order to respect four moments of the distribution, five conditions are imposed to these quantities: 1 3 2 1 +P +P = P
( ) ( ) ( )
1 2 2 3 3 1 1 X P X P X m P + + =(
)
(
)
(
)
2 2 1 3 3 2 1 2 2 2 1 1 1 X −m +P X −m +P X −m =µ P(
)
(
)
(
)
3 3 1 3 3 3 1 2 2 3 1 1 1 X −m +P X −m +P X −m =µ P(
)
(
)
(
)
4 4 1 3 3 4 1 2 2 4 1 1 1 X −m +P X −m +P X −m =µ P (8) X X f(X) m1(X)Fig.1 : Distribution of random variable X
X X f(X)
X2
Fig.2 : Model of variable X distribution
X1 X3
P1
P2 P3
A particular solution of equations system (8) is chosen by fixing the value of the central point X2 at the distribution mean m1.
X2 = m1 (9)
The solution of the non-linear equations system (8) is obtained using the Newton method. Obviously, the four statistical moments of the input variable distributions are supposed to be known. If it is impossible to calculate skewness and kurtosis by the statistical treatment of available data, the law of maximal information entropy should be used. This law imposes a symmetrical distribution if skewness is unknown and a kurtosis corresponding to Gamma function. If input variables are considered independents, the four statistical moments of response (ultimate bending moment) distribution could be calculated using the value of the response at the central point of each input variable and the perturbation of each lateral point:
MC = M (X12, X22,…, Xi2,…) (10) Mj1 = M (X12, X22,..,Xj1…, Xi2,…) (11) Mj3 = M (X12, X22,..,Xj3…, Xi2,…) (12)
M – response function (ultimate bending moment algorithm)
MC – central value of the response Xi2 – central weighting point of i-th input variable
Mj1- left response of j-th input variable Mj3- right response of j-th input variable Xj1 – left weighting point of j-th input variable
Xj3 – right weighting point of j-th input variable
The perturbations induced by input variables are calculated as follows:
dj1= Mj1-MC (13)
dj3= Mj3-MC (14)
dmkj= Pj1( dj1)k +Pj3 (dj3)k (15) dµkj= Pj1( dj1-dm1j)k +Pj3 (dj3- dm1j)k (16)
dj1- left perturbation of j-th input variable;
dj3- right perturbation of j-th input variable;
dmkj – perturbation of k-th statistical moment of the response due to j-th input variable;
dµkj – perturbation of k-th statistical centered moment of the response due to j-th input variable;
Pj1 – probability to the left point of j-th variable;
Pj3 – probability to the right point of j-th variable.
The statistical moments of response distribution are obtained as follows:
∑
+ = j j C M M dm m1 1 (17)∑
= j j M d 2 2 µ µ (18)∑
= j j M d 3 3 µ µ (19)∑
= j j M d 4 4 µ µ (20)The method presented here requires a low number of simulations and gives a quite good estimation of statistical moments of ultimate strength. No
particular constraint was imposed on input variables distributions or on structural model.
ULTIMATE STRENGTH MODEL
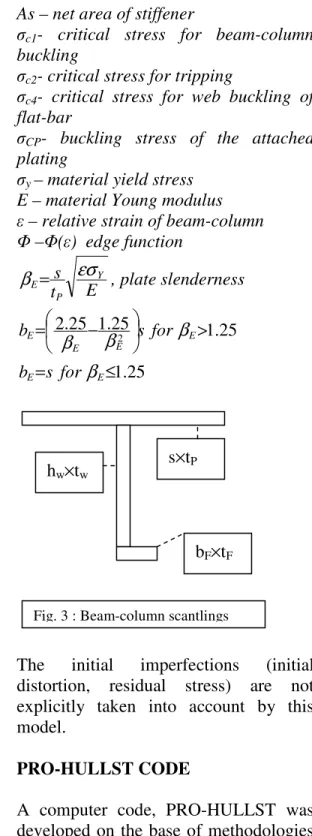
Independent perturbations method was coupled with progressive collapse analysis based on Smith method. The computer code HULLST, developed and presented by Yao and Nikolov in 1991 [4] is the incremental “engine” of the methodology presented in this paper. The method chosen to simulate stiffened panel behavior in compression is based on the recommendation of Bureau Veritas rules [5] and Joint Bulker Project Rules (JBP). The axial compressed stiffened panel is supposed to collapse through the four following failure modes:
- beam-column buckling (mode I) - tripping of stiffener (mode II) - web local buckling of flanged
stiffener (mode III)
- web buckling of flat-bar stiffener (mode IV)
In tension, only the elasto-plastic collapse is considered. The critical (ultimate) stress is computed for each failure mode and the smallest one gives the equation to be used for the load-end shortening curve. These equations are given below: P P E c I e st As t b As + + Φ = 1 mod σ σ (21), P CP P c II e st As st As + + Φ = σ σ σ 2 mod (22), F F W W P F F W WE P E y III e t b t h st t b t h t b + + + + Φ = σ σmod (23), P CP P c eIV st As st As + + Φ = σ σ σ 4 mod (24), where:
As – net area of stiffener
σc1- critical stress for beam-column
buckling
σc2- critical stress for tripping
σc4- critical stress for web buckling of
flat-bar
σCP- buckling stress of the attached
plating
σy – material yield stress
E – material Young modulus
ε – relative strain of beam-column Φ –Φ(ε) edge function E t s Y P E
εσ
β
= , plate slenderness 25 . 1 25 . 1 25 . 2 2 > − = E E E E s for b β β β 25 . 1 ≤ = E E s for b βThe initial imperfections (initial distortion, residual stress) are not explicitly taken into account by this model.
PRO-HULLST CODE
A computer code, PRO-HULLST was developed on the base of methodologies presented above. The flow-chart of the software is presented on Figure 4. The code allows the choice of input variables considered independents.
bF×tF
hw×tw
s×tP
SENSITIVITY ANALYSIS ON VLCC “Energy Concentration”
The method proposed in this paper was tested on the VLCC “Energy Concentration”. This ship was investigated in many research activities and parameter sensitivity analysis was published by ISSC’2000 VI.2 Special
Task Committee [1]. The midship section presents three types of stiffeners: T-bar, angle-bar and flat-bar, and two types of steel with the yield stress 235.2 MPa and 313.6 MPa . This structure was modeled using HULLST code and some INPUT VARIABLES : plate thickness, stiffener scantlings,
yield stress, Young modulus
(four statistical moments of the distribution)
Newton Method : solution of non-linear system of equations
System (8)
HULLST
• Central ultimate moment MC
• Left and right ultimate moments for
each variable (Mj1, Mj3)
• Ultimate moment perturbations
induced by input variables (dmjk, dµjk)
Statistical moments of ultimate strength distribution All input variables All input variables
Figure 4 : PRO-HULLST flow-chart
BV, JBP
details are given below :
• 103 beam-column elements • 7 hard corner elements • 2 plate elements.
In order to compare PRO-HULLST method with the linear sensitivity analysis performed by the ISSC Committee, only the thickness of plates and stiffeners and the yield stress were selected as input variables. The total number of random variables to consider for VLCC structure was 430.
Input variables distributions were defined for two different cases (Table 1):
COV – coefficient of variation of ultimate longitudinal strength (σ / mean)
• Case A: all variables present a Gauss distribution with mean and standard deviation given in the ISSC VI.2 Committee Report [1].
• Case B: all thicknesses present a uniform distribution, while the yield stress remains normal distributed. The average and standard deviation is the same as in Case A.
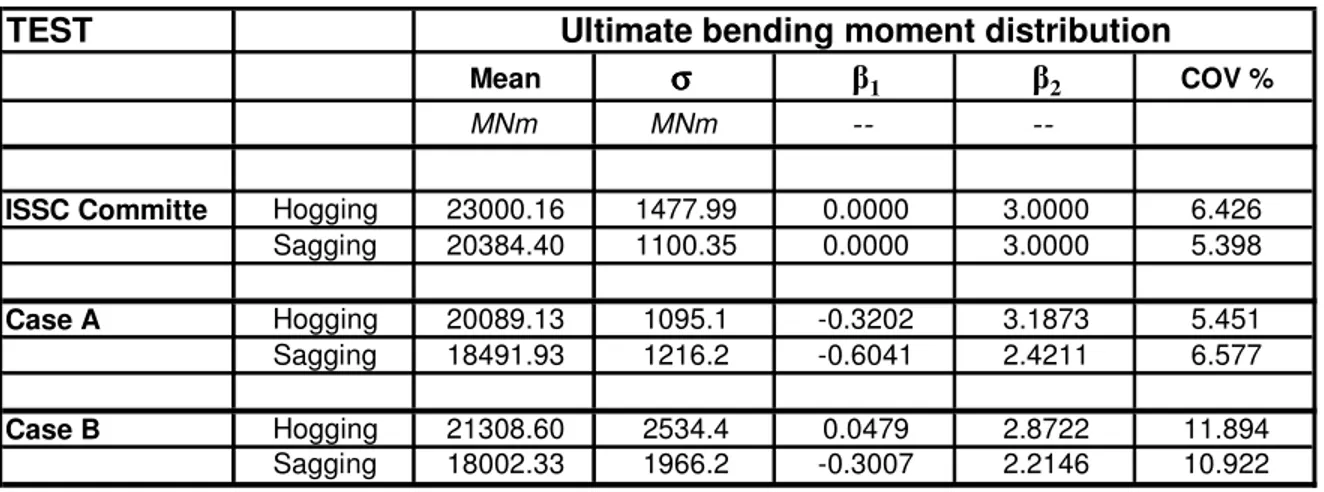
The results and a comparative analysis are presented in Table 2.
Variables
mean σ % β1 β2 mean σ % β1 β2 mean σ % β1 β2
Plates thickness Nominal 0.60 -- -- Nominal 0.60 0.00 3.00 Nominal 0.60 0.00 1.80
Stiff. Thickness Nominal 0.60 -- -- Nominal 0.60 0.00 3.00 Nominal 0.60 0.00 1.80
Yield stress (mild steel) 29.00 9.00 -- -- 29.00 9.00 0.00 3.00 29.00 9.00 0.00 1.80
Yield stress (HT32) 37.00 7.00 -- -- 37.00 7.00 0.00 3.00 37.00 7.00 0.00 1.80
Yield stress in Kgf/mm²
Table 1 : statistical moments of input variables distributions
ISSC Committee Case A Case B
TEST
Mean σ σ σ σ β1 β2 COV %
MNm MNm --
--ISSC Committe Hogging 23000.16 1477.99 0.0000 3.0000 6.426
Sagging 20384.40 1100.35 0.0000 3.0000 5.398
Case A Hogging 20089.13 1095.1 -0.3202 3.1873 5.451
Sagging 18491.93 1216.2 -0.6041 2.4211 6.577
Case B Hogging 21308.60 2534.4 0.0479 2.8722 11.894
Sagging 18002.33 1966.2 -0.3007 2.2146 10.922
Table 2 : Comparative analysis on ultimate strength distributions
The differences of mean value between ISSC Committee method and the one proposed in this paper are mainly due to the load-shortening model. We must mention that the model adopted for PRO-HULLST does not consider explicitly initial imperfection and neither correction or model uncertainty parameter was used for this application. As expected, the coefficient of variation increases significantly for Case B, when a uniform distribution is used for plate thickness. In Case A, we remark a higher COV for sagging test.
Skewness and kurtosis are very sensitive to input variables distribution. Following Pearson & Hartley System, the Case A-hogging is close to a log-normal left dissymmetrical function, while in the Case A-sagging a four-parameters beta function should be used. The same function is recommended for Case B-Sagging. Only the Case B-Hogging is close to a symmetrical Gauss distribution.
CONCLUSIONS
The paper presents a methodology to take into account ultimate longitudinal strength parameter uncertainty using a progressive collapse structural model. The method has been tested on VLCC “Energy Concentration” case study. It was shown that skewness and kurtosis give important information concerning ultimate strength distribution shape which is a crucial aspect of reliability analysis of ship structure.
Some improvements of the proposed method are ongoing at University of Liege. The main direction of the research is to take into account the model uncertainty. First results are already published in [6].
REFERENCES
[1] Prodeedings of 14th international Ship and Offshore Structure Congress (ISSC) 2000, “Report of Special Task Committee IV.2”, Elsevier, p321-392
[2] Moan, Amlashi, Dong 2005- “Critical Assessment of ultimate hull girder capacity of ships from a reliability point of view”, IMAM 2005 Proceedings, v1,p477-486
[3] Teixeira, Guedes Soares 2005- “Assessment of partial safety factors for the longitudinal strength of tankers”, IMAM 2005 Proceedings, v2,p1601-1610
[4] Yao, Nikolov 1991- “Progressive Collapse Analysis of Ship’s Hull under Longitudinal Bending”, The Society of Naval Architects of Japan, v170 , p 449-461
[5]Bureau Veritas “Rules for the classification of steel ships” – April 2005 edition.
[6] Toderan, Caprace, Richir, Rigo 2006 «Ultimate Strength of Stiffened Panels Assesment Taking into Account Model Uncertainty », OMAE2006, - to be published
[7] P. Rigo, C. Toderan, T. Yao, « Sensitivity Analysis on Ultimate Hull Bending Moment », PRADS 2001, Shanghai, China, Sept. 2001
[8]J.Y. Pradillon, T. Quesnel, C. Toderan, Ph. Rigo, «Ultimate Strength of Longitudinally Stiffened Panels: Multi- Criteria Comparative Analysis», PRADS 2001