Activity recognition for anomalous situations
detection
Hela Sfar, Amel Bouzeghoub, and Nathan Ramoly CNRS Paris Saclay, Telecom SudParis, SAMOVAR, France
[email protected] Abstract -
As the world population is growing older, more and more peoples are facing health issues. For elderly, leaving alone can be tough and risky, typically, a fall can have serious consequences for them. Consequently, smart homes are becoming more and more popular. Such sensors enriched environment can be exploited for health-care applications, in particular Anomaly Detection (AD).
Currently, most AD solutions only focus on detecting anomalies in the user daily activities while omitting the ones from the environment itself. In this paper, we present a novel approach for detecting anomaly occurring in the home environment during user activities.. We propose an application of the Markov Logic Network to classify the situations to anomaly classes. Our system is implemented, tested and evaluated using real data obtained from the Hadaptic platform. Experimental results prove our approach to be efficient in terms of recognition rate.
Keywords: Smart Home, Activity recognition, Anomaly detection, Markov Logic Network.
I. INTRODUCTION
According to a survey from the British Office for National Statistic 1i in 2011--2030, around 53\% of elderly persons in
nine European countries will be living independently. Accordingly, less carefulness and heed are provided to the elderly from their family members.
This missing care may lead to several problems, since senior population is minded to have a more sensitive health and physical conditions.
Over the past few years, technological progress in pervasive computing has enabled the concept of smart homes. Smart homes are aiming to provide an environment for assisted living which enables monitoring of the home contextual information and the resident's in-home activities.
Reliable Anomaly Detection (AD) in daily in-home situations is the most important component of many home health care applications.
In literature, an anomaly is defined as a deviation from the normal behavior [7, 8, 9] Research has emphasized the daily user activities for the normal behavior learning. The normal behavior is, indeed, a model of the usual user activities classified under features using different machine learning techniques [10]. The anomaly is then detected as a deviation
from this model either by the application of logic rules defined by experts, or through the exploitation of methods [11]. As a result, the detected anomaly can be an unusual activity or group of activities that can be analyzed considering some context. However, the anomalies produced by the environment context during an activity occurrence are not tackled in the state of the art. The following scenario illustrates this problematic:
Scenario 1: Patrick is an old poker player living alone in his
smart home. It is Monday, 10am, after watching TV and before lunch, Patrick is cooking in the kitchen as usual. The vent is shut down and all the kitchen windows are closed.
In scenario 1, Patrick risks’suffocation’ as the smoke induced by cooking can't be evacuated: this is an anomalous situation. State of the art approaches for AD are not able to detect such an anomaly since the anomaly is not in the activity (Patrick has done a usual activity) but in the environment. As a matter of fact, classical AD solutions mostly analyze one or sequences of activities and detect deviation from expected activities, not on the context itself. Hence, the activity is considered as the main cause of anomaly. Despite the context being considered in some AD works [12, 13], the focus remains on the activity and not on the context itself as Scenario 1 shows. Moreover, in these works, the context is not enriched enough [7]: they only consider general contextual data such as day, time, etc., but not environment dependent context data, such as the status of the vent in Scenario 1.
In order to tackle this problematic, we propose a new method for AD. The proposal is aimed to detect anomalous situation through activities recognition. It takes as input contextual data then it starts by infer activities then anomalous situations.
A situation is a combination of the environment contextual data with the user activity. The situation is considered anomalous when the contextual data can identify anomalies while an activity is occurring, such as the suffocation anomaly in Scenario 1.
The rest of the paper is organized as follows: Section 2 discusses related work. Section 3 details the activity recognition process. Then, Section 4 explains the anomalous
situations detection. Section 5 reports experimental results. Finally, Section 7 concludes the paper.
I. RELATEDWORK
Previous proposed approaches can be classified into three classes of anomalies: Point, collective, and context anomalies [7].
Point anomalies consider each activity independently and
decide whether it is anomalous or not regarding the normal behavior. For detecting point anomalies, Han and al. [13] use the mean of different features for different activities and apply a classification method to define regular behavior. Then, it looks for anomalous activities based on predefined thresholds of deviation. In [14, 15, 16] authors learn which rooms the resident is in during different times of day.
In [8, 20] the authors propose new systems of anomaly detection concerning mild cognitive impairment. In order to automatically reason with anomalies, they represent them in propositional logic. Then, according to expert defined rules, the anomaly is detected as an activity containing a deviation from the normal behavior.
[9] is an extension of [20] in which the rules describing anomalies are generated automatically through a new classification method.
Collective anomalies consider groups of activity instances
together to determine whether the group is normal or no. To do so, Anderson and al [17] use an automata based approach to define sequence of activities as normal behaviors and learn those behaviors. They also support combining multiple days of activities to detect anomalies that occur over the time. In [12] authors use unsupervised pattern clustering techniques to identify behavior model of the resident. Later, they apply a supervised machine learning method to detect anomalous sequences of activities.
Contextual anomalies consider activities under some context.
Holmes [7] is a typical approach combining point, context, and collective anomalies detection. The considered context in this paper is the day of week. Holmes starts by constructing a hierarchical normal behavior. At its bottom level are the several regular behaviors classified per day. Then, these latter are gathered to model the temporal correlations between activities. After training, the anomalous activities are detected by computing their distance from the normal behavior. Based on the papers we reviewed, all works focus on detecting anomalous user activities. They do not consider more global anomalies (e.g. anomalous situations) that involve the environment itself.
II. ACTIVITYRECOGNITION
After receiving contextual data with uncertainty values that can be produced by the FSCEP system [2, 3] , the activity recognition process is composed of two layers: the Knowledge based layer and the Data driven layer. The
knowledge based layer then represents semantically the incoming sensor data together with their uncertainty values. Afterwards, it infers actions and events from the modeled sensor data and computes their uncertainty's values. The obtained actions and the computed uncertainty values are sent to the data driven layer. The layer is responsible for: (1) classification of the actions into features, (2) classification of the features and actions into activities. In the following, further explanation of each layer is provided.
A. Knowledge Layer
After the modeling of sensor data together with their uncertainty values in ontology, it becomes possible to infer events and actions through ontological reasoning. In the following we show through two examples how to infer events and actions.
γ
se1, se2 ϵ {Sensors} ; t1, t2 ϵ {Time}, and p ϵ {Person} (p hasLocomotion [a Uncertainty; uncertaintyLevel n1; relatedObject SitOn; relatedTime t1; accordingTo se1]˄
(p hasObject [ a Uncertainty; uncertaintyLevel n2; relatedObject Chair; relatedTime t2; accordingTo se2]) → ev(SitOnChair, max(t1,t2), min(n1, n2)) \\
Eample1: Inference of Event with label SitOnChair As we can see, the premise of this rule contains 2 clauses. Each one is a RDF triple representing an uncertain sensor data. The first clause means “the resident p is observed to have the
locomotion SitOn at time t1 with uncertaintyLevel n$1
according to the sensor se2" while the second clause translates
the information "the resident p is observed to get the object
Chair at time t2 with uncertaintyLevel n2 according to the sensor se2". The final timestamp of the event is the maximum
between the timestamp of the two sensor data because the event is occurred with the occurrence of the last required sensor data. The uncertainty value of the event is the minimum between the two uncertainty values of the sensor data. This is obtained thanks the application of the possibility logic [6].
ev(SitOnChair, t1, n1) ˄ ev(PresenceAtKitchenTable, t2, n2) ˄ (t1 ≥ t2) ˄ ((t1-t2) ≤ 5s )
→ ac(SitOnChairAtKitchenTable, t1, min(n1, n2))
Example2: Inference of action with label SitOnChairAtKitechenTable
The previous rules are examples of rules that are managed by the system. However, a set of required rules are defined by experts according to the semantic of the activities to be monitored and the types of sensors in the smart environment. Other rules can be inferred through an ontological inference engine according to the axioms defined in the ontology. The deduced actions are then communicated to the data driven Layer.
B. Data driven Layer
After receiving the set of sensors, this layer is in charge, firstly, to extract features in order to gather the actions according
features. This process is simple performed by the application of the features extraction method that is proposed in [21]. One advantage of this method is to compute a weight for each feature. In this work this weight serves as the uncertainty value of the feature. Afterwards, the features and their actions are classified into activities thanks to the applications of the Dempster Shafer Theory (DS) [22].
In the following we explain how this theory is applied in our work:
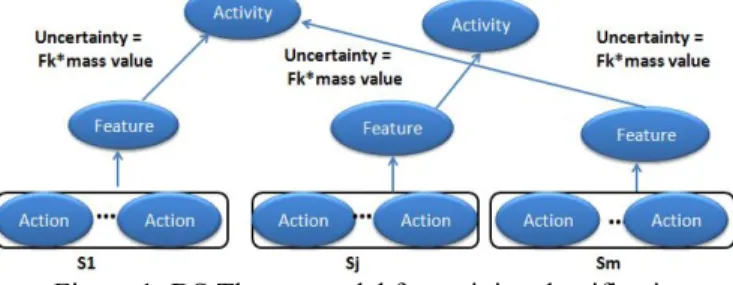
Figure 1: DS Theory model for activity classification In order to classify activities, we propose a new model for the application of the DS theory to classify actions and features into activities. DS has proven to provide decent results in comparison to other machine learning techniques such as J48 Decision Tree [23]. Usually the Directed Acyclic Graph (DAG) is used to represent the source evidences, their hypothesis, the mass functions, the activities, and to support the distribution and the fusion of evidences. In the DAG, evidence sources represent the root nodes at the base of the diagram. Evidence source readings are mapped to one or more hypothesis. Each one in turn will be mapped to one or more activities. In this work, as depicted in Figure1 the DAG is used where each evidence source is a sequence of actions Si which are in the feature vector. Then the hypotheses are the features. The mass function value is the number of the feature’s occurrence whiles the activity execution. These mass function values are discounted by being multiplied with the feature weight value after normalization. This product reflects an uncertainty value about the production of the feature (its weight value) and about the classification of the features into activities (mass value). The finale value of uncertainty is propagated to activities thanks to the DS’s rule of combination [22]. This final value forms the uncertainty value of the matching activity.
III. ANOMALOUSSITUATIONSDETECTION The activities that are produced in the previous stage and additional contextual data are given as input for the anomalous situations detection. . Based on this input, situations are build according to a times window (win). Hence, a situation is a set of contextual data and an activity that are occurred inwin. Then the Markov Logic network (MLN) [5] is triggered in order to classify the situation to anomalous situation classes. In the following more details are given about MLN for situation classification.
A. MLN for anomalous situation classification
MLN is a machine learning method that allows handling uncertainty, imperfection, and contradictory knowledge. Technically, a MLN is a finite set of pairs (Fi; ;wi ); 1 ≤ i ≤n, where each Fi is function-free first-order logic
and wi ϵ R is its weight. Together with a finite set of constants C = {c1...cn} it defines the ground MLN, i.e., the MLN in which logic rules do not contain any free variable. Hence, a MLN defines a log-linear probability distribution over Herbrand interpretations (possible worlds):
Equation 1
Where F is the set of rules in the MLN, ni(x)$ is the number of true groundings of Fi in the possible world x, wi is the weight of Fi, and Z is the normalizing constant.
The MLN model is a non-oriented graph where nodes are predicates and an edge between two nodes means that the two predicates are found in at least one logic rule in the set F. Figure 2 is an example of an MLN representing the three following rules:
Let F = {( F1, w1), (F2, w2), (F3, w3)} the set of rules in the MLN model where:
F1: γ act ϵ Activity, ᴲ x ϵ ElectricDevice, ᴲ l1, l2 ϵ Location
State(x, "ObjectIn", wstate) ˄ State(x, "Hot+", wstate) ˄ LocatedIn(x, l1, wloc) ˄ OccuresIn(act, l2, woccures) ˄ Different(l1, L2, wdiff) →Prediction( act, FireElectricity, pred)
F2: γ act ϵ Activity , ᴲ x ϵ Entrée, ᴲl1 ϵ Location Similar(act, "Sleeping", wsim) ˄ OccuresIn(act, l1,
woccures) ˄ State("Weather", "Cold", wstate) ˄ Access (x, l1, waccess) ˄ State(x, "Open", wstate) → Prediction( <x; hasBinaryProperties; [ <Open; hasValue; w_{Open}>] > Discomfort, ppred)
F3: γ act ϵ Activity, ᴲ x ϵ Entree , ᴲ l1 ϵ Location Requirement (act, "Vent", wreq) ˄ OccuresIn(act, l1, woccures) ˄ Access(x, l1, waccess) ˄
State(x, "Close", wstate) ˄ State("Vent", "Shutdown", wstate) → Prediction(act, <x; hasBinaryProperties; [ < Colse; hasValue; wclose>] >, Suffocation, ppred)
The three rules allow the prediction of three anomaly situation classes: FireElectricity, Discomfort, and Suffocation as depicted in Figure2. The left part of the rules contains predicates representing the input contextual data from the FSEP system and the activities produced from the previous step. For instance the predicate State(x, "ObjectIn", wstate) is
information about the state of x is given with an uncertainty value that is wstate in the predicate.
Figure 2: MLN representing the three rules in the set F However, in the right part of the rules always the predicate
Prediction that classifies the situation (activity and contextual
data) to an anomaly situation class. The weight of this predicate is initially unknown and is computed ate the end of the process.
After the modeling of the MLN model, Ground MLN is created for the rules in the set F. In the Ground MLN all variables are replaced with all possible constants. In the MLN model the values of rules weights (wi) must be given as input. However, in this work we propose a new metric to compute the rules weights based on the weights of theirs predicates:
Equation 2
Where satPij is a predicate in the rule Fi and satisfies Fi. and wsatPij is its weight. ni is the number of predicates in Fi. At this stage, the MLN model is created, the ground MLN also, and the rules weights are computed. Hence, it becomes possible to compute the weights of predicate Prediction in the right part of the rules. To do so, we simply apply this equation:
Equation 3
Where Constantk is the set of constants in the Ground MLN that are in the predicates which have edge with the predicate
Predcitionk. P(x=const) is computed by the application of the
formula in equation1}. The final classification of a given situation is the anomaly situation class that has the maximum weight value in the corresponding predicate Prediction.
IV. EXPERIMENTALEVALUATION
In order to evaluate the proposal, we developed a prototype of it. We have extensively evaluated the proposed method with a dataset acquired out of more of 2 hours of elderly-like routine in the Hadaptic platform3ii. The smart lab is equipped with
motion sensors, beacons, switches, thermometers and more. The system was integrated with a FSCEP implementation, for data acquisition. For this evaluation, a set of logic rules has been defined for three anomalies classes: Intrusion,
Suffocation, and ElectricityFire. Before execution, the system requires the preliminary step in which the value of parameter win, that corresponds to the time window duration of situation, is experimentally chosen. Therefore, we have tested the method with different values of win ϵ [60s...300s]. The constant Z, in equation 1 was set to 10.
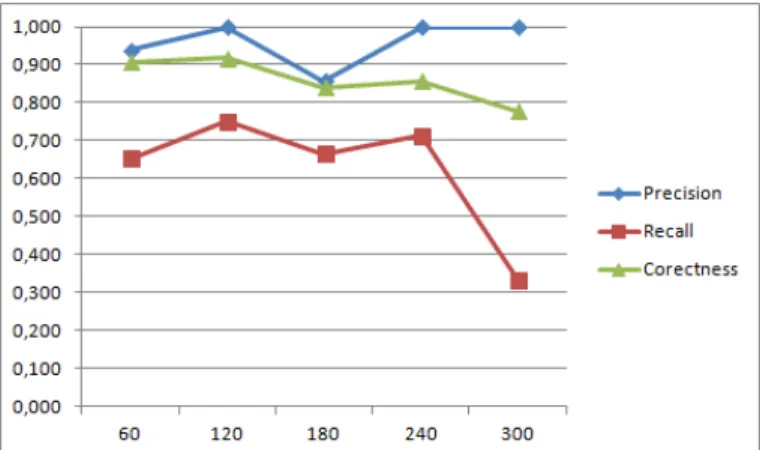
Figure 3: Precision, recall, and correctness of anomalies detection for different time window win
The system was evaluated by comparing its output against expected results. For each time window, the precision and recall of the system was computed. Furthermore, we computed the correctness, which is simply the rate of correct (expected) answers of the system. Figure3 shows the obtained result. As we can see in Figure 3, the system has a high precision for all time windows. This means our system rarely detect untimely events, this is an important feature for the comfort of the user. However, as depicted by the recall, it sometimes misses anomalies, but relatively rarely for time window shorter than 4 minutes. On the overall, we can see that correctness decreases with the size of the time window. This can be explained by the increase of data volume and the time window overlapping multiple activities. This activities overlapping sometimes leads the system to make wrong decisions. As a conclusion, with a suited time window (2 min), the system is highly efficient to recognize anomalous situations.
V. CONCLUSIONAND PERSPECTIVES
In this paper, we proposed a new method for AD particularly for anomalous situation detection. Unlike previous AD methods, the system is able to detect anomalies through contextual data during the user activity occurrence. To do so, it applies the MLN as a machine learning method and proposes a new metric for rules weights computation. . Our experiments
underline the viability of the proposal and its high precision level. Proposing an extension of this system handling dynamic time-windows is one of the future directions.
ACKNOWLEDGMENT
This work has been partially supported by the project COCAPS2iii funded by Single Interministrial Fund N20 (FUI
N20).
REFERENCES
[1] K.K. Tan, Huixing X. Zhou and Tong Heng Lee, “New Interpolation Method for Quadrature Encoder Signals“, IEEE Trans. Instrum. Meas., vol. 51, no.5, pp. 1073-1079, Oct 2002
[2] A. Jarraya, N. Ramoly, A. Bouzeghoub, K. Arour, A. Borgi, B. and Finance. FSCEP: A New Model for Context Perception in Smart Homes. In: OTM Conferences: COOPIS, 2016
[3] A. Jarraya, N. Ramoly, A. Bouzeghoub, K. Arour, A. Borgi, B. and Finance. A Fuzzy Semantic CEP Model for Situation Identification in Smart Homes. In: ECAI, 2016.
[4] K. Zhan, F. Steven, and R. Fabio. Multi-scale conditional random fields for first-person activity recognition. In: PerCom, 2014.
[5] R. Matthew and D. Pedros. Markov logic networks. In: Machine learning, vol.62, 2006
[6] D. Dubois, J. Lang, and H. Prade: Automated Reasoning Using Possibilistic Logic: Semantics, Belief Revision, and Variable Certainty Weights. In: TKDE, vol. 6, 1994
[7] E. Hoque, F.R.Dickerson, and S.M Preum. Holmes: A Comprehensive Anomaly Detection System for Daily In-home Activities. In: DCOSS, 2016
[8] Riboni, D., C. Bettini, G. Civitares,, and Z.H Janjua SmartFABER. Recognizing fine-grained abnormal behaviors for early detection of mild cognitive impairment. In: ARTIF INTELL MED. vol. 67, 2016 \bibitem{sac}
[9] Z.H.Janjua, D. Riboni, and C. Bettini. Towards Automatic Induction of Abnormal Behavioral Patterns for Recognizing Mild Cognitive Impairment. In SAC, 2016
[10] J. Ye, S. Dobson,M. McKeever. Situation identification techniques in pervasive computing: A review. In. Pervasive Mob Comput, vol. 9, 2012 [11] J. Huang, Q. Zhu, and L.Y.J Feng. A non-parameter outlier detection algorithm based on Natural Neighbor. In: KNOWL-BASED SYST, vol.92, 2016
[12] V. Jakkula, and D.J Cook. Detecting Anomalous Sensor Events in Smart Home Data for Enhancing the Living Experience. In: AIII, 2011. [13] Y. Han, M. Han, S.Lee, A.M.J. Sarkar, and Y.K. Lee. A framework for
supervising lifestyle diseases using long-term activity monitoring. In: Sensors, vol.12, 2012.
[14] A. Lot, C. Langensiepen, S. M. Mahmoud, and M. J. Akhlaghinia. Smart homes for the elderly dementia suerers: identication and prediction of abnormal behavior. J Ambient Intell Humaniz Comput, vol.3, 2012 [15] M. Novak, M. Binas, and F. Jakab. Unobtrusive anomaly
detection in presence of elderly in a smart-home environment. In: ELEKTRO, 2012.
[16] M. Novak, F. Jakab, and L. Lain. Anomaly detection in user daily patterns in smart-home environment. In: JSHI, Vol.3, 2013.
\bibitem{faber}
[17] D. Riboni, C. Bettini, G. Civitarese, Z.H Janjua, and R. Helaoui. Fine-grained recognition of abnormal behaviors for early detection of mild cognitive impairment. In. PerCom, 2015.
[18] D. T. Anderson, M. Ros, J.M. Keller, M.P. Cuellar, M. Popescu, M. Delgado, and A. Vila. Similarity measure for anomaly detection and comparing human behaviors. Int. J. Intell. Syst., vol. 27,2012
[19] H. Chen, W.S. Ku, H. Wang, L. Tang, and M.T. Sun. Scaling up Markov Logic Probabilistic Inference for Social Graphs. In: TKDE, vol. 29, 2016.
[20] D. Riboni, C. Bettini, G. Civitarese, Z.H Janjua, and R. Helaoui. Fine-grained recognition of abnormal behaviors for early detection of mild cognitive impairment. In. PerCom, 2015.
[21] Chatapuram Krishnan, N., and J. Cook, D.: Activity recognition on streaming sensor data. In. Pervasive and Mobile Computing, vol. 10, pp. 138–154. Elsevier (2014)
[22] Lotfi, A., Z., A Simple View of the Dempster-Shafer Theory of Evidence and its Implication for the Rule of Combination. In: AI magazine. vol. 7, pp. 85--90. ACM (1986).
[23] Sebbak, D., Benhammadi, F., Chibani. A., Amirat, Y., and Mokhtari, A.:Dempster–Shafer theory-based human activity recognition in smart home environments. In. Ann.
i http://www.cairn-int.info/focus-E_POPU_704_0789--who-will-be-caring-for-europe-s-dependen.htm ii http://hadaptic.telecom-sudparis.eu/