HAL Id: hal-00271682
https://hal.archives-ouvertes.fr/hal-00271682
Submitted on 9 Apr 2008
HAL is a multi-disciplinary open access
archive for the deposit and dissemination of
sci-entific research documents, whether they are
pub-lished or not. The documents may come from
teaching and research institutions in France or
abroad, or from public or private research centers.
L’archive ouverte pluridisciplinaire HAL, est
destinée au dépôt et à la diffusion de documents
scientifiques de niveau recherche, publiés ou non,
émanant des établissements d’enseignement et de
recherche français ou étrangers, des laboratoires
publics ou privés.
Molecular dynamics of 4-n-cyano-4’-octylbiphenyl.
Ronan Lefort, Denis Morineau, Régis Guégan, Claude Ecolivet, Mohammed
Guendouz, Jean-Marc Zanotti, Bernhard Frick
To cite this version:
Ronan Lefort, Denis Morineau, Régis Guégan, Claude Ecolivet, Mohammed Guendouz, et al..
Inco-herent Quasielastic Neutron Scattering Study of Molecular dynamics of 4-n-cyano-4’-octylbiphenyl..
Physical Chemistry Chemical Physics, Royal Society of Chemistry, 2008, 10 (20), pp.2993-2999.
�10.1039/b718003a�. �hal-00271682�
ARTICLE
www.rsc.org/[journal] | [journal name]Incoherent Quasielastic Neutron Scattering Study of Molecular
dynamics of 4-n-cyano-4’-octylbiphenyl.
Ronan Lefort*
a, Denis Morineau
a, Régis Guégan
b, Claude Ecolivet
a, Mohammed Guendouz
c, Jean-Marc
Zanotti
dand Bernhard Frick
e5
a Institut de Physique, UMR-CNRS 6251, Campus de Beaulieu, 35042 Rennes cedex, France. Fax: +(33)2 23 23 67 17; E-mail: ronan.lefort@univ-rennes1.fr
b Institut des sciences de la Terre, 1A, rue de la Férollerie, 45071 Orléans cedex 2, France
c Laboratoire d’Optronique, FOTON, CNRS-UMR 6082, Université de Rennes 1, F-22302 Lannion Cedex, France d Laboratoire Léon Brillouin (CEA-CNRS), F-91191 Gif-sur-Yvette Cedex, France
10
e Institut Laüe-Langevin, 6 rue Jules Horowitz, F-38042 Grenoble, Cedex 9, France
†Electronic Supplementary Information (ESI) available:. See http://perso.univ-rennes1.fr/ronan.lefort
Receipt/Acceptance Data [DO NOT ALTER/DELETE THIS TEXT] Publication data [DO NOT ALTER/DELETE THIS TEXT] 15
DOI: 10.1039/b000000x [DO NOT ALTER/DELETE THIS TEXT]
We report incoherent quasielastic neutron scattering experiments on the thermotropic liquid crystal 4-n-cyano-4’-octylbiphenyl. The combination of time-of-flight and backscattering data allows analyzing the intermediate scattering function over about three decades of relaxation times. Translational diffusion and uniaxial molecular rotations are clearly identified as the major
20
relaxation processes in respectively the nanosecond and picosecond time scales. The comparison with literature data obtained by other techniques is discussed.
At present, some most challenging issues are related to the physical properties of interfacial and nanoconfined fluids, with a special interest towards the structural relaxation
25
processes (with its cooperative character1) and the glassy dynamics of confined liquids2, 3.Whereas the case of simple liquids has been extensively investigated3, many aspects of the dynamical behaviour of more complex nanoconfined fluids, like binary systems or anisotropic phases, still remain
30
up to now unclear. Progresses in this field require a prior comprehensive characterization of the microscopic relaxation processes that occur in the bulk system. Very recently, the question of the universality of the structural relaxation of supercooled liquids and isotropic liquid crystals has been
35
raised, and a unified description in terms of a hierarchical sequence of local and collective processes has been proposed4,
5
. Despite their apparent higher level of complexity, mesogenic fluids can therefore be considered as exceptional reference systems in order to investigate the behaviour of
40
individual molecular relaxation processes as a function of temperature, external field or confinement.
Cyanobiphenyls (nCB) are liquid crystals which physico-chemical properties have been extensively studied, partly because several members of this family can develop nematic
45
phases at room temperature, and enter the composition of displays, or electro-optic devices6. Within this series, 4-n-cyano-4’-octylbiphenyl (8CB) holds a particular place, as it presents archetype isotropic to nematic and nematic to smectic A phase transitions. These remarkable features have
50
been used in many experimental studies as reference observables, and followed during the application of external parameters such as spatial microconfinement7-9, surface interaction10, 11, or magnetic fields12. In particular, the dynamic behaviour of nanoconfined 8CB has recently raised a
55
considerable interest13-16, and a very special attention is paid to the understanding of quenched disorder effects on the collective and local molecular dynamics17-23.
All these studies rely however only on a fractional knowledge of the actual molecular dynamics of unconfined
60
8CB. Whereas several studies like dielectric spectroscopy14, 24,
25
or light scattering26, 27 have focused on reorientational molecular modes, the translational self-diffusion tensor could be reported by resonance techniques28. However, these techniques are mode selective, and the time windows they can
65
access differ by orders of magnitude. As a consequence, it remains difficult to bridge all pieces of information, and make sure that every essential feature of the liquid crystal relaxation is discovered. Surprisingly, very few incoherent quasielastic neutron scattering (IQNS) results were reported on
70
cyanobiphenyls29, 30, whereas numerous data already exist for many other liquid crystals31-38.
The aim of this article is to provide a consistent picture of the microscopic relaxation modes, which contribute to the neutron intermediate relaxation function of bulk 8CB. An
75
analytical model is built in order to disentangle the different active degrees of freedom and extract a limited numbers of relevant parameters. This comprehensive description should provide a valuable starting point towards the understanding of the origin of the very different microscopic dynamics of 8CB
80
in complex environments reported recently.
The analysis by IQNS of the molecular dynamics of 8CB is performed from the picosecond to the nanosecond time scale in its isotropic and smectic A phases, the manuscript being organized as follows: after a brief description of the
85
experimental procedure, we discuss the information obtained by high resolution backscattering IQNS. In a second part, it is completed at short times by time-of-flight data, in order to
unravel the nature of the fast molecular dynamics by analyzing the full intermediate scattering function over more
90
than three decades of correlation times.
Experimental and technical details
Samples and Neutron scattering experiments
Fully hydrogenated 8CB was purchased from Aldrich and
95
used without further purification. It undergoes with increasing temperature the following sequence of phases: crystal (K), smectic A (A), nematic (N), and isotropic (I) with the transition temperatures: TKA = 294.4 K, TNA= 305.8 K, and TNI= 313.5 K.
100
Quasielastic neutron scattering experiments were carried out on the time of flight (TOF) spectrometer MIBEMOL at the Laboratoire Léon Brillouin (LLB) and the high resolution backscattering (BS) spectrometer IN16 at the Institut Laüe Langevin (Grenoble). The contribution from the incoherent
105
cross section of the hydrogen atoms corresponds to 89% of the total scattering cross section of one 8CB molecule, so that the contribution to the measured scattering intensity from other atoms and from diffuse coherent scattering can be neglected within a good approximation. The coherent contribution
110
associated to the Bragg reflection in the smectic A phase arises at Q=0.19 Å-1. In order to avoid contamination of the incoherent data by this smectic peak, only the Q range above 0.5 Å-1 was retained in the IQNS experiments. The time of flight MIBEMOL spectrometer allows one to probe a large
115
energy transfer range with a relaxed resolution (FWHM) of 107 µeV at the elastic position for an incident wavelength of 6 Å. The elastic q range covered by MIBEMOL in this configuration extends from 0.45 to 1.95 Å−1. The typical time
window probed by these TOF experiments was about 1 to 20
120
ps. A standard configuration of the IN16 spectrometer was chosen with Si (111) monochromator and analyzers in backscattering geometry, which corresponds to an incident wavelength of 6.271 Å and results in a full width at half maximum (FWHM) energy resolution of 0.9 µeV. The
125
dynamical range is 15 µeV with a q range between 0.2 and 1.9 Å-1, corresponding to a typical time window of about 1 to
10 ns. A cryoloop and a cryofurnace were respectively used on MIBEMOL and IN16 spectrometers in order to regulate the sample temperature in a range from respectively 100 to 340 K
130
or 10 to 340 K. For the time-of-flight experiments, the sample holder was made of a folded 2 cm² aluminium sheet of slab geometry. For the backscattering experiments, the 8CB was deposited as a cylindrical film maintained in an ILL aluminium cell made of two interpenetrating hollow cylinders.
135
In both cases, a large surface to volume ratio of the sample was completed, in order to maximize the matter volume in the neutron beam while minimizing multiple scattering. No macroscopic preferential orientation of the anisotropic phases of the liquid crystal was induced by the sample containers.
140
The spectrometer resolution functions RBS(Q,) for BS and RTOF(Q,) for TOF were measured on the sample at 10K and
100 K, respectively.
Brillouin scattering experiments
Brillouin scattering was performed with a triple pass tandem
145
of Fabry–Perot (Sandercock model) with a Kr+
ion laser (Coherent) at a wavelength of 647 nm. At too high counting rates a shutter obturates the photomultiplier inducing discontinuities in the spectra. Typical depolarized spectra of 8CB were accumulated over several hours, and reported
150
elsewhere20. They do not show, as expected, any Brillouin doublet, but allow the best observation of the quasielastic region. They were fitted by an apparatus function convoluted to a lorentzian quasielastic line.
IQNS data processing and fitting
155
Standard data corrections (empty cell substraction, self-absorption) were applied using conventional programs provided at ILL (SQW) and LLB (QENSH). TOF and BS data were partially averaged over groups of detectors following standard procedures in order to improve the final statistics.
160
Consequently, same average values of the transfer vector of approximately Q = 0.5, 1 and 1.5 Å-1 were retained for the two spectrometers. For TOF data, these three Q values were obtained by averaging spectra from 2 angles from respectively 23.5° to 27.5°, 52.6° to 57.6° and 84.5° to 95.5°.
165
Within these groups, the energy dependence of the Q vector does not exceed 5% of the elastic value in the quasielastic region of interest, and interpolation of the data at constant Q is therefore unnecessary. For BS data, they were obtained by averaging spectra from respectively 25° to 38°, 57.5° to 70.5°
170
and 90° to 103°. The resulting effective Q resolution was about Q/Qelastic = 10% for both TOF and BS.
The fitting of TOF and BS scattering functions S(Q,) in the frequency domain was completed using the programs provided respectively by the LLB (QENSH) and the ILL
175
(online version of PROFIT). It was achieved using a standard empirical function made of the sum of one elastic peak (resolution limited) and several lorentzian lines. Time domain intermediate scattering functions F(Q,t) at a given temperature were obtained by inverse Fourier transform (IFT) of the
180
frequency domain data restrained to the quasielastic energy window (whole range EBSwindow = 15µeV for BS and
ETOFwindow = 6 meV for TOF, constructed from the -6 to +1.4
meV data range combined with the symmetrization to positive energies of the -6 to -1.4 meV data range). The result of the
185
IFT was deconvoluted from the apparatus resolution following equation 1 (sp=BS or TOF): ( , ) ( , ) ( , ) sp sp sp IFT S Q F Q t IFT R Q
(1)All data points calculated for times larger than the spectrometers resolutions were discarded (t > h/Espresol). Also
short time cut-offs were used, discarding data points possibly
190
artefacted by the truncation of the frequency domain data to the quasielastic region (t < h/Espwindow)39. Following these
filters, final time domain data extend from 0.6 to 20 ps for the TOF region (resp from 0.15 to 2 ns for the BS region).
Results and discussion
195
Figure 1 shows typical BS spectra measured at T = 296 K in the smectic A phase of 8CB. All these spectra are significantly broader than the resolution of the spectrometer
200
(no elastic peak is present). This feature was observed at all temperatures, either in the isotropic, nematic, or smectic A phase. This lack of elastic intensity is a direct proof that the molecular dynamics experiences a complete loss of correlation on the time and space scale of the experiment, and
205
indicates molecular displacements larger than c.a. 15 Å on the nanosecond time scale. This non localized character of the dynamics, together with the increase of the spectral linewidth with Q, suggests that molecular self-diffusion is the dominant relaxation mechanism revealed by the BS experiment. If this
210
was the only molecular relaxation mode present, the normalized incoherent scattering function would simply write:
2 2 2 2 1 ( , ) ( ) BS trans DQ S Q DQ
(2)This situation was indeed not observed for 8CB, for which a single lorentzian line was not enough to describe all BS spectra with a satisfactory agreement, except for temperatures
215
above 310 K (isotropic phase). One possible origin of this non lorentzian shape would be the expected anisotropic character of the self diffusion28, 40 occurring for T < TNI. The
anisotropic character of the diffusion is commonly quantified by the coefficient = (D// -D)/D , where the parallel symbol
220
refer to the main principal axis of the diffusion tensor, often assumed to be aligned with the nematic director in case of liquid crystals. In that case, Dianoux et al. have shown36 that the powder averaged quasielastic response of the anisotropic diffusion model all the more departs (is more peaked) from a
225
pure lorentzian shape as the anisotropy coefficient is far from zero. All attempts to fit our data over the whole spectral range with this scattering law failed whatever the temperature, unless assuming an unphysical value of the anisotropy parameter close to = -1, which would correspond to a
230
purely bidimensional self-diffusion, either perpendicular to the director in the nematic phase, or confined within the smectic layers in the smectic A phase. To our knowledge, such 2D diffusion mechanism has never been observed for bulk nematogens, and would be in strong contradiction with
235
the direct pulsed field gradient (PFG) NMR measurements of the molecular self-diffusion tensor of 8CB40, which reported +0.6 < < +1 on larger time ( ms) and space ( µm) scales than neutron scattering.
This gives strong indication for at least one additional and
240
faster molecular relaxation process contributing to the BS window, leading to the non lorentzian shape of the incoherent scattering response of 8CB and making therefore very difficult to analyze the exact value of by IQNS. A most simple suitable model is constructed from the assumptions
245
that : i) there is only one additional relaxation mode, ii) this mode is independent of the translational diffusion, iii) this mode has a localized character, then the incoherent scattering law can be classically approximated by the convolution product :
250
Fig. 1 Incoherent quasielastic spectra of 8CB measured at T = 296 K on
the high resolution backscattering spectrometer IN16 (ILL – Grenoble). The resolution function of the apparatus is displayed as a filled gray shape. The solid lines are best fits of the data (see text.) using a two components model (dashed lines).
,
,
( )
1
( )
,
BS BS total trans BS locS
Q
S
Q
A Q
A Q Sq
Q
(3)In equation 3, the spatial restriction of the secondary motion gives rise to an elastic peak, which integrated intensity lead to the elastic incoherent structure factor (EISF) A(Q). Its characteristic frequency is quantified by the linewidth 2(Q)
of the quasielastic part SqBSloc(Q,). An usual model free
255
approach consists in assuming that this function is also a lorentzian line. Then equation 3 simply predicts the whole spectrum to be the sum of two lorentzians with integrated intensities Itrans and Iloc and with respective HWHM
linewidths 1(Q) and 1(Q)+ 2(Q). The solid lines in figure 1
260
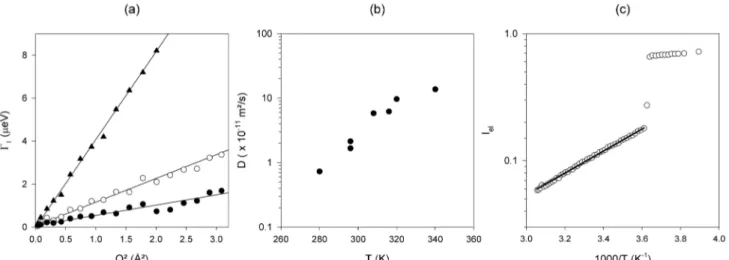
show the best fit of the data using equation 3 convoluted with the spectrometer resolution function. The agreement with the experiment is satisfactory owing to the statistical confidence interval of the neutron counts. Figure 2(a) displays the momentum transfer dependence of the linewidth 1(Q) of the
265
thinnest line for three different temperatures at 315 K, 296 K and 280 K corresponding respectively to the isotropic, smectic and supercooled smectic phases. It shows a very clear linear behaviour with Q² over the whole Q range covered, in thorough agreement with equation 2. This is a direct proof
270
that this line has to be assigned to a non restricted translational self-diffusion motion. From the slope of these curves, an effective diffusion coefficient D can be extracted, which values are plotted in figure 2 (b). They are in very good agreement with the isotropic average values Diso=(D//+2D)/3
275
found by PFG NMR on a much larger lengthscale40 (from 5 10-11 m2/s at 320 K to c.a. 6 10-12 m2/s at 280 K). This is a strong indication that the relaxation mechanism governing translational self-diffusion at the molecular level as measured by IQNS already holds the characteristic dynamic features
280
that gives rise to the long range molecular transport on longer times scales. No discontinuity of D is detected within the accuracy of the IQNS experiment at the isotropic-nematic and neamtic-smectic phase transition temperatures, which is also in agreement with the temperature dependence of Diso as
285
measured by PFG NMR. The activation barrier associated to translational self-diffusion can be determined with a good confidence from the temperature dependence of the integrated
incoherent elastic intensity19. This can be achieved experimentally by switching off the Doppler machine of the
290
BS spectrometer. In that case, only the elastic part SBStotal(Q,=0) is measured, within the spectrometer energy
resolution. Assuming the second process is significantly faster than the translational diffusion, then the condition SqBSloc(Q,=0) <<S
BS
trans(Q,=0) is fulfilled, and equation 3
295
can be approximated by dropping the contribution of the second quasielastic term : SBStotal(Q,=0) A(Q)/(DQ²). If
additionally this intensity is summed over all available detectors, the final measured value obeys equation 4,
where B is temperature independent, which is expected if the
300
geometry of the motion does not change with temperature. Figure 2 (c) shows the Arrhenius plot of Iel(T), which remains
fairly linear over 340 K down to crystallization that results in a sudden discontinuity of the data. From the slope of this graph, an activation energy of 38.3 kJ/mol is deduced, in
305
perfect agreement with PFG NMR data40 (also 38.3 kJ/mol). Figure 3 shows the Q dependences of the linewidth 2(Q)
of the second mode in the smectic phase of 8CB, as deduced from the comparison of the data with equation 3. In contrast with 1(Q), 2(Q) does not vanish for Q²0, and displays
310
only weak variations, often encountered for molecular rotational motions. For higher temperatures (nematic or isotropic phases), 2(Q) is not shown because its evaluation is
questionable: 1(Q) becomes close to 2(Q) (5 to 6 µeV),
which makes very difficult to disentangle the two modes..
315
An unambiguous assignment of this second quasielastic line to a given relaxation mechanism is hardly possible from BS experiments only. An extensive analysis of the relaxation processes up to higher frequency is required, as performed in the next section by the combination of BS and TOF.
320
Reference to previous IQNS studies conducted on a large variety of mesogenic phases31, 34, 38, 41, including few neutron
Fig. 2 : Analysis of the slow component measured in the backscattering spectra of 8CB. (a) HWHM linewidth of the thinnest quasielastic line versus
momentum transfer squared at 315K (triangles), 295K (open circles) and 280K (filled circles). The solid lines are best linear fits following 1 = D.Q². (b)
Effective self-diffusion coefficients determined from the linear fits of (a). (c) Arrhenius plot of the elastic intensity (resolution limited) integrated over all accessible Q values. The solid line is the best fit according the Arrhenius law Iel exp(-EA / RT).
, 0
BS el totalB
I
T
S
Q
dQ
D T
(4)scattering experiments devoted to the family of cyanobiphenyls29, 30, confirms the possible contribution of several relaxation mechanism to the IQNS spectra of 8CB. A
325
general observation common to the nCB series is the occurrence of molecular dimerization at least in the nematic and smectic phases, leading to slower dynamics than other rod-like LCs, and to a pronounced translational-rotational decoupling30, 31.
330
Slow librational motions or flips around short molecular axis have been reported by dielectric relaxation experiments or analyzed by molecular dynamics simulations42, with typical correlation times ranging from 1 to 10 ns. These are much slower than 2(Q) and are not likely to contribute to the BS
335
spectra. On the contrary, chain-ends dynamics are expected to be much faster (around the picosecond time scale), and as it has been shown for other liquid crystals33, they can be in a
first approximation included in the Debye-Waller prefactor describing the small amplitude vibrational motions33, 37.
340
Several optical techniques26, 27 have reported that the molecular rotations along the 8CB long molecular axis occur with a characteristic time between 20 and 40 ps. This result was also confirmed in our group by Brillouin scattering experiments20. Such molecular reorientations are only 3 to 5
345
times faster than the BS window and could therefore contribute by the low frequency part of their spectral density.
Time domain analysis of combined Time-of-flight and Backscattering data: the intermediate incoherent scattering
350
function of 8CB
In order to combine experimental data acquired on different energy range, a time domain analysis has been preferred by calculating the intermediate scattering function Fsp(Q,t) according to equation 1. This is a standard way to circumvent
355
problems related to the convolution of the experimental spectra with very different energy resolution functions. The benefit of such a procedure has been proved by previous studies of the relaxation of polymers or glass-forming liquids43-45 over several decades of relaxation times.
360
Fig. 3 : HWHM linewidth 2(Q) of the fast mode measured in the
backscattering spectra of 8CB at 296 K (open circles) and 280 K (filled circles).
Figure 4(a) and (b) displays the intermediate scattering functions of 8CB calculated from the combination of TOF and BS measurements at 320 K in the isotropic phase, and at 296 K in the smectic A phase. These relaxation functions decay to zero for sufficiently large values of Q. This complete
365
loss of correlation is expected from the previous analysis of the BS data, as a consequence of self-diffusion. TOF and BS data do join together in a rather monotonous way, and do not reveal any clear multimodal decay. It is a strong indication that the slowest molecular modes that contribute to the TOF
370
region cannot be faster than the self-diffusion process by much more than one decade. This is in full agreement with the
conclusions based on the frequency domain analysis. Another important point is the strong Q dependence of the TOF data, that unambiguously indicates the presence of fast ( ps) and
375
large amplitude motions. These modes could be tentatively assigned to conformational degrees of freedom of the aliphatic chain extremities of the 8CB molecule. Indeed, fixed window scans have already revealed the existence of such mobility down to temperatures as low as 100 K (in the crystal phase),
380
leading to an increased value of the mean squared displacement19. A stronger inflexion of the data at longer times suggest that the another relaxation mode can be suspected in the range from 10 to 100 ps. This is in agreement
Fig. 4 : Time domain analysis of the intermediate scattering function of 8CB. (a) Intermediate scattering function calculated from combined TOF and BS
data at T = 320 K in the isotropic phase of 8CB, at momentum transfer modulus of Q = 0.5, 1 and 1.5 Å-1. The solid lines are best fits according to a model of motion including self-diffusion, uniaxial molecular rotation and fast vibrations (see text). (b) idem at T = 296 K. (c) Correlation time associated to the uniaxial rotation as deduced from the fit of the IQNS F(Q,t) (filled circles) and compared with the values obtained by Brillouin scattering experiments (open circles). The insert displays a typical Brillouin depolarized spectrum measured on bulk 8CB at 20°C. (d) Best fit values of the effective mean square displacement associated to the vibrational part of the model. For each temperature, the three values corresponding to the three values of Q displayed in (a) and (b) are reported.
with the aforementioned uniaxial molecular rotation
385
mechanism, as reported in this range by light scattering techniques. Based on these considerations, modelling of the intermediate scattering functions at different values of Q should therefore take into account at least three contributions: slow translational self-diffusion, uniaxial molecular rotations
390
and large amplitude localized motions. The first mechanism has been very precisely analyzed in the frequency domain and can be therefore tightly constrained in a fitting procedure. The second one is a local process which is associated to an incoherent elastic contribution which structure factor highly
395
depends on the molecular geometry (see Appendix). The most difficult task resides in the proper description of the large amplitude motions revealed by the TOF data. If they are identified to methyl groups rotations and librations of the chain ends, the exact fraction of hydrogen atoms implied in
400
these motions and their correct geometry is not known. Hence, modelling these motions in a realistic way would require either to increase the number of free parameters, or to undertake more experiments on a liquid crystal with selectively deuterated chain ends. None of these procedures
405
would however ensure to provide a more meaningful insight on the fast dynamics of 8CB. Instead, an oversimplified model was used, that identifies these chain end dynamics to vibrational-like motions which the typical amplitude is roughly measured by an effective mean square displacement
410
<u²>.
Following this approximation, a simple model of the intermediate incoherent scattering function can be built, and is presented in full detail in the appendix. In this model, the values of the self-diffusion coefficient D are fixed to the one
415
reported in figure 2(b), and only two independent parameters are then adjusted: the mean square displacement <u²> and the uniaxial rotation correlation time c. Both of these values were
refined independently for each values of Q (and T), although the model predicts they should be Q independent. The results
420
of these best fits are displayed as solid lines in figure 4(a) and (b), and the corresponding values of c and <u²> are displayed
in figure 4(c) and (d) respectively. In figure 4 (c), the average value of c is shown (the values found at a given temperature
for different Q vectors always lied in the domain specified by
425
the error bars). The confidence interval for T = 280, 308 and 340 K is somewhat larger, because only BS data were available for these temperatures. The correlation times associated to Frot(Q,t) as deduced from our IQNS data are shown in figure 4(c) to be in very good agreement with those
430
measured by Brillouin scattering20. This is of course an additional clue that the assignment of this mode to a molecular uniaxial rotation is correct. On the other hand, the model clearly fails to describe the data at very short times. This was indeed expected, due to the very crude
435
approximation used to take chain end motions into account. This weakness can also be seen on figure 4(d), where the effective <u²> values are found very large, and their scattering around the average for certain temperatures are not fully consistent with the Q independence predicted by the
440
model. Here again, this is a clear sign of the existence of large and fast amplitude motions contributing to the TOF window.
However, the overall agreement between the model and the experiment is still very satisfactory, as all essential features of the relaxation are quite well rendered over more than three
445
decades of correlation times. It is noteworthy that this agreement could be reached even with only two free parameters and despite the strong constraints that were imposed on the motions geometry. This finally leads to a very simple physical picture of the molecular dynamics of 8CB in
450
terms of elementary relaxation mechanisms, that is fully and quantitavely consistent with the results reported by light scattering or NMR experiments. Translation and rotation diffusion about the long axis are the dominant relaxation processes. Other relaxation mechanisms, especially
455
“tumbling” or slow librations around short molecular axis, as reported by dielectric spectroscopy14, 24 are probably too slow to contribute significantly to the IQNS intensity29, 30
Conclusions
460
We reported in this paper incoherent neutron time-of-flight and backscattering data probing the molecular relaxation of the liquid crystal 8CB from the picosecond to the nanosecond time scale in its isotropic and smectic A phases. On the contrary to other techniques, IQNS on non oriented samples is
465
not submitted to symmetry or polarization selection rules, and is able to explore in the same experiment all existing relaxation mechanisms. In spite of the resulting complexity of the measured dynamic cross-sections, we were able to analyze the molecular dynamics of 8CB within the frame of a very
470
simple model including three elementary mechanisms: translational self-diffusion (nanosecond time scale), rotation around the long molecular axis (10 ps timescale), and fast large amplitude motions ( picosecond timescale) tentatively attributed to chain end librations and rotations. Here again, we
475
find that this description of the relaxation function of the liquid crystal in terms of identified molecular motions is only possible because the different contributions, especially the rotational and translational parts, are well separated in time. One advantage of such description is to end up with a very
480
simple analytical model able with a minimum set of parameters to reproduce the experimental observations, and that can be straightforwardly transferred to situations where the liquid crystal is submitted to external variables (confinement, solid-liquid interface, external field…),
485
providing a new insight into the molecular dynamics of fluids in complex geometry.
Appendix
Assuming that the molecular relaxation processes are independent vibrations, uniaxial rotation of the 8CB molecule
490
around its long axis and molecular self-diffusion, the total incoherent intermediate scattering function writes:
In equation 5, D is the self-diffusion coefficient and Frot(Q,t) is the intermediate scattering function for a uniaxial rotation.
2 2
2,
exp(
)
rot,
exp(
)
Once properly averaged over the 8CB molecular geometry,
495
Frot(Q,t) can be characterized by a single independent correlation time c. The intermediate scattering function of a
single atom i involved in random jumps between N equivalent sites on a circle of radius ai is given by41, 46 :
500
where the EISF Ai(Q) and the quasielastic structure factors Ai,n(Q) are functions of the radius ai of the atom’s trajectory:
where J0(x) is the cylindrical Bessel function of the first kind.
The total intermediate scattering function Frot(Q,t) can therefore be calculated by averaging these quantities over the
505
radii a associated to each of the Na hydrogen atoms of the
8CB molecule:
This procedure allows all geometrical parameters to be fixed in the calculation. The ai radii were calculated using the
molecular geometry of 8CB as reported in its crystal
510
structure47, as the distance between the position of the ith hydrogen atom and the long molecular axis. This axis is defined by the direction passing through the C2 and C11
carbon atoms of the phenyl rings, as illustrated in figure 5. It is likely that the radii for atoms close to the chain end are
515
overestimated, as they probably experience additional large amplitude motions that could on the average bring them closer to the main rotational axis than in the crystal structure. The correlation times n appearing in the exponential series in
520
equation 8 are related by:
Hence, the number of free parameters implied in the model of uniaxial rotation of 8CB can be reduced to a single one (c)
which gives a measure of the rotational diffusion constant
525
(Drot1/c).
Notes and references
1. E.-J. Donth, The Glass Transition, Springer, Berlin, 2001. 2. R. Guégan, R. Lefort, W. Béziel, D. Morineau, M. Guendouz and B.
Frick, European Physical Journal S. T., 2007, 141, 29-34.
530
3. for a review:, Proceedings of the 3rd International Workshop on Dynamics in Confinement, EDP Sciences, Springer, Grenoble, 2007. 4. H. Cang, J. Li, V. N. Novikov and M. D. Fayer, J. Chem. Phys.,
2003, 118, 9303-9311.
5. A. Sengupta and M. D. Fayer, J. Chem. Phys., 1995, 102, 4193-4202.
535
6. France Pat., EP1384111, 2004.
7. G. P. Crawford and S. Zumer, Liquid crystals in complex geometries, Taylor and Francis, London, 1996.
8. I. Vilfan, M. Vilfan and S. Zumer, Phys. Rev. A J1 - PRA, 1989, 40, 4724 LP - 4730.
540
9. S. Qian, G. S. Iannacchione and D. Finotello, Phys. Rev. E J1 - PRE, 1996, 53, R4291 LP - R4294.
10. Y. G. J. Lau, R. M. Richardson and R. Cubitt, J. Chem. Phys., 2006,
124, 234910-234910.
11. E. Lacaze, J. P. Michel, M. Goldmann, M. Gailhanou, M. de Boissieu
545
and M. Alba, Phys. Rev. E, 2004, 69, 041705-041708.
12. J. W. Emsley, J. E. Long, G. R. Luckhurst and P. Pedrielli, Physical Review E, 1999, 60, 1831 LP - 1839.
13. F. M. Aliev, Journal of Non-Crystalline Solids, 2002, 307-310, 489-494.
550
14. F. M. Aliev, Z. Nazario and G. P. Sinha, Journal of Non-Crystalline Solids, 2002, 305, 218-225.
15. S. Frunza, L. Frunza, H. Goering, H. Sturm and A. Schönhals, Europhysics Letters (EPL), 2001, 56, 801-807.
16. N. Leon, J.-P. Korb, I. Bonalde and P. Levitz, Phys. Rev. Lett. J1 -
555
PRL, 2004, 92, 195504-195504.
17. T. Bellini, L. Radzihovsky, J. Toner and N. A. Clark, Science, 2001,
294, 1074.
18. G. S. Iannacchione, S. Qian, D. Finotello and F. M. Aliev, Phys. Rev. E J1 - PRE, 1997, 56, 554 LP - 561.
560
19. R. Guégan, D. Morineau, R. Lefort, A. Moréac, W. Béziel, M. Guendouz, J.-M. Zanotti and B. Frick, Journal of Chemical Physics, 2007, 126, 064902.
20. R. Lefort, D. Morineau, R. Guégan, A. Moréac, C. Ecolivet and M. Guendouz, Philosophical Magazine, 2007, 87, 469 - 476.
565
21. R. Bandyopadhyay, D. Liang, R. H. Colby, J. L. Harden and R. L. Leheny, Phys. Rev. Lett. J1 - PRL, 2005, 94, 107801-107804. 22. T. Bellini, N. A. Clark and D. W. Schaefer, Phys. Rev. Lett. J1 -
PRL, 1995, 74, 2740 LP - 2743.
1 / , 1,
( )
n N t rot i i i n nf
Q t
A Q
A
Q e
(6)
, 0 1 ,01
2
2
sin
cos
N i n i k i ik
kn
A
Q
J
Qa
N
N
N
A Q
A
Q
(7)
1 / 1,
( )
n N t rot i i n nF
Q t
A Q
A Q
e
(8)Fig. 5 : Definition of the long molecular axis of 8CB. The molecular
geometry is taken from the crystal structure47.
2 2
sin
sin
n cN
n
N
(9)23. M. Marinelli, F. Mercuri, S. Paoloni and U. Zammit, Phys. Rev. Lett.
570
J1 - PRL, 2005, 95, 237801-237804.
24. A. Schoenhals, H.-L. Zubowa, R. Fricke, S. Frunza, L. Frunza and R. Moldovan, Crystal Research and Technology, 1999, 34, 1309. 25. M. Y. Jin and J.-J. Kim, Journal of Physics: Condensed Matter,
2001, 13, 4435-4446.
575
26. J. R. Lalanne, C. Destrade, H. T. Nguyen and J. P. Marcerou, Phys. Rev. A J1 - PRA, 1991, 44, 6632 LP - 6640.
27. K. Miyachi, Y. Takanishi, K. Ishikawa, H. Takezoe and A. Fukuda, Phys. Rev. E J1 - PRE, 1997, 55, 1632 LP - 1636.
28. S. V. Dvinskikh and I. Furo, The Journal of Chemical Physics, 2001,
580
115, 1946-1950.
29. D. H. Bonsor, A. J. Leadbetter and F. P. Temme, Molecular Physics, 1978, 36, 1805-1823.
30. A. J. Leadbetter, F. P. Temme, A. Heidemann and W. S. Howells, Chemical Physics Letters, 1975, 34, 363-368.
585
31. A. J. Leadbetter and R. M. Richardson, Molecular Physics, 1978, 35, 1191 - 1200.
32. S. Mitra, K. Venu, I. Tsukushi, S. Ikeda and R. Mukhopadhyay, Phys. Rev. E, 2004, 69, 061709-061708.
33. F. Volino, A. J. Dianoux, R. E. Lechner and H. Hervet, Journal of
590
Physics Colloques, 1975, 36, C1-83.
34. F. Volino and A. J. Dianoux, Phys. Rev. Lett. J1 - PRL, 1977, 39, 763 LP - 766.
35. A. J. Dianoux, F. Volino, A. Heidemann and H. Hervet, Journal de Physique, 1975, 36, L-275.
595
36. A. J. Dianoux, A. Heidemann, F. Volino and H. Hervet, Molecular Physics, 1976, 32, 1521 - 1527.
37. H. Hervet, F. Volino, A. J. Dianoux and R. E. Lechner, Journal de Physique, 1974, 35, L-151.
38. H. Hervet, F. Volino, A. J. Dianoux and R. E. Lechner, Phys. Rev.
600
Lett. J1 - PRL, 1975, 34, 451 LP - 454.
39. J. Wuttke, W. Petry, G. Coddens and F. Fujara, Phys. Rev. E J1 - PRE, 1995, 52, 4026 LP - 4034.
40. S. V. Dvinskikh, I. Furó, H. Zimmermann and A. Maliniak, Phys. Rev. E J1 - PRE, 2002, 65, 061701.
605
41. M. Bée, Quasielastic neutron scattering, IOP Publishing Ltd, Bristol, 1988.
42. M. I. Capar and E. Cebe, Phys. Rev. E, 2006, 73, 061711-061718. 43. A. Schonhals, H. Goering, C. Schick, B. Frick and R. Zorn, Journal
of Non-Crystalline Solids, Proceedings of 3rd International
610
Conference on Broadband Dielectric Spectroscopy and its Applications, 2005, 351, 2668-2677.
44. B. Frick, C. Alba-Simionesco, G. Dosseh, C. Le Quellec, A. J. Moreno, J. Colmenero, A. Schonhals, R. Zorn, K. Chrissopoulou, S. H. Anastasiadis and K. Dalnoki-Veress, Journal of Non-Crystalline
615
Solids, Proceedings of 3rd International Conference on Broadband Dielectric Spectroscopy and its Applications, 2005, 351, 2657-2667. 45. R. Zorn, L. Hartmann, B. Frick, D. Richter and F. Kremer, Journal of
Non-Crystalline Solids, 2002, 307-310, 547-554.
46. J. Dianoux, F. Volino and H. Hervet, Molecular Physics, 1975, 30,
620
1181-1194.
47. M. Kuribayashi and K. Hori, Acta Crystallographica C, 1998, 54, 1475-1477.