HAL Id: hal-00497258
https://hal.archives-ouvertes.fr/hal-00497258
Submitted on 2 Jul 2010
HAL is a multi-disciplinary open access
archive for the deposit and dissemination of
sci-entific research documents, whether they are
pub-lished or not. The documents may come from
teaching and research institutions in France or
abroad, or from public or private research centers.
L’archive ouverte pluridisciplinaire HAL, est
destinée au dépôt et à la diffusion de documents
scientifiques de niveau recherche, publiés ou non,
émanant des établissements d’enseignement et de
recherche français ou étrangers, des laboratoires
publics ou privés.
Simple method to measure laser linewidth using
intensity noise spectrum based on Rayleigh
Backscattering effect
Quoc Thai Nguyen, Pascal Besnard, Laurent Bramerie, Olivier Vaudel,
Gwenaëlle Girault, Yohann Léguillon
To cite this version:
Quoc Thai Nguyen, Pascal Besnard, Laurent Bramerie, Olivier Vaudel, Gwenaëlle Girault, et al..
Simple method to measure laser linewidth using intensity noise spectrum based on Rayleigh
Backscat-tering effect. Conference on Lasers and Electro Optics / European Quantum Electronics
Confer-ence 2009 (CLEO Europe/EQEC 2009), Jun 2009, Munich, Germany. pp.CH.P.9,
�10.1109/CLEOE-EQEC.2009.5196258�. �hal-00497258�
Simple Method to Measure Laser Linewidth Using Intensity Noise
Spectrum Based on Rayleigh Backscattering Effect
Quoc-Thai Nguyen, Pascal Besnard, Laurent Bramerie, Olivier Vaudel, Gwenaëlle Girault, Yohann Léguillon
FOTON – ENSSAT, CNRS UMR 6082, 6 rue de Kerampont, BP 80518, 22305 Lannion Cedex, France
The coherency, which is linked to the spectral linewidth, is an important property of a laser, as it strongly influences the system performances in various domains of application [1]. Several methods have been proposed to measure the laser linewidth, among which the Delayed Self-Heterodyne Technique (DSHT) [2]. In this paper, we propose a novel and simple method to measure the laser linewidth based on Rayleigh Backscattering (RB) effect. Our technique requires relative intensity noise (RIN) measurement. Contrary to DSHT, it avoids the use of an acousto-optic frequency-shifter, which infers the bandwidth detection and of a Mach-Zehnder interferometer.
The system setup is represented in the fig. 1 below. The experiment is essentially composed of a laser to measure the linewidth, a RB emulator and the RIN measurement system. The RB emulator is provided by an optical circulator, 25 km standard single mode fiber (SSMF) and a fibred mirror. At the RB emulator output, the optical signal includes the RB signal due to 25 km SSMF, the reflected signal by the mirror and the interferential signal between the two previously mentioned signals. The power spectral densities (PSD) of the RB signal and the interferential signal are respectively given by two following formulas [3]:
+
∆
∆
+
≈
22
2 2)
(
2
)
(
ω
ω
ω
ω
πδ
ω
b bI
S
(1)(
)
(
2)
2 2 2 2 2 ) ( 2 ) ( r b r b b b r I I I I I S + + ∆ ∆ + + ≈ −ω
πδ
ω
ω
ω
ω
(2)where ∆ω is the full width at half-maximum (FWHM) of the laser source, Ib is the RB intensity, Ir is the reflected
intensity. We found that the PSD of the two signals is approximately identical to the laser spectrum except that its linewidth is twice the laser one. As both the RB and interferential signals are resulting from the interferometric process due to noises at low frequency, the RIN measurement in the low frequency range will give directly the laser linewidth.
The RIN measurement system is essentially composed of a PIN photodiode, for which we exactly know the shot noise. The RF signal visualized on the spectrum analyzer is considered as the total noise. This one is normalized to the photo-current measured by a Pico-ampere meter. The RIN is then calculated by subtracting the thermal noise and the shot noise of the photodiode, to the normalized total noise.
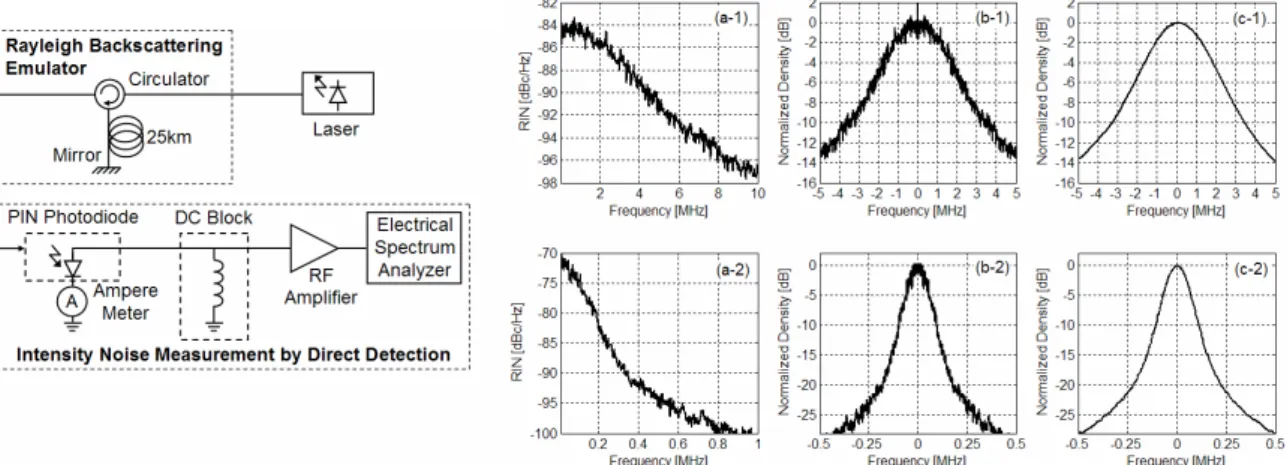
Fig. 1 Sketch of the experimental setup. Fig. 2 The experimental results for 2 types of laser: The RIN spectrum at the RB emulator output (a-1, a-2), the linewidths inferred from the RIN spectrum (b-1, b-2)
and the linewidths measured by the delayed self heterodyne technique (c-1, c-2).
Fig. 2 shows experimental results for two types of laser: A DFB laser with a linewidth of 2.4 MHz (upper curves) and a tunable external-cavity laser (TunicsTM) with a linewidth of 120 kHz (lower curves). The RIN spectrum obtained at the RB emulator output (figure1) are shown in figures 2.a-1 and 2.a-2. The laser lines are inferred by restituting the negative side and dividing the frequency scale by two, from the RIN spectrum, given in figures 2.b-1 and 2.b-2. These linewidths are then compared to those obtained in figures 2.c-1 and 2.c-2, thanks to a commercial delayed-self-heterodyne linewidth test set (Advantest Q73321). The results are in good agreements and show that our all-fibered technique is well suited to study linewidth from 100 kHz to several 100 MHz.
References
[1] Henry, C., Quantum Electronics, IEEE Journal of, vol.18, no.2, pp. 259-264, Feb 1982.
[2] Richter, L.; Mandelberg, H.; Kruger, M.; McGrath, P., Quantum Electronics, IEEE Journal of, vol.22, no.11, pp. 2070-2074, Nov 1986. [3] Gysel, P.; Staubli, R.K., Lightwave Technology, IEEE Journal of, vol.8, no.4, pp.561-567, Apr 1990.