HAL Id: hal-01847577
https://hal.archives-ouvertes.fr/hal-01847577
Submitted on 4 Dec 2018
HAL is a multi-disciplinary open access
archive for the deposit and dissemination of
sci-entific research documents, whether they are
pub-lished or not. The documents may come from
teaching and research institutions in France or
abroad, or from public or private research centers.
L’archive ouverte pluridisciplinaire HAL, est
destinée au dépôt et à la diffusion de documents
scientifiques de niveau recherche, publiés ou non,
émanant des établissements d’enseignement et de
recherche français ou étrangers, des laboratoires
publics ou privés.
A new experimental continuous fixed bed reactor to
characterise wood char gasification
Laurent van de Steene, Jean Philippe Tagutchou, Floriane Mermoud, Eric
Martin, Sylvain Salvador
To cite this version:
Laurent van de Steene, Jean Philippe Tagutchou, Floriane Mermoud, Eric Martin, Sylvain Salvador.
A new experimental continuous fixed bed reactor to characterise wood char gasification. Fuel, Elsevier,
2010, 89 (11), p.3320-3329. �10.1016/j.fuel.2010.03.035�. �hal-01847577�
A new experimental Continuous Fixed Bed Reactor to characterise
wood char gasification
L. Van de steene
a,*, J.P. Tagutchou
a, F. Mermoud
c, E. Martin
a, S. Salvador
baCIRAD-PERSYST, UPR 42 Biomass Energy, TA B42/16, 73 rue JF Breton, 34398 MONTPELLIER Cedex 5, France bRAPSODEE, Ecole des Mines d’Albi-Carmaux, Campus Jarlard, 81013 ALBI Cedex 09, France
cUniversité de Genève, Batelle, Bat D, 7 route de Drize, CH-1227 Carouges, Genève, Suisse, Switzerland
Keywords: Biomass Gasification Fixed bed Char Experimental
a b s t r a c t
Two-stage fixed bed gasification is one of the most promising technologies for low and medium energy production from biomass. In industrial processes, control and optimisation is often based on constructor know-how rather than on an understanding of the mechanisms involved. We present a new original tool, the Continuous Fixed Bed Reactor (CFiBR), which was specifically designed and built to enable a fine understanding of the limiting stage of a gasifier: the char bed gasification zone. The reactor, the instru-mentation, the operating procedure and set-up tests are described in detail. The potential of the reactor is demonstrated through the characterisation of the gasification of a continuous wood char bed. Tempera-ture profiles and gas concentrations along the 65 cm bed were established and showed that the most reactive zone was the first 10 cm of the char bed. Accurate energy and mass balances provided relevant information regarding the contributions of the main reactions involved in the fixed char bed gasification process.
1. Introduction
Gasification has emerged as a clean and effective way to duce gas from biomass. Many designs for gasifier have been pro-posed including fluidised bed reactors, fixed bed reactors and entrained flow reactors[1]. The choice generally depends on the application and the size of the plant.
Staged gasification, as demonstrated by the Viking plant[2]and more recently by Xylowatt technology, has confirmed its potential for low and medium energy production (up to 5 MWth). In such processes, pyrolysis and char gasification stages take place in sep-arate reactors allowing independent control of each major reac-tion. The pyrolysis gases are oxidised in a high-temperature zone where efficient tar cracking can occur. Optimism with respect to staged gasifiers is justified as they produce much less tar than other processes.
In industrial processes, control and optimisation are often based on constructor know-how rather than on an understanding of the mechanisms involved. Many questions remain to be clarified, in particular regarding the gasification stage during which the char is converted into syngas (CO + H2). In this critical zone, many
cou-pled phenomena compete, i.e. heterogeneous and homogenous
chemical reactions, gas flow in porous media and the flow of solid particles, making the fine understanding of this stage of the pro-cess difficult. Moreover char conversion is highly influenced by gasification and combustion kinetics, whose modelling – even if it has been largely studied in the past – remains subject to discus-sion[3].
Most studies on fixed bed gasifiers have focused on the behav-iour of the global process[4–9]and did not pay particular attention to the char gasification zone. Indeed, in updraft or downdraft gas-ifiers, this zone is coupled to the rest of the process, i.e. to pyrolysis and gas oxidation reactions, preventing specific investigation of the behaviour of the zone. A fine description of a downdraft gasifier by Krishnudu et al.[4], was based on the operation of a 1 t/h pilot fed with coal. These authors sampled the solids in the bed after fast cooling in 250 mm sections, and measured profiles of density, granulometric distribution, and coal composition all along the 3 m long reactor. On a batch gasifier, Yang et al.[6]calculated axial temperature and gas concentration profiles and validated them by measurements at the outlet of the bed. Di Blasi [7]developed a model of a continuous updraft gasifier including all the phenomena involved. She validated her model in an experimental reactor that allowed temperature profiles to be measured and the various transformations involved to be located. Thermal characterisation of a continuous bed was undertaken by Lv et al.[8].
But to account for the whole process, modelling of the phenom-ena involved in the char gasification zone requires certain
*Corresponding author. Tel.: +33 (0)4 67 61 65 22; fax: +33 (0)4 67 61 65 15. E-mail address:steene@cirad.fr(L. Van de steene).
assumptions that cannot always be validated. Moreover, modelling requires knowledge of the bed inlet parameters, such as tempera-ture, gas composition, and char flow-rate, which are not accessible in industrial processes.
Few authors focused on the characterisation of the char bed gasification zone isolated from the rest of the process. Bhattach-arya et al.[9]measured the temperature at 10 cm intervals in a fixed bed of coal char but in batch operating conditions. The most relevant study was by Gobel et al.[10]on the two-stage reactor Viking. Their objective was to develop a code to optimise operation and control of their pilot installation. They performed a fine char-acterisation of the fixed charcoal bed by measuring temperature profiles and concentrations of gas species.
The purpose of this work was to characterise wood char gasi-fication stage in Continuous Fixed Bed Reactors. To achieve this
objective, we designed and built new original experimental equipment, which will enable researchers to study the char bed gasification zone separately from the rest of the process. For example, it enables the zones where chemical reactions occur in the bed to be located or the one responsible for pressure drop to be identified. Other information, such as the contribution of each reaction to char conversion and gas production, char veloc-ity, and residence time can also be obtained using this experi-mental equipment.
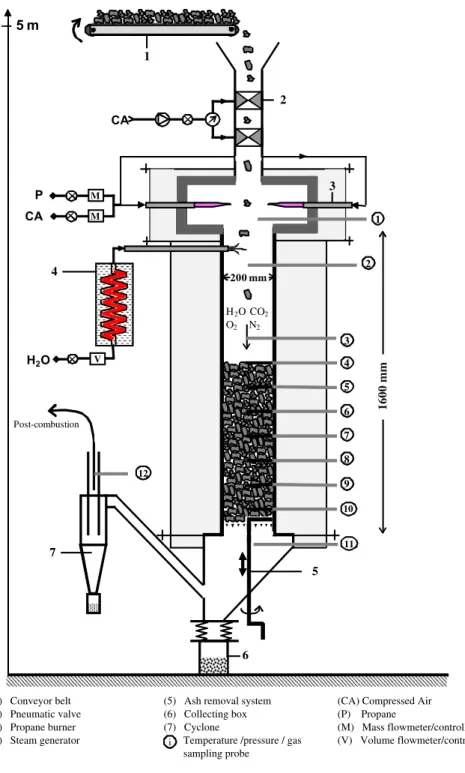
2. Description of the Continuous Fixed Bed Reactor
The Continuous Fixed Bed Reactor, CFiBR, was designed and built at CIRAD (Fig. 1). It consists of a 310 type refractory steel tube
(1) Conveyor belt (2) Pneumatic valve (3) Propane burner (4) Steam generator
(5) Ash removal system (6) Collecting box (7) Cyclone
Temperature /pressure / gas sampling probe
(CA) Compressed Air (P) Propane (M) Mass flowmeter/controller (V) Volume flowmeter/controller i
5 m
CA 2 1 P CA M M 3 H2O CO2 O2 N2 H2O V 4 6 5 Post-combustion 7 200 mm 4 3 5 6 7 8 9 10 2 11 1 12 3 1600 mm(1600 mm long, 200 mm i.d.) surrounded by refractory wool insulation.
The reactor is operated at atmospheric pressure. The atmo-sphere of the reactor, i.e. the reactant gas consisting mainly of H2O, CO2, and O2, in N2, is generated by two 15 kW propane
burn-ers (3). The flow-rates of propane and air fed to the burner are pre-cisely controlled by two (Brooks) mass flow-meters/controllers. The propane/air ratio can be varied to obtain the amount of excess air required and thus to control the oxygen in the reactant gases. No additional air is injected in or above the char bed. Super heated steam can be added downstream from the combustion chamber by a specially designed steam generator/preheater (4).
A conveyer belt (1) enables char to be fed in at the top of the reactor at a flow-rate of between 0 and 3 kg/h. A known mass of char is homogenously distributed on the belt at a controlled veloc-ity. Two pneumatic valves (2) prevent air from entering the reactor during the introduction of char thanks to alternating automated opening and closing cycles.
Inside the reactor, the char settles in a bed that can reach 800 mm in height. The bottom of the reactor is equipped with a 10 mm plate with conical holes and a scraper (5). The scraper is activated manually and enables the solid residue to be removed from the reactor during experiments. The plate is positioned 5 cm above the bottom of the reactor. It can be moved vertically downwards and out of the reactor if a rapid and complete purge of the reactor is required.
Instrumentation is a key point of the equipment. Sampling and measuring probes are located at 100 mm intervals all along the char bed allowing online analysis of temperature, pressure, and gas composition, and trapping of condensates.
2.1. Control of the gasifying stream: temperature and composition In terms of temperature and steam concentration, a wide range of atmosphere can be obtained by adjusting the propane burners and the steam generator.
The gas burners are located in a 500 mm i.d. combustion cham-ber that can withstand temperatures of up to 1300!C. The internal wall is made of high-density refractory wool to reduce preheating time. The flame zone is a concrete envelope with wraparounds that hold the necks of the gas burners. Mixing of the flows from each individual burner is ensured by their opposite and tangential direc-tions which creates a swirl in the combustion chamber. High purity propane and compressed air are fed to the burners and controlled by two mass flow-meters/controllers. In a stabilised regime, the maximum power of each gas burner is 9 kW. This limit is imposed by the temperature at the outlet of the combustion chamber (1080!C) that has to match the temperature limit of the refractory stainless steel reactor. In industrial fixed and staged bed reactors, the oxygen is not completely burnt in the pyrolysis gases oxidation zone and thus some oxygen participates in the reactions in the char gasification zone. In our case, excess air was controlled to provide a gas with 3% of residual oxygen. Consequently, propane and air were adjusted, respectively to 7 Nl/min and 200 Nl/min to satisfy both thermal constraints and the amount of residual oxygen required.
Stoichiometric propane combustion produces fumes with only 13%vol. of steam. This value is low compared with values encoun-tered in industrial gasifiers. The steam generator/super heater can deliver up to 100 g/min steam at 1000!C. It consists of an inconel tube (10 m long, 20 mm i.d.) inserted in a 10 kW electrical furnace. At the furnace outlet the pipe is electrically heated for a distance of 1.2 m to maintain steam at the required temperature before it en-ters the reactor. Consequently the concentration of steam in the reacting gas can be adjusted from 13% to 100% (burners off).
2.2. Feeding the char
Char is fed continuously into the reactor by a 2 m long, 120 mm wide low-velocity conveyor belt able to deliver up to 50 g of solids per minute. A known mass of char is spread out homogenously all along conveyor belt. The homogeneity of the char is ensured by the constant height of the char bed on the belt, which is checked with a calibrated wedge. Conveyor velocity and char height are adjusted to allow the belt to be refilled every 30 min.
The two valves that ensure the gas tightness of the feeding sys-tem are automatically activated each minute. The feeding period is very short compared to the residence time of the char in the reac-tor and feeding can thus be considered to be continuous. These two membrane valves can only withstand a temperature of 80!C. The outside of the feeding pipe between the combustion chamber and the valves is water cooled to avoid overheating of the valves. Stainless steel rotary valves that were supposed to withstand a temperature of 110!C were previously tested and rejected as dila-tation of the balls with the increase in temperature caused the valves to block.
2.3. Control of the process
Controlling the process is a critical point in Continuous Fixed Bed Reactors. The top level of the bed can vary due to three main events: char being fed in at the top, char consumption and compac-tion inside the bed, and removal of solid residues at the bottom. In order to maintain a constant bed height inside the reactor, some authors fixed the solid residue removal flow-rate and varied the in-let char flow-rate[5,11]. This method led to a variation in the ratio char/reactant gas injected in the reactor and for this reason was not used in our experiments. We decided that the process would be operated so as to maintain both the bed level and the feeding char mass flow-rate constant, and that the removal rate of the solid res-idue at bottom would be adjusted.
Given the high-temperatures and dusty atmosphere, detection of bed height during the operation is delicate because laser or infrared methods cannot be used. We tested a sensor method, using a long ceramic pipe without success as touching sensitivity was too weak. In addition, this method is too time consuming dur-ing operation and cannot be automated. Measurement of a pres-sure drop in the meapres-surement is normally used in industrial gasifiers to roughly control the bed height; in our case, the drop in pressure was found to be too small and could not be used as a control parameter. Consequently we tested and validated the tem-perature method. This method consists in using the temtem-perature measured by one of the radial thermocouples (called a bed surface probe) and around which the bed surface is maintained. Practically speaking, a temperature lower than the one given by the thermo-couple located just above the probe means that the bed surface probe is covered by the cold char being fed in. Solid residue is re-moved periodically until the bed level is slightly below the bed sur-face probe, which is confirmed by an increase in the temperature of this probe.Fig. 2shows fluctuations of the bed surface probe (T4).
The solid residue is removed every 10 min. This allows a very low fluctuation of bed level of ±2 cm.
2.4. Instrumentation and analysis
Reactor control and fine characterisation require a large quan-tity of precise instrumentation.
For this purpose, the reactor is equipped with tapping pipes every 10 cm in which sensors or probes can be inserted and moved along. The tapping pipes are positioned spirally to minimise distur-bance of the flow of char by the inserted probes. In the present case, 4 mm o.d. refractory steel sampling pipes were used to
sample gas and measure concentrations. These sampling pipes were also used to measure pressure in the bed at different height. The temperature can be measured, at the same time as the gas is sampled, by 1 mm K-type thermocouples with refractory lining in-serted in each sampling pipe. The thermocouples extend 5 mm be-yond the end of the sampling pipes.
The special probes (thermocouples and sampling pipes) can also be manually moved along the diameter to measure radial profiles of temperature, gas concentration or pressure, at a given height in the char bed. All temperatures are measured simultaneously at the different heights but gas sampling/analysis and pressure mea-surement have to be carried out successively at each location. We checked that the large number of sampling probes did not cause gas leakage: we measured an air leak flow-rate of less than 5% of the inlet gas flow with the reactor at a pressure of 50 mbar.
Regarding the sampling line specially developed, the gases are first cooled in the four impingers filled with isopropanol where the condensates are removed from the gases. Dry gases succes-sively pass through a filter, a silica gel water trap, a gas flow-rate meter/controller and a volumetric total flow counter. Part of the sampled gases are analysed in a micro GC analyser with two col-umns allowing quantification of CO, N2, O2, H2, CO2, CH4, C2H4,
and C2H6. Water and organic compounds accumulated in the
con-densates are measured later in the laboratory. The Karl Fisher tech-nique was used to quantify water content, and GC/MS to identify and quantify organic compounds.
The solid residue is sampled every 10 min at the bottom of the reactor when the solid residue is removed. The mass collected is weighed. Care must be taken to avoid carbon oxidation during re-moval of the solid residue. A very flexible heat resistant pipe con-nects the bottom of the reactor to the collecting box on the balance; nitrogen is injected in this zone.
The mass flow-rate of solid residue can be used to directly cal-culate the char conversion rate following:
X ¼m_charm_res
_
mchar ð1Þ
where _mcharand _mresare respectively the mass flow-rates of the
ini-tial char and of the solid residue collected.
Char conversion is also determined using the ash tracer method based on the comparison of ash content in the initial char and in the solid residue[20]. The following correlation gives the conver-sion rate:
X ¼1 $ Ccharash=Cresash
1 $ Cchar ash
ð2Þ
where Cchar
ash and Cresashare respectively, the ash content in the initial
char and in the solid residue collected.
2.5. Production and characterisation of the fed char
The initial samples used consisted in maritime pine wood chips delivered from Ardeche region (France). Results of proximate and ultimate analyses of the wood, measured in compliance with stan-dards NF EN 1860-2 and XP CEN/TS 15104, are presented inTable 1. The volatile matter percentage was as high as 82.6%, and the ash content of the wood was low: 0.2%.
Char was produced in a screw pyrolysis reactor. This reactor is actually the pyrolysis unit of the CIRAD two-stage gasifier which was disconnected from the rest of the pilot. Using this pyrolysis reactor was a way to ensure the char was representative of that entering the char gasification zone of industrial two-stage gasifiers. The pyrolysis unit is described in detail elsewhere[12]. Briefly, it consists of a stainless steel cylinder provided with a heating sys-tem. The cylinder is horizontal and contains an endless screw.
Pyrolysis operating conditions are known to significantly influ-ence the nature of the char produced[13]. The operating condi-tions for the char production are the following: residence time, 1 h; temperature, 750!C; woodchips flow-rate, 15 kg/h. Readers familiar with two-stage gasifiers will notice that the pyrolysis tem-perature is higher than that recommended in such gasifiers. We intentionally increased the temperature of pyrolysis to reduce residual volatile matter in the char, as its presence would compli-cate this study, which does not focus on tar behaviour.
About 200 kg of char were produced to carry out all the exper-iments and characterisation tests. All the char produced was sieved to remove particles smaller than 1 mm as fine particles, which
Fig. 2. Variations in the temperature of the bed surface probe (T4) and of the other thermocouples.
Table 1
Proximate and ultimate analysis of maritime pine woodchips and char.
Wood Char
Proximate analysis (wt.% on dry)
Ash 0.2 1.4
Volatile matter 82.6 4.9
Fixed carbon (by difference) 17.2 93.7
Ultimate analysis (wt.% on dry)
C 47.4 89.8
H 6 2.2
O 45.1 6.1
N <0.3 0.1
represent about 6% of the mass the char, are not of particular inter-est as they react very rapidly compared to the others. However, the reason for removing them was mainly practical, as fine particles would be deposited on the conveyor belt and part could escape into the atmosphere during feeding and affect the mass balance.
Results of proximate and ultimate analyses of the char pro-duced are also presented inTable 1. Note that the volatile matter content was less than 5%. To complete the characterisation of the fed char,Fig. 3shows the particle size distribution with 80%mass in the particle size range of 2–12 mm.
3. Operation of the CFiB reactor in a reference test
For given operating conditions, many hours of operation of the CFiB Reactor are necessary to achieve steady state. In the following, we describe the operating conditions that defined our reference test and how steady state was reached.
3.1. Operating conditions
The char mass flow-rate was fixed at 28 g/min. It was adjusted to comply with typical operating conditions of two-stage gasifiers in terms of flow-rate per reactor section. Values between 25 and 75 kg m$2h$1were calculated from data given by constructors,
lit-erature[1], and own experiments[14,15]. A char mass flow-rate of 53 kg m$2h$1was chosen.
Regarding gas composition of the gasifying stream, oxygen and steam concentrations were adjusted to respectively, 3% and 30% in order to be representative of industrial processes.
The temperature of the gasifying stream was adjusted to 1000!C. This temperature depends on gas burner adjustment (power and air excess) and bed height. It should be mentioned that due to heat losses above the bed, the higher the bed, the higher the temperature of the gasifying stream. The bed height was fixed at 65 cm like in industrial gasifiers (one- or two-stage gasifiers) the height of the char bed varied between 50 and 100 cm. The reasons for such choices are never explained or justified but are usually based on constructor and operator know-how.
Table 2 summarises the operating conditions and control parameters for the reference test. The main experimental parame-ters can be varied in the following ranges:
– Steam concentration, from 13% to 60%. – Temperature, from 700 to 1050!C. – Charcoal flow-rate, from 0.5 to 4 kg/h. 3.2. Achieving steady state
In the operating conditions described above, the time necessary to reach a steady state is about 7 h. During this period, three differ-ent phases occur successively as shown inFig. 4. First, the reactor is heated with hot gases from gas burners for 2 h without char. The second phase is thermal stabilisation of the reactor that is achieved by continuous injection of char at a nominal flow-rate and regular removal of solid residue. The third phase, called the transient state 0 10 20 30 40 50 60 70 80 90 100 0 5 10 15 20
dp (mm)
Mass (%)
cumulative
differential
Fig. 3. Particle size distribution of the char.
Table 2
Operating conditions for reference test.
Parameters Reference conditions
Reacting gas H2O 30% 3.02 mol/min
CO2 8% 0.81 mol/min
O2 3% 0.274 mol/min
N2 59.3% 5.98 mol/min
Solid Char 28 g/min
Molar ratios H2O/C 1.45
CO2/C 0.40
O2/C 0.13
Temperature 1020!C
Gas velocity 0.68 m/s
Total pressure 1.01 atm.
Ash removal period 10 min
Bed height 650 mm (T4)
phase, is the period needed to achieve a constant char conversion. During this period, all the temperatures are stabilised. As shown in
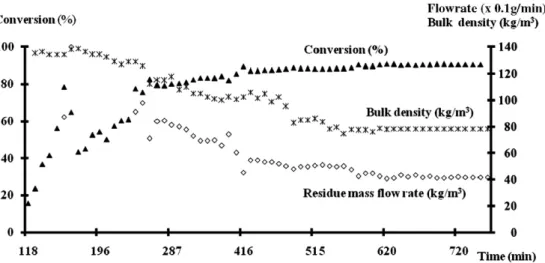
Fig. 5, steady state is confirmed by the simultaneous stabilisation of three measured values: char conversion, the flow-rate of solid residue, and bulk density of solid residue. It should be mentioned that the measurement of this bulk density was carried out, as a first estimate, by weighing a graduated 0.5 l test tube filled up with col-lected solid residue.
Char conversion was greater than 90% after steady state was achieved.
4. Detailed characterisation of a continuous wood char bed during gasification
From experimental results collected at steady state, accurate mass and energy balance were established allowing us to confirm the reliability of the reactor, the instrumentation, and the method-ology. From these balances, we extracted relevant information regarding the respective contributions of each reaction to carbon conversion and to the production/consumption of gas species in terms of mass and energy. Moreover, measurements of profiles of temperature and gas species along the bed represent an original aspect of the present experimental set-up.
4.1. Establishment of mass and energy balances
When steady state is achieved, the concentrations of each gas species are constant over time with a deviation of <2% (mean val-ues are presented inTable 3). H2and CO fractions and thus syngas
lower heating value were low compared to those encountered in industrial staged or downdraft gasifiers where they are in the range 15–25% both for H2and CO, and about 4500 kJ/Nm3for
syn-gas lower heating value. However, such a comparison not really relevant as the objective of our CFiB reactor was to isolate the char bed gasification from the rest of the process. There are several pos-sible reasons for these differences. First, heat losses expressed as a percentage of the unit power, are greater in small reactors such as the CFiBR than in industrial processes. Secondly, the char is cold
when entering in our reactor whereas when entering in the char bed zone of an industrial process, it is over 500!C.
Mass balance of the system has been performed from solid and each gas flow-rates at the inlet and outlet of the char bed. Each gas flow-rate was calculated from gas fractions (Table 3) and using nitrogen as a tracer. Indeed from nitrogen concentration at the in-let (½N2&Air) and at the outlet (½N2&syngas) of the char bed zone, and
from air volume flow-rate _Vairat the inlet, total volume flow-rate
of synthesis gas at the outlet was calculated as follows: _Vsyngas¼ ½N2&
Air
½N2&syngas
_Vair ð3Þ
Next, the volume flow-rate of each gas (i) was calculated following:
_Vi¼ ½i&syngas_Vsyngas ð4Þ
The mass balance presented inTable 4is very satisfactory, with a difference of only 2.5% between total inlet and outlet mass flow-rates. This result confirms the accuracy of the equipment and methodology.
The energy balance was established from measurements of temperature, solid and gases flow-rates at the inlet and the outlet of the char bed, as follows:
_
mcharhcharþXjm_jhj
|fflfflfflfflfflfflfflfflfflfflfflfflfflfflfflfflfflffl{zfflfflfflfflfflfflfflfflfflfflfflfflfflfflfflfflfflffl}
Inlet
$ _mreshres$Xjm_jhj$ _Qlosses
|fflfflfflfflfflfflfflfflfflfflfflfflfflfflfflfflfflfflfflfflfflfflfflffl{zfflfflfflfflfflfflfflfflfflfflfflfflfflfflfflfflfflfflfflfflfflfflfflffl}
Outlet
¼ 0 ð5Þ
Fig. 5. Variations over time of char conversion, solid residue mass flow-rate, and apparent bulk density of solid residue collected at the bottom of the char bed.
Table 3
Molar fractions of gas species produced and gas lower heating value at steady state. Species H2 CO O2 CH4 CO2 H2O N2 Gas lower heating value
kJ/Nm3on dry gas
% mol 15.9 9.8 0.6 0.2 10.8 9.8 52.9 3347
Table 4
Mass balance of the char bed during gasification. INPUT: 302.9 g/min Gas 274.9 g/min Char 28 g/min N2: 175.4 H2O: 55.4 CO2: 35.7 O2: 8.4 OUTPUT: 295.5 g/min Gas 292.4 g/min Solid residue 3.1 g/min N2: 175.4 Collecting box: 3.0 CO2: 57.0 Cyclone: 0.1 CO: 32.9 H2O: 21.0 H2: 3.8 O2: 2.0 CH4: 0.3
hjis the specific enthalpy for gas specie j. It was calculated as:
hjðTÞh0jðT0Þ þ
Z T T0
CpðjÞðTÞdT ð6Þ
h0j, the standard enthalpy and CpðjÞðTÞ, the specific heat are given by
thermodynamic tables. _
mchar and _mres are the mass flow-rates of respectively, the fed
char and the solid residue.
Heat losses _Qlosseswere estimated at 0.77 kW from the
temper-ature at the external wall of the reactor and assuming free convec-tion. Char temperature at the bed inlet was assumed to be 520!C as a mean between char temperature at the entrance and gas tem-perature at the bed inlet.
Using this approach, the global energy balance was very satis-factory, with a difference of 1.73% only between the inlet and outlet.
Given that the heat losses and the inlet temperature of the char have been estimated, we checked that a change in these parame-ters only had a weak influence over the global energy balance. In-deed, a change of +/$20% in heat losses involves a change in the total energy outlet of +/$1.36%; a change of +/$200 !C in the inlet temperature of the char involves a change in total energy at the in-let of +/$1.4%.
4.2. Contribution of the main reactions
From the previous analysis of the gas produced it was possible to derive key information about the chemical reactions involved in the char gasification process.
First, the following set of reactions was selected as representa-tive of the char gasification process:
C þ H2O ! CO þ H2 Steam gasification ð7Þ
C þ CO2! 2CO Boudouard reaction ð8Þ
C þ 2H2! CH4 Methanation ð9Þ
CO þ H2O ! CO2þ H2 Water gas shift ð10Þ
C þ O2! CO2 Combustion ð11Þ
Among these reactions, the water gas shift reaction (Eq.(10)) is the only homogenous reaction; the others are all heterogeneous. The methane reforming reaction was not taken into account, as it is insignificant in our operating conditions (low temperature and pressure).
Secondly, considering this set of reactions, the production of each reaction was fitted by minimising the differences between calculated and measured values for the molar flow-rates of all gas species in the producer gas.Table 5shows the calculated molar flow-rates of each gas for each reaction. The way we completed Ta-ble 5is described below.
First of all, the O2column is easily completed as O2
consump-tion is only due to char oxidaconsump-tion. By using stoichiometry of the char oxidation reaction we were then able to fill in CO2production
and C consumption by this reaction. The same procedure was used for the methanation reaction.
We then simultaneously adjusted CO consumption/production in the remaining three reactions. This was done with a view to minimising the sum of the squares of the deviations calculated in the last line. It should be remembered that when one value is fixed in a line, the stoichiometry of the reaction enables direct determi-nation of the other values in that line. We checked that in the final set of values proposed, each value can be clearly fixed in a range of +/$3%.
It is noteworthy that with a set of only five reactions, the differ-ence between calculated and measured values for each species was
Table 5
Theoretical and experiment molar balance per gas considering a set of five reactions.
Main reactions Molar flow-rates of each gas and solid carbon (mol/min)
H2 O2 CH4 CO CO2 H2O C
Char oxidation (Eq.(9)) $0.20 0.20 $0.20
Steam gasification (Eq.(5)) 1.44 1.44 $1.44 $1.44
Boudouard reaction (Eq.(6)) 0.21 $0.10 $0.10
Methanation (Eq.(7)) $0.04 0.02 $0.02
Water gas shift (Eq.(8)) 0.41 $0.41 0.41 $0.41
Total: calculated value 1.81 $0.20 0.02 1.23 0.51 $1.85 $1.76
Total: measured value 1.89 $0.20 0.02 1.17 0.49 $1.91 $1.85
Deviation :Measured$calculated Measured +4.23% 0.00% 0.00% $5.13% $4.08% $3.14% $4.86% 0% 20% 40% 60% 80% 100% H2 CH4 CO CO2
(b) Species produced
Water Gas-Shift
Methanation
Steam gasification
Boudouard
Combustion
H2 O2 CO CO2 H2O Carbon
(a) Species comsumed
Role of each reaction (%)
0%Role of each reaction (%)
20% 40% 60% 80% 100%
less than 5%. The difference can be explained by the fact that we did not take into account some homogenous reactions of tar crack-ing as some residual volatile matter (less than 5%) was still present in the initial char.
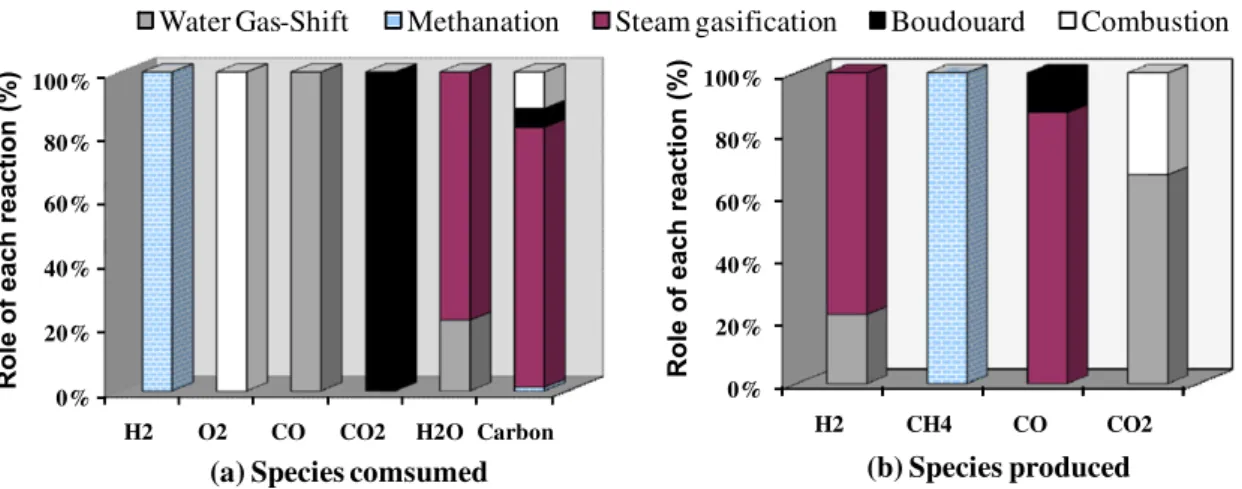
The contribution of each reaction to reacting gas consumption and to gas production is summarised inFig. 6, which is directly ex-tracted fromTable 5.
Fig. 6a shows the contributions of each reaction to carbon conversion:
– Steam gasification: 81%. – Combustion: 11%. – Boudouard reaction: 6%. – Methanation: 1%.
The Boudouard reaction is negligible with respect to steam gas-ification in our operating conditions. This is because the CO2
con-centration is low in the gas and because carbon gasification kinetic by CO2is considerably slower than gasification by steam
[16,17]. Fig. 6b shows the significant contributions of water gas shift (Eq.(10)) to total hydrogen production (22%); as expected, the rest of the hydrogen came from steam gasification (Eq.(7)).
The contributions of each reaction to the energy balance were also calculated and compared to the other sources of energy such as the specific heats of gas and char, and heat losses.Fig. 7first compares the sources of energy provided to the char bed (Fig. 7) and second, the sources of energy consumed by the char bed (Fig. 7b). Regarding energy inputs, the main energy source was the specific heat of gases provided by gas burners and steam gen-erator (75%). Nitrogen and steam were the main sources as they were responsible for respectively, 40% and 25% of this total; the remainder (10%) came from CO2specific heat. Nevertheless, energy
input provided by exothermic reactions was also significant: com-bustion (Eq.(11)) and water gas shift reactions supplied respec-tively, 16.5% and 8.6% of the total incoming energy.
Regarding energy consumption (Fig. 7), steam gasification was an important energy-consuming reaction as it consumed 41% of the total energy. The specific heat of the outlet gas represented
(a) Energy sources
(b) Energy consumption
74.6
16.5
8.6
4.6
Gas specific heat
Combustion
Water Gas Shift
Char specific heat
Methanation
44.3
41.1
10.1
3.90.6
Gas specific heat
Steam gasification
Heat losses
Boudouard
Char specific heat
Fig. 7. Distribution of the sources of energy (a) and energy consumption (b) of the char bed (% of each total).
-20 -10 0 10 20 30 40 50 60 70 700 800 900 1000 1100
T (
°C)
Height (cm) -20 -10 0 10 20 30 40 50 60 70 0 5 10 15 20Relative pressure (mbar)
Height (cm)
44% of the total energy consumed. We understand here the need in industrial processes to make use of the hot gases leaving the gas-ifier either to preheat the gasification agent (steam, air) or to pro-duce external heat (water, steam) for other applications. Finally, heat losses from the external wall of the reactor were significant (10%). But it should be mentioned that the heat losses encountered here are considerably higher than those encountered in industrial size gasifiers, where they represent a few percent at the most. 4.3. Temperature, pressure and gas species concentration profiles
The temperature profile from the top (T2) to the bottom (T8) of
the reactor is presented inFig. 8. The temperature measured by T4
(surface of the bed) oscillated between 950 and 1000!C as the thermocouple was alternately inside or outside the char bed as ex-plained above. The temperature inside the bed decreased rapidly to 850!C in the 10 first cm and decreased slowly through the rest of the bed. Comparable temperature profiles have been reported by other authors during fixed bed gasification of coal[4,18]. This re-sult may be explained by the endothermic reactions (Eqs.(7)and (8)), as discussed above, which occur at the top of the bed or during the char heating step.
Below this zone, the low temperatures considerably slowed down the gasification kinetic and consequently the decrease in the temperature of the bed. In a previous study, we showed that the complete conversion time of an isolated 10 mm particle in 20% steam was 32 min at 930!C and 108 min at 830 !C[19]; the same trends were observed during gasification by CO2[20].
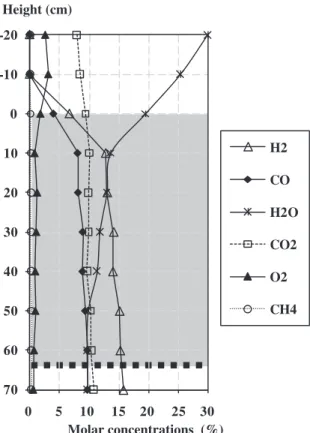
Fig. 9shows the concentrations of axial gas species. Amounts of H2and CO increased rapidly in the 10 first cm to reach about 80% of
their final values. The amount of O2dropped rapidly to zero
con-firming the occurrence of exothermic combustion reaction in the top zone too. Variations in gas fractions indicate the presence of a highly reactive zone at the top of the bed.
The H2O concentration decreased with an increase in CO and
H2; this is relevant with respect to the steam gasification reaction.
It was notable that the concentration of CO2remained relatively
constant along the bed. Actually, many reactions influence the con-centration of CO2: the Boudouard reaction consumes CO2, while
char combustion and water gas shift reactions produce CO2. It thus
appears that production and consumption compensate each other. The established pressure profile is also presented inFig. 8. It shows a total pressure drop of 7 mbar along the bed. This pressure drop is small compared with values reported for industrial gasifi-ers, which generally range between 50 and 75 mbar. This is very probably due to the incomplete conversion of the char at the reac-tor outlet which limited particle fragmentation and the formation of a compact ash bed.
5. Conclusions
The purpose of this work was to design, build and test new experimental equipment to characterise wood char gasification in a continuous fixed bed. Particular attention was paid to the instrumentation, in order to access information such as the tem-perature, gas composition, and pressure all along the char bed.
The unit was tested under operating conditions that are appro-priate for industrial gasifiers. The reliability of both the equipment and the methodology was confirmed by the validation of accurate energy and mass balances. In addition, steady state was shown to be reached during the experiments.
A wood char produced in operating conditions appropriate for two-stage gasifiers was gasified in a Continuous Fixed Bed Reactor (CFiBR). Char bed behaviour was characterised in detail by the real-isation of profiles of temperature, gas species fractions and pres-sure along the bed. We showed that gasification took place mainly in the first 10 cm of the bed where more than 80% of the syngas is produced.
The individual contribution of the main reactions involved was determined. We have shown in particular that steam gasification and combustion were the most efficient reactions in carbon con-version as they contributed respectively, 81% and 11% of carbon consumption. Another important conclusion of this study is the significant role of the water–gas-shift reaction in the gas phase, which produces 22% of the hydrogen.
We demonstrated that the CFiB reactor is an effective tool to precisely understand the gasification of a continuous char bed and to provide all the necessary data for the elaboration and vali-dation of a numerical model of gasifiers.
References
[1] Knoef HAM, editor. Handbook biomass gasification. The Netherland: Biomass Technology Group (BTG); 2005.
[2] Henriksen U, Ahrenfeldt J, Jensen TK, Gøbel B, Bentzen JD, Hindsgaul C, et al. The design, construction and operation of a 75 kW two-stage gasifier. Energy 2006;31:1542–53.
[3] Di Blasi C. Prog Energy Combust Sci 2009;35:121–40.
[4] Krishnudu T, Madhusudhan B, Reddy SN, Sastry VSR, Rao KS, Vaidyeswaran R. Studies in a moving bed pressure gasifier: prediction of reaction zones and temperature profile. Ind Eng Chem Res 1989;28(4):438–44.
[5] Barrio M, Fossum M, Hustad JE. A small-scale stratified downdraft gasifier coupled to a gas engine for combined heat and power production. In: Bridgwater AV, editor. Progress in thermochemical biomass conversion; 2001. p. 426–40.
[6] Yang W, Ponzio A, Lucas C, Blasiak W. Performance analysis of a fixed-bed biomass gasifier using high-temperature air. Fuel Process Technol 2006;87(3):235–45.
[7] Di Blasi C. AIChE J 2004;50:2306–19.
[8] Lv P, Yuan Z, Ma L, Wu C, Chen Y, Zhu J. Hydrogen-rich gas production from biomass air and oxygen/steam gasification in a downdraft gasifier. Renew Energy 2007;32(13):2173–85.
[9] Bhattacharya A, Salam L, Dudukovic MP, Joseph B. Experimental and modeling studies in fixed-bed char gasification. Ind Eng Chem Proc Des Dev 1986;25(4):988–96.
-20
-10
0
10
20
30
40
50
60
70
Molar concentrations (%)
H2
CO
H2O
CO2
O2
CH4
Height (cm)
0 5 10 15 20 25 30
[10] Gobel B, Bentzen JD, Hindsgaul C, Henriksen U, Ahrenfeldt J, Houbak N, et al. High performance gasification with the two-stage gasifier. In: 12th European conference and technology exhibition on biomass for energy, industry and climate protection, Amsterdam; 2002. p. 389–95.
[11] Di Blasi C, Signorelli G, Portoricco G. Countercurrent fixed-bed gasification of biomass at laboratory scale. Ind Eng Chem Res 1999;38:2571–81.
[12] Fassinou WF, Van de steene L, Toure S, Volle G, Girard P. Pyrolysis of Pinus pinaster in a two-stage gasifier: influence of processing parameters and thermal cracking of tar. Fuel Process Technol 2009;90:75–90.
[13] Mermoud F, Salvador S, Van de steene L, Golfier F. Influence of the pyrolysis heating rate on the steam gasification rate of large wood char particles. Fuel 2006;85:1473–82.
[14] Van de steene L., Girard P. Multi agricultural fuelled staged with dry gas cleaning: lift off project. NNE5/2001/704. Final technical report; 2007. [15] Van de Steene L, Pinta F, Alphonsine M, Martin E, Valette J. Gazéification étagée
de plaquette forestière: test et caractérisation d’un réacteur pilote de 75 kWth. Conférence Internationale sur la Valorisation des Déchets et de la Biomasse
Résiduelle dans les Pays en Développement, Ouagadougou, Burkina Faso; 9–11 Juillet 2009.
[16] Harris DJ, Smith IW. Intrinsic. Reactivity of petroleum coke and brown coal char to carbon dioxide, steam and oxygen. In: Proceedings of the combustion institute; 1990, p. 1185–90.
[17] Van den Aarsen FG, Beenackers AACM, Van Swaaij WPM. Wood pyrolysis and carbon dioxide char gasification kinetics in a fluidized bed. In: Overend RP, Milne TA, Mudge LK, editors. Fundamentals of thermochemical biomass conversion. New York: Elsevier; 1985. p. 691–715.
[18] Hobbs ML, Radulovic PT, Smoot LD. Combustion and gasification of coals in fixed-beds. Prog Energy Combust Sci 1993;19:505–86.
[19] Mermoud F, Golfier F, Salvador S, Van de steene L, Dirion JL. Experimental and numerical study of steam gasification of a single charcoal particle. Combust Flame 2006;145:59–79.
[20] Tagutchou JP. Thèse de Doctorat. Gazéification du charbon de plaquettes forestières: particule isolée et lit fixe continu. Université de Perpignan; 2008.